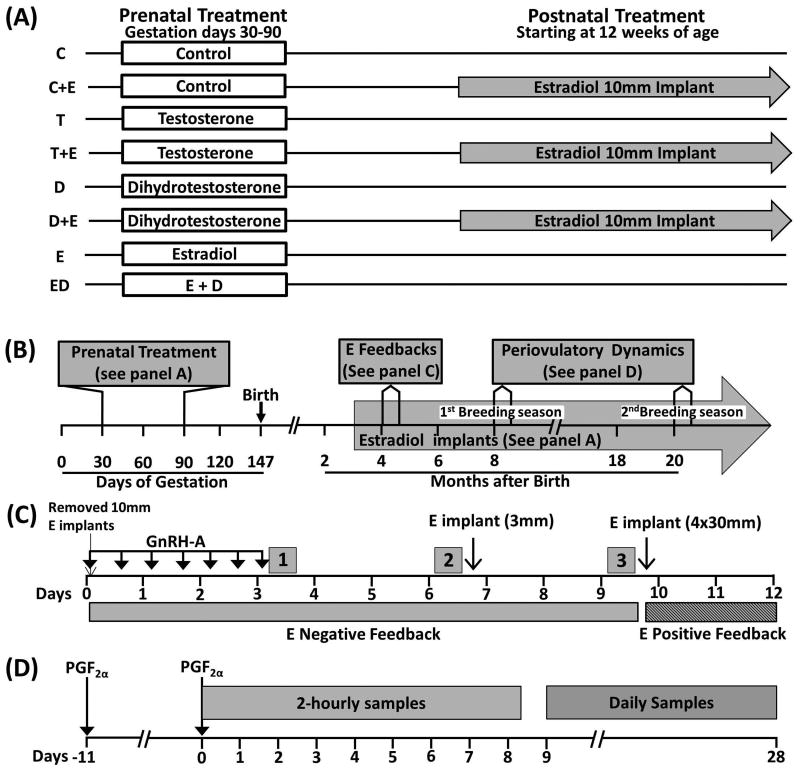
Figure 1.
Schematic showing the study design. (A) Prenatal and postnatal treatment groups. (B) Timeline of studies carried out. (C) Timeline of the E negative and positive feedback studies. Periods 1, 2 and 3 indicate pulse bleed at the end of the GnRH-A treatment, 72h after cessation of the GnRH-A (Pre-E) treatment and 72h after the E-treatment (Post-E), respectively. Hatched bar indicates timing of E positive feedback. (D) Timeline of the assessment of the periovulatory hormonal dynamics carried out during the first and second breeding seasons. Arrows indicate the time of estrous synchronization with PGF2α injections and grey boxes show periods of 2-hourly samples and daily sample collection.

