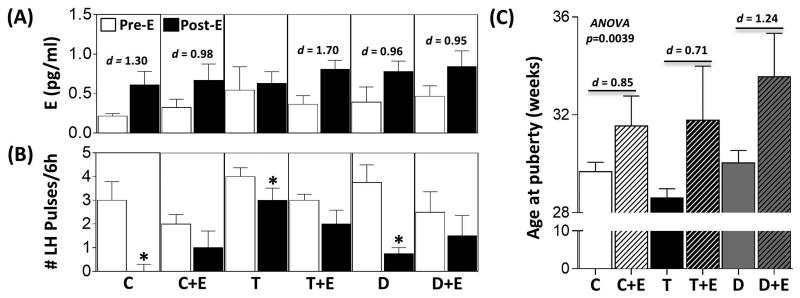
Figure 5.
Results (mean ± SEM) of the E-negative feedback test in postnatal groups are shown in panels A and B and age of puberty in panel C. Panel A shows the circulating concentrations of E pre- and post-E administration. Panel B shows the number of LH pulses over a 6-h period pre- and post-E administration. Asterisks indicate significant difference (p < 0.05) between Pre- and Post-E periods within the respective treatment groups. Note the prenatal treatment only groups C, T and D are repeated from respective panels from Fig. 2, to allow comparison between postnatal groups with prenatal only groups. Cohen's d values as determined by effect size analysis are shown in panel A (Pre E versus Post E) and C (prenatal treatment versus postnatal E).

