Abstract
Motivation: Single Molecule Real-Time (SMRT) sequencing technology and Oxford Nanopore technologies (ONT) produce reads over 10 kb in length, which have enabled high-quality genome assembly at an affordable cost. However, at present, long reads have an error rate as high as 10–15%. Complex and computationally intensive pipelines are required to assemble such reads.
Results: We present a new mapper, minimap and a de novo assembler, miniasm, for efficiently mapping and assembling SMRT and ONT reads without an error correction stage. They can often assemble a sequencing run of bacterial data into a single contig in a few minutes, and assemble 45-fold Caenorhabditis elegans data in 9 min, orders of magnitude faster than the existing pipelines, though the consensus sequence error rate is as high as raw reads. We also introduce a pairwise read mapping format and a graphical fragment assembly format, and demonstrate the interoperability between ours and current tools.
Availability and implementation: https://github.com/lh3/minimap and https://github.com/lh3/miniasm
Contact: hengli@broadinstitute.org
Supplementary information: Supplementary data are available at Bioinformatics online.
1 Introduction
High-throughput short-read sequencing technologies, such as Illumina, have empowered a variety of biological researches and clinical applications that would not be practical with the older Sanger sequencing. However, the short read length (typically a few hundred basepairs) has posed a great challenge to de novo assembly as many repetitive sequences and segmental duplications are longer than the read length and can hardly be resolved by short reads even with paired-end data (Alkan et al., 2011). Although with increased read length and improved algorithms we are now able to produce much better short-read assemblies than a few years ago, the contiguity and completeness of the assemblies are still not as good as Sanger assemblies (Chaisson et al., 2015).
The PacBio’s SMRT technology were developed partly as an answer to the problem with short-read de novo assembly. However, due to the high per-base error rate, around 15%, these reads were only used as a complement to short reads initially (Bashir et al., 2012; Koren et al., 2012; Ribeiro et al., 2012), until Chin et al. (2013) and Koren et al. (2013) demonstrated the feasibility of SMRT-only assembly. Since then, SMRT is becoming the preferred technology for finishing small genomes and producing high-quality Eukaryotic genomes (Berlin et al., 2015).
Oxford Nanopore Technologies (ONT) has recently offered another long-read sequencing technology. Although the per-base error rate was high at the early access phase (Quick et al., 2014), the latest data quality has been greatly improved. Loman et al. (2015) confirmed that we can achieve high-quality bacterial assembly with ONT data alone.
Published long-read assembly pipelines all include four stages: (i) all-vs-all raw read mapping, (ii) raw read error correction, (iii) assembly of error corrected reads and (iv) contig consensus polish. Stage (iii) may involve all-vs-all read mapping again, but as the error rate is much reduced at this step, it is easier and faster than stage (i). Table 1 shows the tools used for each stage. Notably, our tool minimap is a raw read overlapper and miniasm is an assembler. We do not correct sequencing errors, but instead directly produce unpolished and uncorrected contig sequences from raw read overlaps. The idea of correction-free assembly was inspired by talks given by Gene Myers. Sikic et al. (personal communication) are also independently exploring such an approach.
Table 1.
Tools for noisy long-read assembly
| Functionality | Program | Reference |
|---|---|---|
| Raw read overlap | BLASR | Chaisson and Tesler (2012) |
| DALIGNER | Myers (2014) | |
| MHAP | Berlin et al. (2015) | |
| GraphMap | Sovic et al. (2015) | |
| minimap | this article | |
| Error correction | pbdagcon | http://bit.ly/pbdagcon |
| falcon_sense | http://bit.ly/pbfcasm | |
| nanocorrect | Loman et al. (2015) | |
| Assembly | wgs-assembler | Myers et al. (2000) |
| Falcon | http://bit.ly/pbfcasm | |
| ra-integrate | http://bit.ly/raitgasm | |
| miniasm | this article | |
| Consensus polish | Quiver | http://bit.ly/pbquiver |
| nanopolish | Loman et al. (2015) |
As we can see from Table 1, each stage can be achieved with multiple tools. Although we have successfully combined tools into different pipelines, we need to change or convert the input/output formats to make them work together. Another contribution of this article is the proposal of concise mapping and assembly formats, which will hopefully encourage modular design of assemblers and the associated tools.
2 Methods
2.1 General notations
Let be the alphabet of nucleotides. For a symbol is the Watson-Crick complement of a. A string over Σ is also called a DNA sequence. Its length is ; its reverse complement is . For convenience, we define strand function such that and . Here is the set of all DNA sequences.
By convention, we call a k-long DNA sequence as a k-mer. We use the notation to denote a k-long substring of s starting at i. is the set of all k-mers.
2.2 Minimap
2.2.1 Overview of k-mer based sequence similarity search
BLAST (Altschul et al., 1997) and BLAT (Kent, 2002) are among the most popular sequence similarity search tools. They use one k-mer hash function to hash k-mers at the positions of a target sequence and keep the hash values in a hash table. Upon query, they use the same hash function on every k-mer of the query sequence and look up the hash table for potential matches. If there are one or multiple k-mer matches in a small window, these aligners extend the matches with dynamic programming to construct the final alignment.
DALIGNER (Myers, 2014) does not use a hash table. It instead identifies k-mer matches between two sets of reads by sorting k-mers and merging the sorted lists. DALIGNER is fast primarily because sorting and merging are highly cache efficient.
MHAP (Berlin et al., 2015) differs from others in the use of MinHash sketch (Broder, 1997). Briefly, given a read sequence s and m k-mer hash functions , MHAP computes with each hash function , and takes list , which is called the sketch of s, as a reduced representation of s. Suppose and are the sketches of two reads, respectively. When the two reads are similar to each other or have significant overlaps, there are likely to exist multiple j such that . Potential matches can thus be identified. A limitation of MinHash sketch is that it always selects a fixed number of hash values regardless of the length of the sequences. This may waste space or hurt sensitivity when input sequences vary greatly in lengths.
Minimap is heavily influenced by all these works. It adopts the idea of sketch like MHAP but takes minimizers (Roberts et al., 2004; Schleimer et al., 2003) as a reduced representation instead; it stores k-mers in a hash table like BLAT and MHAP but also uses sorting extensively like DALIGNER. In addition, minimap is designed not only as a read overlapper but also as a read-to-genome and genome-to-genome mapper. It has more potential applications.
2.2.2 Computing minimizers
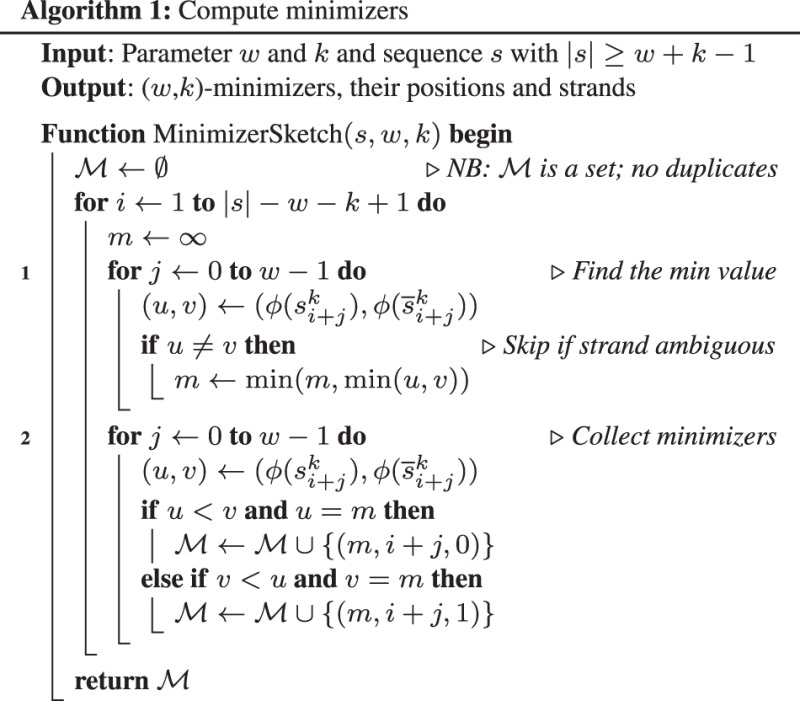
Loosely speaking, a (w, k)-minimizer of a string is the smallest k-mer in a surrounding window of w consecutive k-mers. Formally, let be a k-mer hash function. A double-strand -minimizer, or simply a minimizer, of a string s, , is a triple (h, i, r) such that there exists which renders
Let be the set of minimizers of s. Algorithm 1 gives the pseudocode to compute in time. Our actual implementation is close to in average case. It uses a queue to cache the previous minimals and avoids the loops at line 1 and 2 most of time. In practice, time spent on collecting minimizers is insignificant.
A natural choice of hash function is to let , and and for a k-mer , define
This hash function always maps a k-mer to a distinct 2k-bit integer. A problem with this is that poly-A, which is often highly enriched in genomes, always gets zero, the smallest value. We may oversample these non-informative poly-A and hurt practical performance. To alleviate this issue, we use function instead, where h is an invertible integer hash function on (Algorithm 2; http://bit.ly/invihgi). The invertibility of h is not essential, but as such never maps two distinct k-mers to the same 2k-bit integer, it helps to reduce hash collisions.
Note that in a window of w consecutive k-mers, there may be more than one minimizers. Algorithm 1 keeps them all with the loop at line 2. This way, a minimizer of s always corresponds to a minimizer of .
For read overlapping, we use k = 15 and w = 5 to find minimizers.

2.2.3 Indexing
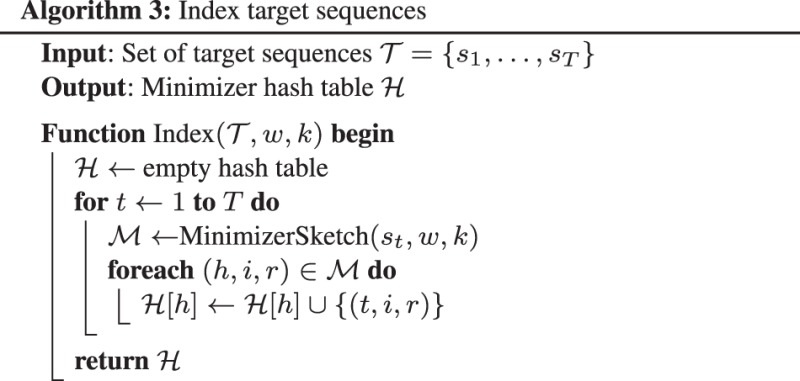
Algorithm 3 describes indexing target sequences. It keeps minimizers of all target sequences in a hash table where the key is the minimizer hash and the value is a set of target sequence index, the position of the minimizer and the strand (packed into one 64-bit integer).
In implementation, we do not directly insert minimizers to the hash table. Instead, we append minimizers to an array of two 64-bit integers (one for minimizer sequence and one for position) and sort the array after collecting all minimizers. The hash table keeps the intervals on the sorted array. This procedure dramatically reduces heap allocations and cache misses, and is supposedly faster than direct hash table insertion.
2.2.4 Mapping
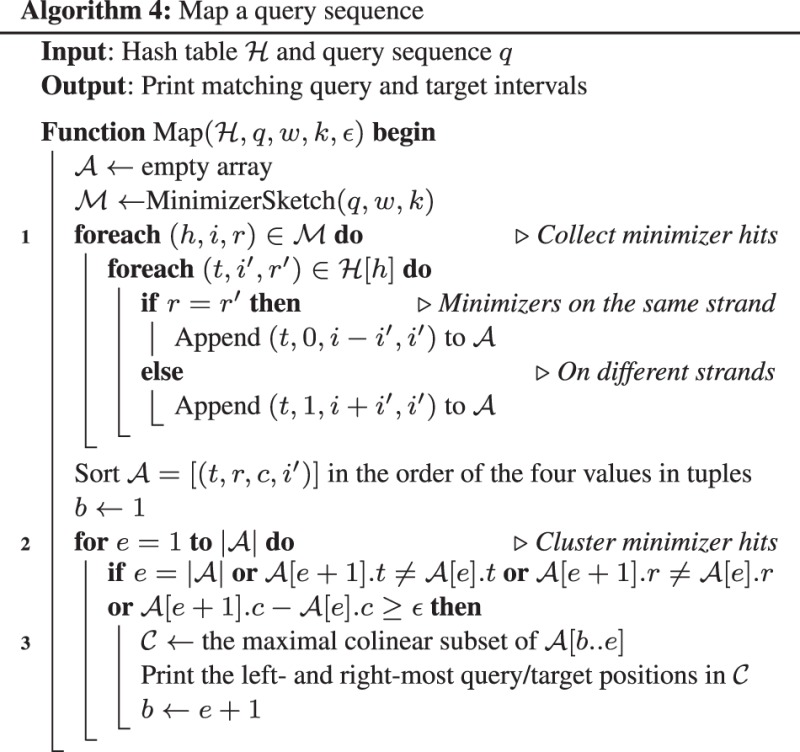
Given two sequences s and , we say we find a minimizer hit if there exist and with (⊕ is the XOR operator). Here h is the minimizer hash value, x indicates the relative strand and i and are the positions on the two sequences, respectively. We say two minimizer hits and are ϵ-away if 1) x = 0 and or 2) x = 1 and . Intuitively, ϵ-away hits are approximately colinear within a band of width ϵ (500bp by default). Given a set of minimizer hits , we can cluster for x = 0 or for x = 1 to identify long colinear matches. This procedure is inspired by Hough Transformation mentioned by Sovic et al. (2015).
Algorithm 4 gives the details of the mapping algorithm. The loop at line 1 collects minimizer hits between the query and all the target sequences. The loop at line 2 performs a single-linkage clustering to group approximately colinear hits. Some hits in a cluster may not be colinear because two minimizer hits within distance ϵ are always ϵ-away. To fix this issue, we find the maximal colinear subset of hits by solving a longest increasing sequencing problem (line 3). This subset is the final mapping result. In practical implementation, we set thresholds on the size of the subset (4 by default) and the number of matching bases in the subset to filter poor mappings (100 for read overlapping).
2.3 Assembly graph
Two strings v and w may be mapped to each other based on their sequence similarity. If v can be mapped to a substring of w, we say w contains v. If a suffix of v and a prefix of w can be mapped to each other, we say v overlaps w, written as . If we regard strings v and w as vertices, the overlap relationship defines a directed edge between them. The length of equals the length of v’s prefix that is not in the prefix–suffix match.
Let be a graph without multi-edges, where V is a set of DNA sequences (vertices), E a set of overlaps between them (edges) and is the edge length function. G is said to be Watson-Crick complete if (i) and (ii) . G is said to be containment-free if any sequence v is not contained in other sequences in V. If G is both Watson–Crick complete and containment-free, it is an assembly graph. By definition, any vertex v has a complement vertex in the graph and any edge has a complement edge . Let be the outdegree of v and be the indegree. It follows that .
An assembly graph has the same topology as a string graph (Myers, 2005), though the interpretation of the vertex set V is different. In a string graph, V is the set of the two ends of sequences, not the set of forward and reverse-complemented sequences. De Bruijn graph can be regarded as a special case of overlap graph. It is also an assembly graph.
In an assembly graph, an edge is transitive if there exist and . Removing a transitive edge does not affect the connectivity of the graph. A vertex v is a tip if and . The majority of tips are caused by artifacts or missing overlaps. A bubble is a directed acyclic subgraph with a single source v and a single sink w having at least two paths between v and w, and without connecting the rest of the graph. The bubble is tight if and . A bubble may be caused by missing overlaps or by variants between haplotypes in multi-ploidy samples or paralogs. It is preferred to collapse bubbles for high contiguity, though this introduces loss of information.
2.4 Miniasm
2.4.1 Trimming reads
Raw read sequences may contain artifacts such as untrimmed adapters and chimaera. The first step of assembly to reduce such artifacts by examining read-to-read mappings. For each read, miniasm computes per-base coverage based on good mappings against other reads (longer than 2000 bp with at least 100 bp non-redundant bases on matching minimizers). It then identifies the longest region having coverage three or more, and trims bases outside this region.
2.4.2 Generating assembly graph
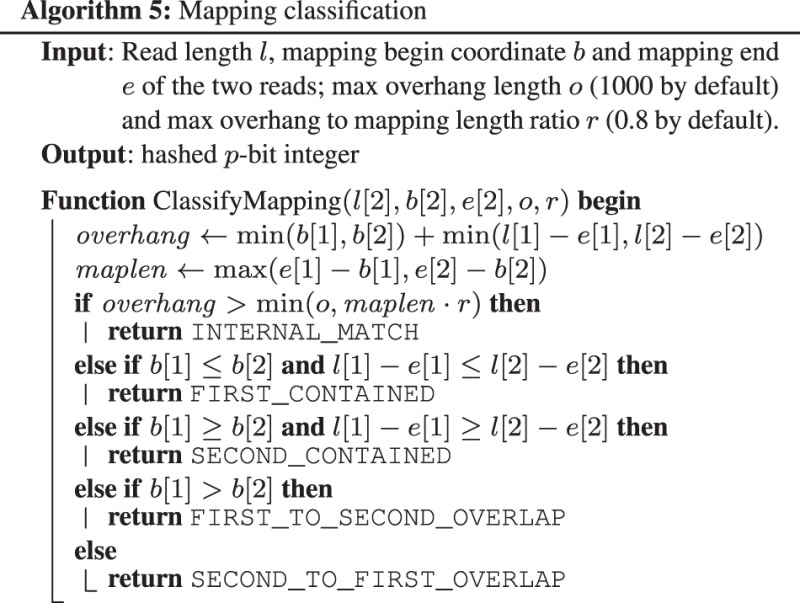
For each trimmed mapping, miniasm applies Algorithm 5 to classify the mapping (see also Fig. 1 for the explanation of input variables). It ignores internal matches, drops contained reads and adds overlaps to the assembly graph. For a pair of reads, miniasm uses the longest overlap only to avoid multi-edges.
Fig. 1.

Mapping between two reads. and are the 0-based starting and ending mapping coordinates of the first read v, respectively. and are the mapping coordinates of read w. Lightgray areas indicate overhang regions that should be mapped together if the overlap is real. If the overhang regions are small enough, the figure implies an edge with approximate length and its complement edge with
2.4.3 Graph cleaning
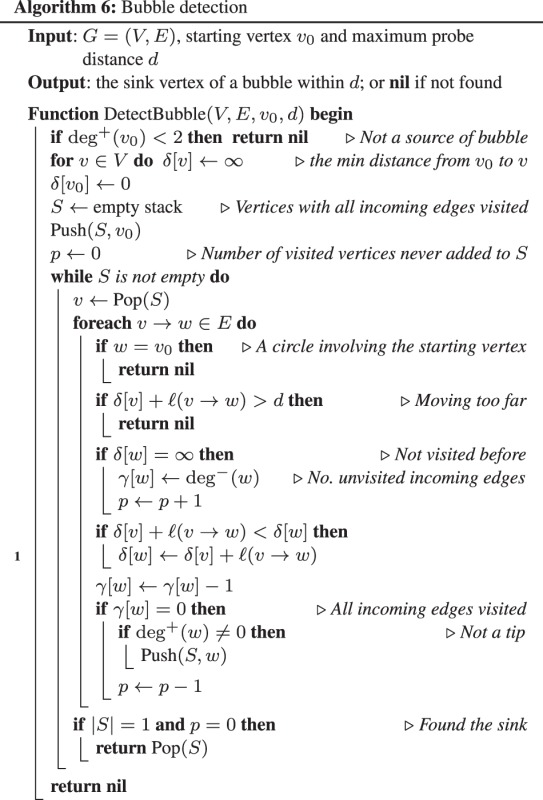
After constructing the assembly graph, miniasm removes transitive edges (Myers, 2005), trims tipping unitigs composed of few reads (4 by default) and pops small bubbles (Zerbino and Birney, 2008). Algorithm 6 detects bubbles where the longest path is shorter than d (50 kb by default). It is adapted from Kahn’s topological sorting algorithm (Kahn, 1962). It starts from the potential source and visits a vertex when all its incoming edges are visited before. Algorithm 6 only detects bubbles. We can keep track of the optimal parent vertex at line 1 and then backtrack to collapse bubbles to a single path. Fermi (Li, 2012) uses a similar algorithm except that it keeps two optimal paths through the bubble. Onodera et al. (2013) and Brankovic et al. (2015) have also independently found similar algorithms.
In addition, if and exist and , miniasm removes if is small enough (70% by default). When there are longer overlaps, shorter overlaps after transitive reduction may be due to repeats. However, non-repetitive overlaps may also be removed at a small chance, which leads to missing overlaps and misassemblies.
2.4.4 Generating unitig sequences
If there are no multi-edges in the assembly graph, we can use to represent a path consisting of k vertices. The sequence spelled from this path is the concatenation of vertex substrings: , where is the substring between i and j inclusive, and is the string concatenation operator.
In a transitively reduced graph, a unitig (Myers et al., 2000) is a path such that and (i) or (ii) and . Its sequence is the sequence spelled from the path. Intuitively, a unitig is a maximal path on which adjacent vertices can be ‘unambiguously merged’ without affecting the connectivity of the original assembly graph.
As miniasm does not correct sequencing errors, the error rate of unitig sequence is the same as the error rate of the raw input reads. It is in theory possible to derive a better unitig sequence by taking the advantage of read overlaps. We have not implemented such a consensus tool yet.
2.5 Formats: pairwise read mapping format and graphical fragment assembly format
2.5.1 Pairing mapping format
Pairwise read mapping format (PAF) is a lightweight format keeping the key mapping information (Table 2). Minimap outputs mappings in PAF, which are taken by miniasm as input for assembly. We also provide scripts to convert DALIGNER, MHAP and SAM formats to PAF.
Table 2.
Pairwise mapping format (PAF)
| Col | Type | Description |
|---|---|---|
| 1 | string | Query sequence name |
| 2 | int | Query sequence length |
| 3 | int | Query start coordinate (BED-like) |
| 4 | int | Query end coordinate (BED-like) |
| 5 | char | ‘+’ if query and target on the same strand; ‘–’ if opposite |
| 6 | string | Target sequence name |
| 7 | int | Target sequence length |
| 8 | int | Target start coordinate on the original strand |
| 9 | int | Target end coordinate on the original strand |
| 10 | int | Number of matching bases in the mapping |
| 11 | int | Number bases, including gaps, in the mapping |
| 12 | int | Mapping quality (0–255 with 255 for missing) |
PAF is TAB-delimited text format with each line consisting of the above fixed fields. When the alignment is available, column 11 equals the total number of sequence matches, mismatches and gaps in the alignment. Column 10 divided by column 11 gives the alignment identity. If the detailed alignment is not available, column 10 and 11 can be approximate. PAF may optionally have additional fields in the SAM-like typed key-value format (Li et al., 2009).
2.5.2 Graphical fragment assembly format
Graphical fragment assembly format (GFA) is a concise assembly format (Table 3; http://bit.ly/gfaspec) initially proposed by us prior to miniasm and later improved by community (Melsted et al., personal communication). GFA has an explicit relationship to an assembly graph—an ‘S’ line in the GFA corresponds to a vertex and its complement in the graph; an ‘L’ line corresponds to an edge and its complement. GFA is able to represent graphs produced at all the stages of an assembly pipeline, from initial read overlaps to the unitig relationship in the final assembly.
Table 3.
Graphical fragment assembly format (GFA)
| Line | Comment | Fixed fields |
|---|---|---|
| H | Header | N/A |
| S | Segment | segName,segSeq |
| L | Overlap | segName1, segOri1, segName2, segOri2, CIGAR |
GFA is a line-based TAB-delimited format. Each line starts with a single letter determining the interpretation of the following TAB-delimited fields. In GFA, segment refers to a read or a unitig. A line start with ‘S’ gives the name and sequence of a segment. When the sequence is not available, it can be a star ‘*’. Overlaps between segments are represented in lines starting with ‘L’, giving the names and orientations of the two segments in an overlap. The last field ‘CIGAR’ on an ‘L’-line describes the detailed alignment of the overlap if available. In addition to the types of lines in the table, GFA may contain other line types starting with different letters. Each line may optionally have additional SAM-like typed key-value pairs.
FASTG (http://bit.ly/fastgfmt) is another assembly format prior to GFA. It uses different terminologies. A vertex in an assembly graph is called an edge in FASTG, and an edge is called an adjacency. In FASTG, subgraphs can be nested, though no tools work with nested graphs due to technical complications. In addition, with nesting, one assembly graph can be represented in distinct ways, which we regard as a limitation of FASTG.
2.6 Evaluating the layout accuracy
Miniasm outputs the approximate positions of trimmed reads on the resulting unitigs. We extract these reads, map to the true assembly with minimap (option: ‘-L100 -m0 -w5’) and select the best mapping for each read. For a read i, let be the unitig name and be its index on (i.e. read i is the th read on the unitig). If two reads i and j are mapped adjacently on the true assembly, we say the adjacency is w-consistent, if (i) and , or (ii) both read i and j are the first or the last w reads of some unitigs. We use w = 5 to detect large structural misassemblies.
3 Results
3.1 The accuracy of minimap
We mapped a human PacBio run ‘m130928_232712_42213_*.1.*’ (http://bit.ly/chm1p5c3) with minimap and BWA-MEM (Li, 2013) against GRCh37 plus decoy sequences (http://bit.ly/GRCh37d5). We started from 23 235 reads (131 Mb), filtered out 7593 reads (10 Mb) without ≥2 kb BWA-MEM alignments, and further dropped 815 reads (11 Mb) with two or more ≥2 kb chimeric alignments and 598 reads (4 Mb) with mapping quality below 10. Of the remaining reads, we found only 2.0% not overlapping the best minimap mapping of the same read. The majority of them hit to the decoy sequence where defining the true alignment is challenging as decoy is enriched with incomplete segments of centromeric repeats. If we exclude hits to the decoy, the percentage drops to 0.7%. On this input, minimap is 50 times faster than BWA-MEM, while finding similar best mapping positions. This experiment evaluates both the sensitivity and the specificity of minimap: if minimap had low sensitivity, it would miss the BWA-MEM mapping completely; if minimap had low specificity, its best mapping would often be a wrong mapping.
To test the sensitivity for read overlapping, we aligned all reads from PBcR-PB-ec (Table 4) against the reference genome with BWA-MEM, extracted reads with mapping quality ≥10, and identified ≥2kb overlaps between the extracted reads based on their positions on the reference genome. Minimap finds 93% of these overlaps. It is more sensitive than MHAP in its sensitive mode (78%) but less than DALIGNER (98%).
Table 4.
Evaluation datasets
| Name | Species | Size | Cov. | N50 |
|---|---|---|---|---|
| PB-ce-40X | Caenorhabditis elegans | 104M | 45 | 16 572 |
| ERS473430 | Citrobacter koseri | 4.9M | 106 | 7543 |
| ERS544009 | Yersinia pseudotuberculosis | 4.7M | 147 | 9002 |
| ERS554120 | Pseudomonas aeruginosa | 6.4M | 90 | 7106 |
| ERS605484 | Vibrio vulnificus | 5.0M | 155 | 5091 |
| ERS617393 | Acinetobacter baumannii | 4.0M | 237 | 7911 |
| ERS646601 | Haemophilus influenzae | 1.9M | 258 | 4081 |
| ERS659581 | Klebsiella sp. | 5.1M | 129 | 8031 |
| ERS670327 | Shimwellia blattae | 4.2M | 155 | 6765 |
| ERS685285 | Streptococcus sanguinis | 2.4M | 224 | 5791 |
| ERS743109 | Salmonella enterica | 4.8M | 188 | 6051 |
| PB-ecoli | Escherichia coli | 4.6M | 160 | 13 976 |
| PBcR-PB-ec | Escherichia coli | 4.6M | 30 | 11 757 |
| PBcR-ONT-ec | Escherichia coli | 4.6M | 29 | 9356 |
| MAP-006-1 | Escherichia coli | 4.6M | 54 | 10 892 |
| MAP-006-2 | Escherichia coli | 4.6M | 30 | 10 794 |
| MAP-006-pcr-1 | Escherichia coli | 4.6M | 30 | 8080 |
| MAP-006-pcr-2 | Escherichia coli | 4.6M | 60 | 8064 |
Evaluation dataset name, species, reference genome size, theoretical sequencing coverage and the N50 read length. Names starting with ‘MAP’ are unpublished recent ONT data provided by the Loman lab (http://bit.ly/loman006). Names starting with ‘ERS’ are accession numbers of unpublished PacBio data from the NCTC project (http://bit.ly/nctc3k). PB-ecoli and PB-ce-40X are PacBio public datasets sequenced with the P6/C4 chemistry (http://bit.ly/pbpubdat; retrieved on 11/03/2015). PBcR-PB-ec is the PacBio sample data (P5/C3 chemistry) used in the tutorial of the PBcR pipeline; PBcR-ONT-ec is the ONT example originally used by Loman et al. (2015). ‘pls2fasta –trimByRegion’ was applied to ERS* and PB-ecoli datasets as they do not provide read sequences in the FASTQ format.
3.2 Assembling bacterial genomes
We evaluated the performance of miniasm on 17 bacterial datasets (Table 4) with command line ‘minimap -Sw5 -L100 -m0 reads.fa reads.fa miniasm -f reads.fa -’. Miniasm is able to derive a single contig per chromosome/plasmid for all but four datasets: 3 extra >50 kb contigs for ERS554120, and 1 extra contig for ERS605484, PBcR-ONT-ec and MAP-006-pcr-1 each. In the dotter plot between the assembly and the reference genome (similar to Fig. 2), no large-scale misassemblies are observed. We also applied the method in Section 2.6. Except ERS473430, the miniasm layouts are 5-consistent with the reference assemblies. For ERS473430, the NCTC project page claimed the sample has a plasmid. Miniasm gives two contigs, but the NCTC assembly has one contig only. The difference in layout may be an error in the NCTC assembly.
Fig. 2.
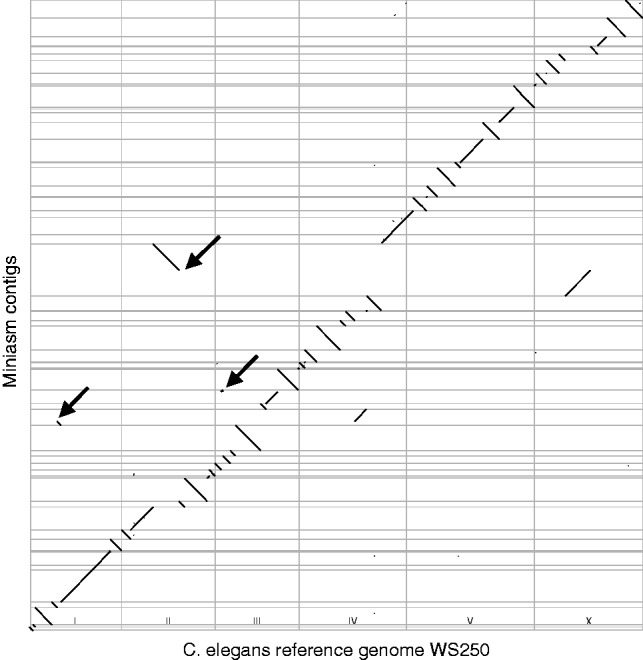
Dotter plot comparing the miniasm assembly and the C.elegans reference genome. Thin gray lines mark the contig or chromosome boundaries. The three arrows indicate large-scale misassemblies visible from the plot. The mapping is done with ‘minimap-L500’
We have also run the PBcR pipeline (Berlin et al., 2015). PBcR requires a spec file. We took ‘pacbio.spec’ from the PBcR-PB-ec example and ‘oxford.spec’ from PBcR-ONT-ec, and applied them to all datasets based on their data types. MAP* datasets only provide FASTA sequences for download. We assigned quality 9 to all bases as PBcR requires base quality. PBcR assembled all PacBio datasets without extra contigs longer than 50 kb—better than miniasm. However, on the ONT datasets, PBcR produced more fragmented assemblies for MAP-006-2, MAP-006-pcr-1 and MAP-006-pcr-2; the PBcR-ONT-ec assembly is 300 kb shorter.
With four CPU cores, it took miniasm 14 s to assemble the 30-fold PBcR-PB-ec dataset and 2 minutes to assemble the 160-fold PB-ecoli dataset. PBcR, with four CPU cores, too, is about 700 times slower on PBcR-PB-ecoli and 60 times slower on PB-ecoli. It is slower on low-coverage data because PBcR automatically switches to the slower sensitive mode. Here we should remind readers that without an error correction stage, the contig sequences generated by miniasm are of much lower accuracy in comparison to PBcR. Nonetheless, miniasm is still tens of times faster than PBcR excluding the time spent on error correction.
3.3 Assembling a Caenorhabditis elegans genome
We assembled a 45-fold C.elegans dataset (Table 4). With 16 CPU cores, miniasm assembled the data in 9 min, achieving an N50 size 2.8 Mb. From the dotter plot (Fig. 2), we observed three structural misassemblies (readers are advised to zoom into the vector graph to see the details). PacBio has assembled the same dataset with HGAP3 (Chin et al., 2013). HGAP3 produces shorter contigs (N50 = 1.6 Mb), but does not incur large-scale misassemblies visible from the dotter plot between the C.elegans reference genome and the contigs.
When we take the C.elegans reference genome as the truth, the method in Section 2.6 also identifies the three structural misassemblies. The method additionally finds eight intra-unitig and one inter-unitig inconsistencies. In all cases, miniasm agrees with HGAP3, suggesting these inconsistencies may be true structural variations between the reference strain and the sequenced strain.
We have also tried PBcR on this dataset. Based on the intermediate progress report, we estimated that with 16 CPU cores, it would take a week or so to finish the assembly in the automatically chosen ‘sensitive’ mode.
For this dataset, minimap takes 27 GB RAM at the peak. As minimap loads 4 Gbp bases to index, the peak RAM will be capped around 27 GB. The memory used by miniasm is proportional to the number of overlaps. Although it only takes 1.3 GB RAM here, it will become the limiting factor for larger datasets.
3.4 Switching read overlappers
Miniasm also works with other overlappers when we convert their output format to PAF. On the 30-fold PBcR-PB-ec dataset, we are able to produce a single contig with DALIGNER (option -k15–h50), MHAP (option –pacbio-sensitive) and GraphMap (option -w owler). DALIGNER is the fastest, taking 65 s with four CPUs. Minimap is five times as fast on this dataset and is 18 times as fast on PB-ecoli at 160-fold. Minimap is faster on larger datasets possibly because without staging all possible hits in RAM, minimap is able to process more reads in a batch while a large batch usually helps performance. We should note that DALIGNER generates alignments while minimap does not. Minimap would probably have a similar performance if it included an alignment step.
4 Discussions
Miniasm implements the ‘O’ and ‘L’ steps in the Overlap-Layout-Consensus (OLC) assembly paradigm. It confirms long noisy reads can be assembled without an error correction stage, and without this stage, the assembly process can be greatly accelerated and simplified, while achieving comparable contiguity and large-scale accuracy to existing pipelines, at least for genomes without excessive repetitive sequences. Although without the ‘C’ step, miniasm cannot produce high-quality consensus for many analyses, it opens the door to ultrafast assembly if we can develop a fast consensus tool matching the speed of minimap and miniasm. In addition, MinION has a ‘read-until’ mode, allowing users to pause sequencing and reload samples. Fast layout by miniasm could already help to decide if enough data have been collected.
Our main concern with miniasm is that when we look at a low-identity match between two noisy reads, it is difficult to tell whether the low identity is caused by the stochastically higher base error rate on reads, or because reads come from two recent segmental duplications. In comparison, error correction takes the advantage of multiple reads and in theory has more power to distinguish high error rate from duplications/repeats. Bacteria and C.elegans evaluated in this article are repeat sparse. We are yet to know the performance of miniasm given repeat-rich genomes. In addition, miniasm has not been optimized for large repeat-rich genomes. It reads all hits into RAM, which may not be practical when there are too many. We need to filter repetitive hits, introduce disk-based algorithms (e.g. for sorting) or stream hits before removing contained reads. Working with large complex genomes will be an important future direction.
Oxford Nanopore is working on PromethION and PacBio will ship PacBio Sequel later this year. Both sequencers promise significantly reduced sequencing cost and increased throughput, which may stimulate the adoption of long-read sequencing and subsequently the development of long-read mappers and assemblers. We hope in this process, the community could standardize the input and output formats of various tools, so that a developer could focus on a component he or she understands best. Such a modular approach has been proved to be fruitful in the development of short-read tools—in fact, the best short-read pipelines all consist of components developed by different groups—and will be equally beneficial to the future development of long-read mappers and assemblers.
Supplementary Material
Acknowledgements
We thank Páll Melsted for maintaining the GFA spec and are grateful to Gene Myers, Jason Chin, Adam Phillippy, Jared Simpson, Zamin Iqbal, Nick Loman and Ivan Sovic for their presentations, talks, comments on social media and unpublished works which have greatly influenced and helped the development of minimap and miniasm.
Funding
NHGRI U54HG003037; NIH GM100233.
Conflict of Interest: none declared.
References
- Alkan C. et al. (2011) Limitations of next-generation genome sequence assembly. Nat. Methods, 8, 61–65. [DOI] [PMC free article] [PubMed] [Google Scholar]
- Altschul S.F. et al. (1997) Gapped BLAST and PSI-BLAST: a new generation of protein database search programs. Nucleic Acids Res., 25, 3389–3402. [DOI] [PMC free article] [PubMed] [Google Scholar]
- Bashir A. et al. (2012) A hybrid approach for the automated finishing of bacterial genomes. Nat. Biotechnol., 30, 701. [DOI] [PMC free article] [PubMed] [Google Scholar]
- Berlin K. et al. (2015) Assembling large genomes with single-molecule sequencing and locality-sensitive hashing. Nat. Biotechnol., 33, 623–630. [DOI] [PubMed] [Google Scholar]
- Brankovic L. et al. (2015) Linear-time superbubble identification algorithm for genome assembly. Theor. Comput. Sci, 609, 374–383. [Google Scholar]
- Broder A.Z. (1997) On the resemblance and containment of documents In: Compression and Complexity of Sequences, pp. 21–29. [Google Scholar]
- Chaisson M.J., Tesler G. (2012) Mapping single molecule sequencing reads using basic local alignment with successive refinement (blasr): application and theory. BMC Bioinformatics, 13, 238.. [DOI] [PMC free article] [PubMed] [Google Scholar]
- Chaisson M.J.P. et al. (2015) Genetic variation and the de novo assembly of human genomes. Nat. Rev. Genet., 16, 627–640. [DOI] [PMC free article] [PubMed] [Google Scholar]
- Chin C.S. et al. (2013) Nonhybrid, finished microbial genome assemblies from long-read smrt sequencing data. Nat. Methods, 10, 563–569. [DOI] [PubMed] [Google Scholar]
- Kahn A.B. (1962) Topological sorting of large networks. Commun. ACM, 5, 558–562. [Google Scholar]
- Kent W.J. (2002) BLAT–the BLAST-like alignment tool. Genome Res., 12, 656–664. [DOI] [PMC free article] [PubMed] [Google Scholar]
- Koren S. et al. (2012) Hybrid error correction and de novo assembly of single-molecule sequencing reads. Nat. Biotechnol., 30, 693–700. [DOI] [PMC free article] [PubMed] [Google Scholar]
- Koren S. et al. (2013) Reducing assembly complexity of microbial genomes with single-molecule sequencing. Genome Biol., 14, R101. [DOI] [PMC free article] [PubMed] [Google Scholar]
- Li H. (2012) Exploring single-sample SNP and INDEL calling with whole-genome de novo assembly. Bioinformatics, 28, 1838–1844. [DOI] [PMC free article] [PubMed] [Google Scholar]
- Li H. (2013). Aligning sequence reads, clone sequences and assembly contigs with bwa-mem. arXiv:1303.3997.
- Li H. et al. (2009) The sequence alignment/map format and samtools. Bioinformatics, 25, 2078–2079. [DOI] [PMC free article] [PubMed] [Google Scholar]
- Loman N.J. et al. (2015) A complete bacterial genome assembled de novo using only nanopore sequencing data. Nat. Methods, 12, 733–735. [DOI] [PubMed] [Google Scholar]
- Myers E.W. (2005) The fragment assembly string graph. Bioinformatics, 21, ii79–ii85. [DOI] [PubMed] [Google Scholar]
- Myers E.W. et al. (2000) A whole-genome assembly of Drosophila. Science, 287, 2196–2204. [DOI] [PubMed] [Google Scholar]
- Myers G. (2014). Efficient local alignment discovery amongst noisy long reads. In: Brown,D. G. and Morgenstern,B. (eds.) Proceedings Algorithms in Bioinformatics – 14th International Workshop, WABI 2014, Wroclaw, Poland, September 8–10, 2014, Springer, vol. 8701, pp. 52–67.
- Onodera T. et al. (2013). Detecting superbubbles in assembly graphs In: Darling A.E., Stoye J. (eds.) In: WABI, volume 8126 of Lecture Notes in Computer Science, Springer, pp. 338–348. [Google Scholar]
- Quick J. et al. (2014). A reference bacterial genome dataset generated on the minionTM portable single-molecule nanopore sequencer. Gigascience, 3, 22. [DOI] [PMC free article] [PubMed] [Google Scholar]
- Ribeiro F.J. et al. (2012) Finished bacterial genomes from shotgun sequence data. Genome Res, 22, 2270–2277. [DOI] [PMC free article] [PubMed] [Google Scholar]
- Roberts M. et al. (2004) Reducing storage requirements for biological sequence comparison. Bioinformatics, 20, 3363–3369. [DOI] [PubMed] [Google Scholar]
- Schleimer S. et al. (2003). Winnowing: Local algorithms for document fingerprinting. In: Halevy,A.Y., Ives,Z.G., and Doan,A. (eds.) Proceedings of the 2003 ACM SIGMOD International Conference on Management of Data, San Diego, California, USA, June 9–12, 2003, ACM, pp. 76–85.
- Sovic I. et al. (2015) Fast and sensitive mapping of error-prone nanopore sequencing reads with graphmap. doi: http://dx.doi.org/10.1101/020719. [DOI] [PMC free article] [PubMed]
- Zerbino D.R., Birney E. (2008) Velvet: algorithms for de novo short read assembly using de Bruijn graphs. Genome Res., 18, 821–829. [DOI] [PMC free article] [PubMed] [Google Scholar]
Associated Data
This section collects any data citations, data availability statements, or supplementary materials included in this article.


