

Abstract
Background
Despite evidence for higher risk of coronary artery disease among HIV+ individuals, the underlying mechanisms are not well understood. We investigated associations of inflammatory markers with subclinical coronary artery disease in 923 participants of the Multicenter AIDS Cohort Study (575 HIV+ and 348 HIV− men) who underwent noncontrast computed tomography scans for coronary artery calcification, the majority (n=692) also undergoing coronary computed tomography angiography.
Methods and Results
Outcomes included presence and extent of coronary artery calcification, plus computed tomography angiography analysis of presence, composition, and extent of coronary plaques and severity of coronary stenosis. HIV+ men had significantly higher levels of interleukin‐6 (IL‐6), intercellular adhesion molecule‐1, C‐reactive protein, and soluble‐tumor necrosis factor‐α receptor (sTNFαR) I and II (all P<0.01) and a higher prevalence of noncalcified plaque (63% versus 54%, P=0.02) on computed tomography angiography. Among HIV+ men, for every SD increase in log‐interleukin‐6 and log intercellular adhesion molecule‐1, there was a 30% and 60% increase, respectively, in the prevalence of coronary stenosis ≥50% (all P<0.05). Similarly, sTNFαR I and II in HIV+ participants were associated with an increase in prevalence of coronary stenosis ≥70% (P<0.05). Higher levels of interleukin‐6, sTNFαR I, and sTNFαR II were also associated with greater coronary artery calcification score in HIV+ men (P<0.01).
Conclusions
Higher inflammatory marker levels are associated with greater prevalence of coronary stenosis in HIV+ men. Our findings underscore the need for further study to elucidate the relationships of inflammatory pathways with coronary artery disease in HIV+ individuals.
Keywords: atherosclerosis, cardiac biomarkers, cardiac computed tomography, coronary artery calcium, coronary artery disease, coronary computed tomography scan, epidemiology, HIV, HIV infection, inflammation
Subject Categories: Epidemiology, Inflammation, Computerized Tomography (CT), Biomarkers, Imaging
Introduction
HIV infection continues to be a major public health problem, affecting 34 million people worldwide.1 Successful control of viremia with antiretroviral therapy (ART) has changed the portrait of the infection from a fatal disease to a chronic medical condition. Therefore, other diseases such as cardiovascular diseases (CVD) increasingly become a major health concern for these patients.2, 3, 4, 5, 6, 7, 8 Studies have found higher rates of cardiovascular abnormalities, including coronary artery disease (CAD), in HIV patients.5, 9, 10, 11, 12, 13, 14, 15 It is estimated that HIV‐infected (HIV+) individuals are at 1.5‐ to 2‐fold higher risk of CAD compared to individuals without HIV (HIV−).2, 16
Despite the increasing evidence for the higher risk of CAD in HIV+ individuals, the mechanisms involved in this increased risk are not well understood. The initial research focused on higher prevalence of traditional risk factors in HIV patients17, 18, 19 and on ART.20, 21, 22, 23, 24 However, more recent studies suggest that HIV‐related inflammation plays a central role in this increased risk.25, 26, 27 While the initiation of ART reduces inflammation, even virologically suppressed HIV+ patients have higher levels of inflammation than individuals without HIV,28, 29 which may play a role in increased risk of CVD. This is particularly important in view of the complex mixture of immune activation and immune depletion in HIV infection and our increasing knowledge of the role of inflammation in CVD in the general population.30, 31, 32, 33
One of the challenges in studying the mechanisms involved in increased risk of CAD among HIV‐infected patients is the large number of subjects required, even in the high‐risk populations, with CAD clinical events as the outcome(s). Therefore, detecting subclinical CAD has become a new focus of research in this field, since subclinical atherosclerosis is a common surrogate related to the risk of clinical events.34 Coronary artery calcification (CAC) detected by noncontrast cardiac computed tomography (CT) is generally used as a proxy measure of subclinical CAD. Although it has been shown that HIV+ individuals are at increased risk of subclinical atherosclerosis in the carotid artery,9, 12, 35, 36 studies using CAC as a measure of subclinical CAD have been inconclusive.37, 38, 39 Contrast‐enhanced coronary CT angiography (CTA) provides a more detailed evaluation of subclinical CAD, by imaging noncalcified plaques; and with advances in technology, it can be done with a low radiation exposure.40 CTA provides a more comprehensive assessment of coronary atherosclerosis, including plaque characterization and degree of stenosis, thus identifying lesions that are known to be associated with the risk of clinical CAD events.41, 42 In a systematic review of 32 studies, the odds of cardiac death and myocardial infarction among those with coronary stenosis (≥50%) is about 15 times of those with nonobstructive (<50%) stenosis.43
We previously reported the relationships of biomarkers of monocyte activation44 with subclinical CAD, using noncontrast CT scans and CTA studies, in HIV+ and HIV− participants of the Multicenter AIDS Cohort Study (MACS). The objective of the current study is to determine the association of a suite of biomarkers of systemic inflammation and coagulation with subclinical CAD in HIV+ and HIV− participants in MACS. The study tests the hypothesis that biomarkers of inflammation and coagulation are higher in HIV+ patients and are correlated with subclinical CAD detected on CT scan.
Methods
Population
The study population consisted of HIV+ and HIV− men enrolled in the MACS who underwent noncontrast CT scans, as part of a MACS Cardiovascular Ancillary Study. Detailed description of MACS and the subset of the participants who had cardiac CT scans has been reported previously.45, 46 Briefly, MACS is an ongoing cohort study of the natural and treated histories of HIV‐1 infection in homosexual and bisexual men, conducted in 4 US communities in Baltimore, Chicago, Pittsburgh, and Los Angeles. The study had an initial enrollment in 1984–1985, with additional enrollments in 1987–1991 and 2001–2003. The cohort has recruited both HIV+ and HIV− men who attend semiannual research visits during which they undergo standardized interviews and physical examinations, and blood and urine samples are collected.
Inclusion criteria for this MACS Cardiovascular Ancillary Study were the following: being an active MACS participant (with oversampling of HIV‐infected men), age 40 to 70 years, weight <300 lb, and no prior history of cardiac surgery or percutaneous coronary intervention, as these procedures would interfere with the measurement of coronary atherosclerosis. Exclusion criteria for CTA measurements included the following: atrial fibrillation, chronic kidney disease (estimated glomerular filtration rate <60 mL/min per m2 within 30 days of the CT scan) or a history of intravenous contrast allergy. The study was approved by the Institutional Review Boards of all participating sites, and all participants signed informed consent for the MACS Cardiovascular Ancillary Study. All eligible participants who were enrolled completed noncontrast cardiac CT scanning between January 2010 and June 2013. A total of 1005 (620 HIV+ and 385 HIV−) men underwent noncontrast coronary CT scans. From these participants, 764 (453 HIV+ and 311 HIV−) participants underwent CTA.
Outcomes
The main outcomes of this study were measures of subclinical CAD as measured by cardiac CT scans. These include presence and also the extent of CAC measured on noncontrast CT scan and characteristics of coronary plaques and the presence and severity of coronary artery stenosis measured by CTA. Specific outcomes of interest were as follows: moderate to severe coronary artery stenosis (≥50%), severe coronary artery stenosis (≥70%), presence of CAC, Agatston CAC score, presence of any plaque on CTA, calcified plaque score, noncalcified plaque score, mixed plaque score, and total plaque score on CTA.
CT Scan Studies
Details of the CT scan studies and procedures have been described previously.46, 47 Briefly, participants received β‐blocker or calcium channel blocker medications as needed in anticipation of the CT scan study, and sublingual nitroglycerin was administered prior to intravenous contrast injection unless contraindicated. CT scanning equipment included 64‐slice multidetector CT at 3 centers and a 320‐row multidetector CT scanner in 1 center. Prospective ECG triggering protocols, which minimized radiation exposure, were used, except when the heart rate was too fast or irregular. The median (interquartile range) radiation dose for the CTA procedure was 1.9 (1.7–2.7) mSv. CT images were transferred to the core CT reading center (Biomedical Research Institute at Harbor‐UCLA, Los Angeles, CA) and were analyzed and interpreted by trained, experienced readers who were blinded to participant characteristics and HIV serological status. Segments were analyzed using a modified 15‐segment model of the American Heart Association.48 Using axial images, multiplanar reconstructions, and maximum intensity projections, the presence, size, and composition of coronary plaque and the degree of luminal narrowing (ie, stenosis) in all assessable coronary segments were assessed. Plaque sizes were graded as 0=no plaque, 1=mild, 2=moderate, or 3=severe. Segment stenosis was defined as 0=no plaque, 1=1% to 29% (minimal) stenosis, 2=30% to 49% (mild) stenosis, 3=50% to 69% (moderate) stenosis, or 4 for ≥70% (severe) stenosis. Moderate to severe stenosis (≥50%) included lesions with grade 3 or 4. The total plaque score, a reproducible measure of overall plaque burden,49 was calculated by summing the plaque size score for all assessable coronary segments that demonstrated any plaque (calcified, noncalcified, or mixed) up to a maximum score of 45. Each coronary segment was classified as normal or containing noncalcified plaque, mixed plaque (<50% of plaque area occupied by calcium), or calcified plaque. Calcified atherosclerotic plaque was defined as any structure with attenuation >130 HU visualized separately from the intravascular lumen, identified in at least 2 independent planes. Noncalcified atherosclerotic plaque was defined as any discernible structure that could be clearly assignable to the vessel wall, with a CT density less than the contrast‐enhanced coronary lumen but greater than the surrounding connective tissue, and identified in at least 2 independent planes. The noncalcified plaque score, mixed plaque score, and calcified plaque score were calculated by summing the plaque scores in each noncalcified, mixed, or calcified plaque segment separately.
Exposures and Covariables
The main independent variables of interest in this study were inflammatory and coagulation biomarkers, which were measured on the day of the CT scan. The biomarkers included in this study, and the domains they represent, were as follows: interleukin‐6 (IL‐6; systemic inflammation), intracellular adhesion molecule 1 (ICAM‐1; endothelial cell activation), fibrinogen, and high sensitivity C‐reactive protein (hs‐CRP; both acute phase response liver proteins), D‐dimer (activation of the coagulation and fibrinolytic systems), and soluble tumor necrosis factor‐α (TNF‐α) receptor I (sTNFαR I), and soluble TNF‐α receptor II (sTNFαR II; TNF‐mediated immune cell activation). IL‐6 (serum) was measured using chemiluminescent ELISA (R&D Systems, Minneapolis, MN). ICAM‐1 (serum) was also measured using R&D ELISA. Fibrinogen (EDTA plasma) and hs‐CRP (serum) were measured using the BNII Nephelometer Siemens (Siemens Healthcare Diagnostics, Deerfield, IL) and D‐dimer (citrated plasma) was measured using a Stago (Parsippany, NJ) STA‐R analyzer. sTNFαR I and sTNFαR II (EDTA plasma) were measured via multiplexing using a Milliplex soluble cytokine receptor panel (Millipore, Billerica, MA). The interassay coefficients of variation ranged from 7% to 12% for IL‐6, 3.3% to 7% for ICAM‐1, 1.0% to 6.7% for fibrinogen, 4% to 17% for D‐dimer, 4.5% to 5.2% for hsCRP, 4.6% to 10.8% for sTNFαR I, and 4.2% to 7.9% for sTNFαR II.
Other variables measured and included in the analysis included demographic data, traditional CAD risk factors, and clinical parameters pertaining to HIV infection. MACS participants are seen every 6 months as part of their routine visit, and the data collected in the prior MACS study visit closest to the CT scan were used for this study. Demographic and cohort‐related variables included in the analysis were age, self‐reported race/ethnicity, study center, and study cohort (pre‐ versus post‐2001). The traditional CAD risk factors included systolic blood pressure, antihypertensive medication use, diabetes medication use, fasting glucose, total cholesterol, HDL cholesterol, use of lipid‐lowering medications, body mass index, smoking, and pack‐years of smoking. Serum glucose, total and high‐density lipoprotein cholesterol (HDL), and triglycerides were measured from fasting blood samples. Low‐density lipoprotein cholesterol was calculated using the Friedewald equation or measured directly in persons with triglycerides >400 mg/dL or with nonfasting samples. Serum creatinine was measured at each MACS study visit and within 30 days of CT scanning for persons who underwent contrast injection. Estimated glomerular filtration rate was calculated using the Modification of Diet in Renal Disease equation. Hypertension was defined as systolic blood pressure >140 mm Hg or diastolic blood pressure >90 mm Hg or self‐reported use of antihypertensive medication. Diabetes mellitus was defined as fasting serum glucose ≥126 mg/dL or use of medications to treat diabetes. The clinical parameters of HIV infection included HIV duration, current viral load, current and nadir CD4+ T‐cell counts, and history of an AIDS‐defining malignancy or opportunistic infection, and duration of highly active ART use.
Statistical Analysis
The distributions of continuous variables were summarized using mean (SD) for continuous variables with normal distribution, median (interquartile range) for continuous variables with non‐Gaussian distribution, and percentage for categorical variables. The comparisons between HIV‐infected and ‐uninfected participants were done using Student t test, Wilcoxon rank‐sum test, and χ2 test. Poisson regression models with robust variance50 (for binary outcomes) and linear regression models (for continuous outcomes) were used for analyzing the relationship of the inflammatory biomarkers with the outcomes of interest detailed above (measures of subclinical atherosclerosis and plaque characterizations). The variables that did not have normal distribution were log transformed or categorized. The analyses included 3 models: (1) Model 1: minimally adjusted models included age, race/ethnicity (white, African American, and Hispanic/Others), study center, and study cohort (pre‐ versus post‐2001); (2) Model 2: minimally adjusted models plus traditional CAD risk factors (systolic blood pressure, antihypertensive medication use, diabetes medication use, fasting glucose, total cholesterol, HDL cholesterol, use of lipid‐lowering medications, body mass index, smoking [current, former, never], and pack‐years of smoking); and (3) Model 3: (in HIV‐infected participants): Model 2 plus clinical parameters of HIV infection (HIV duration, current viral load, current and nadir CD4+ T‐cell counts, and history of an AIDS‐defining malignancy or opportunistic infection, and duration of ART use). In order to facilitate the comparison among different inflammatory biomarkers, they were standardized using their SD. Therefore, the prevalence ratios in Poisson models and the coefficients in the linear regression models are per SD increase in the level of inflammatory biomarkers. Also, in order to allow for comparison among inflammatory biomarkers, the regression analyses were limited to those participants in whom none of the primary inflammatory biomarkers were missing. The prevalence of missing values for CAD risk factors and clinical parameters of HIV infection were negligible (less than 3%) in these participants. Sensitivity analyses were also done by imputing the missing values for biomarkers and risk factors using multiple imputations. In addition to the models above, we test for effect modification in Models 1 and 2 with all the men (HIV+ and HIV−) and included HIV serostatus and the interaction terms between HIV serostatus and inflammatory biomarkers. All statistical analyses were performed using Stata 10.1 (StataCorp Lp, College Station, TX). Statistical significance was generally considered at a P value of 0.05 or less.
Results
The study population included 923 (575 HIV‐infected (HIV+] and 348 uninfected [HIV−] men) MACS participants who underwent noncontrast CT scans, including 692 who underwent CTA, and had inflammatory biomarkers measured. As described in the Methods section, from 1005 participants who had noncontrast CT scans, 82 men were excluded in the main analysis due to missing values for at least 1 inflammatory biomarker. The distribution of risk factors among these excluded participants were similar to the 923 participants included in this study, with the exception of serum HDL values (mean: 46 versus 51, respectively, P=0.02). Otherwise, Table 1 summarizes the baseline characteristics of the study population. HIV+ men were on average 2.7 years younger than uninfected individuals and were less likely to be white, had a 4 pack‐year higher average smoking history, lower body mass index, lower serum low‐density lipoprotein cholesterol and HDL cholesterol levels, and higher triglyceride levels. Most of the HIV+ participants (96%) had been on ART at some point and the majority of them (83%) were virologically suppressed with average current CD4+ T‐cell count of 703 cells/mm3 (Table 1).
Table 1.
Characteristics of the Multicenter AIDS Cohort Study (MACS) Participants Undergoing Cardiac CT Scana
| HIV‐Infected (N=575) | HIV‐Uninfected (N=348) | P Value | |
|---|---|---|---|
| Age, y | 52.7 (6.6) | 55.4 (7.2) | <0.001 |
| Race | |||
| White (%) | 52.9 | 67.2 | <0.001 |
| African American (%) | 34.1 | 24.4 | |
| Hispanic/other (%) | 13.0 | 8.3 | |
| Hypertension (%) | 49.0 | 43.7 | 0.13 |
| Systolic blood pressure, mm Hg | 126.6 (15.4) | 127.9 (14.6) | 0.22 |
| Hypertension medications (%) | 35.0 | 31.7 | 0.30 |
| Diabetes (%) | 14.8 | 10.5 | 0.08 |
| Diabetes medications (%) | 8.7 | 8.1 | 0.77 |
| Tobacco use | |||
| Never smoker (%) | 24.7 | 25.5 | 0.002 |
| Current smoker (%) | 31.5 | 21.2 | |
| Former smoker (%) | 43.8 | 53.3 | |
| Smoking pack‐yearsb | 6.5 (0–24.0) | 0.7 (0–20.1) | 0.003b |
| Body mass index, kg/m2 | 26.0 (4.5) | 27.4 (5.0) | <0.001 |
| Total cholesterol, mg/dL | 186.6 (43.1) | 192.5 (35.9) | 0.03 |
| LDL cholesterol, mg/dL | 105.8 (36.1) | 114.7 (31.7) | <0.001 |
| HDL cholesterol, mg/dL | 48.6 (16.2) | 53.7 (15.3) | <0.001 |
| Triglycerides, mg/dL | 175.5 (202.0) | 122.2 (66.2) | <0.001 |
| Lipid‐lowering medications (%) | 33.9 | 31.2 | 0.39 |
| Serum creatinine, mg/dL | 1.1 (0.5) | 1.0 (0.2) | 0.01 |
| AHA/ACC 2013 risk score (%) | 8.2 (4.5–12.4) | 8.5 (4.5–12.5) | 0.44b |
| AHA/ACC 2013 risk category | 0.51 | ||
| <5% risk (%) | 30.4 | 26.3 | |
| 5% to 7.4% risk (%) | 15.9 | 18.6 | |
| ≥7.5% (%) | 53.7 | 55.1 | |
| HIV clinical factors | |||
| Current HIV RNA undetectable (<50 copies/mL) (%) | 82.6 | ||
| Current HIV RNA among detectable patients, copies/mL | 842 (139–23 300)b | ||
| Current CD4+ T‐cell count, cells/mm3 | 698 (499–936)b | ||
| CD4+ T‐cell count nadir, cells/mm3 | 367 (242–557)b | ||
| HAART experienced (%) | 96.0 | ||
| Protease inhibitor use (%) | 44.8 | ||
| NNRTI use (%) | 46.8 | ||
| HAART duration, y | 9.5 (6.3–12.5)b | ||
| Protease inhibitor duration, y | 4.9 (0.3–9.6)b | ||
| NNRTI duration, y | 4.0 (0.7–8.0)b | ||
ACC indicates American College of Cardiology; AHA, American Heart Association; CT, computed tomography; HAART, highly active antiretroviral treatment; HDL, high‐density lipoprotein cholesterol; LDL, low‐density lipoprotein cholesterol; NNRTI, non‐nucleoside reverse transcriptase inhibitor.
Mean (SD) is presented for continuous variables with normal distribution and percentage for categorical variables.
Median (interquartile range) presented because the distribution was not normal. Wilcoxon Rank‐Sum test was used for comparison between groups.
HIV+ men had significantly higher blood levels of IL‐6, ICAM‐1, hs‐CRP, sTNFαR I, and sTNFαR II compared to HIV− men (all P<0.01), while there was no statistically significant difference in the serum levels of the coagulation marker D‐dimer between the 2 groups (Table 2). Limiting HIV+ men to those with undetectable viral load did not significantly change these results (Table 3).
Table 2.
Distribution of Serum Inflammatory Markers Among the Multicenter AIDS Cohort Study (MACS) Participants Who Had Cardiac CT Scana
| HIV Infected (N=575) | HIV Uninfected (N=348) | SD | P Value | |
|---|---|---|---|---|
| Interleukin‐6, pg/mL | 1.5 (1.0–2.5) | 1.3 (0.9–2.1) | 6.1 | 0.001b |
| ICAM‐1, ng/mL | 257.8 (214.7–315.0) | 228.6 (193.1–273.5) | 116.2 | 0.007b |
| Fibrinogen, mg/dL | 326 (278–377) | 332 (292–376) | 92.7 | 0.63 |
| D‐dimer, μg/mL | 0.17 (0.11–0.29) | 0.20 (0.13–0.3) | 0.8 | 0.43 |
| CRP, mg/dL | 1.24 (0.64–2.76) | 0.95 (0.52–1.92) | 4.2 | <0.001b |
| sTNFαR I, pg/mL | 1178 (973–1495) | 1160 (953–1378) | 1154 | 0.002b |
| sTNFαR II, pg/mL | 6622 (5390–8285) | 5844 (4961–6902) | 3519 | <0.001b |
CPR indicates C‐reactive protein; ICAM‐1, intracellular adhesion molecule 1; sTNFαR, soluble‐tumor necrosis.
Inflammatory markers are presented as median (interquartile range). P values are calculated using t test after log transformation in all the markers except fibrinogen. SDs are provided to facilitate interpretation of standardized variables.
Statistically significant findings.
Table 3.
Distribution of Serum Inflammatory Markers Among Virologically Suppressed HIV+ and HIV− Men in the Multicenter AIDS Cohort Study (MACS) Participants Who Had Cardiac CT Scana
| Virologically Suppressedb HIV‐Infected (N=475) | HIV Uninfected (N=348) | P Value | |
|---|---|---|---|
| Interleukin 6, pg/mL | 1.5 (1.0–2.3) | 1.3 (0.9–2.1) | 0.04c |
| ICAM‐1, ng/mL | 252.4 (209.0–304.5) | 228.6 (193.1–273.5) | 0.06 |
| Fibrinogen, mg/dL | 322 (273–373) | 332 (292–376) | 0.40 |
| D‐dimer, μg/mL | 0.17 (0.11–0.27) | 0.20 (0.13–0.3) | 0.34 |
| CRP, mg/dL | 1.23 (0.66–2.76) | 0.95 (0.52–1.92) | <0.001c |
| sTNFαR I, pg/mL | 1193 (988–1501) | 1160 (953–1378) | 0.002c |
| sTNFαR II, pg/mL | 6457 (5326–8054) | 5844 (4961–6902) | <0.001c |
CT indicates computed tomography; CRP, C‐reactive protein; ICAM‐1, intracellular adhesion molecule‐1; sTNFαR I, soluble tumor necrosis factor α receptor I.
Inflammatory markers are presented as median (interquartile range). P values are calculated using t test after log transformation in all the markers except fibrinogen.
Defined as undetectable viral load.
Statistically significant findings.
Detailed analyses of the relationships between selected CAD risk factors and HIV clinical factors with the biomarkers of inflammation and coagulation is beyond the scope of this article. However, a few of the associations are worth mentioning here. Among CAD risk factors, increased age was a consistent predictor of all the studied biomarkers, except hs‐CRP, both in HIV+ and HIV− men. Black race was associated with higher levels of IL‐6 and fibrinogen in both HIV+ and HIV− men, higher levels of D‐dimer in HIV− men, and lower levels of ICAM‐1 in HIV+ men. Race was significantly related to sTNFαR I and II. Increased body mass index was also associated with higher IL‐6, hs‐CRP, D‐dimer, and fibrinogen levels in HIV− men and lower levels of ICAM‐1 in HIV+ men. Higher body mass index also had positive correlations with levels of sTNFαR I and II in HIV− men, while these correlations were negative in HIV+ patients. Serum cholesterol levels, use of hypertension medications, and smoking pack‐years were other CAD risk factors that were correlated with some of the biomarkers, but in a less consistent manner. Among HIV clinical factors, current CD4+ count is associated with higher levels of D‐dimer, hs‐CRP, and sTNFαR II, and diagnosis of AIDS was related to greater levels of sTNFαR I and II (data not presented).
As previously reported,46 HIV+ men had a higher prevalence of noncalcified plaques (62.8% versus 53.7%, respectively, P=0.02) on CTA, and a greater extent of noncalcified plaque (Wilcoxon Rank‐Sum P‐value for noncalcified plaque score <0.01). There were no statistically significant differences between the 2 groups in the CAC score or in the prevalence of CAC, mixed or calcified plaques, or coronary artery stenosis (Table 4).
Table 4.
Coronary Artery CT Scan Findings of the Multicenter AIDS Cohort Study (MACS) Participants Who Had Cardiac CT Scan
| HIV Infected* | HIV Uninfected | P Value** | |
|---|---|---|---|
| Calcium score | N=575 | N=347 | |
| CAC present: Agatston Score >0 (%) | 52.5 | 52.7 | 0.95 |
| CAC score among those with calcium present | 70 (21–184) | 77 (23–248) | 0.69† |
| CAC score >300 (%) | 7.8 | 11.2 | 0.08 |
| Coronary artery stenosis | N=411 | N=281 | |
| Prevalence of any coronary stenosis ≥50% (%) | 15.1 | 14.6 | 0.86 |
| Prevalence of any coronary stenosis ≥70% (%) | 6.6 | 7.1 | 0.78 |
| Total segment stenosis score | 2 (1–6) | 2 (1–5) | 0.65‡ |
| Coronary plaques | N=411 | N=281 | |
| Prevalence of any coronary plaque (%) | 75.4 | 71.2 | 0.22 |
| Prevalence of noncalcified plaque (%) | 62.8 | 53.7 | 0.02§ |
| Prevalence of mixed plaque (%) | 33.4 | 33.0 | 0.91 |
| Prevalence of calcified plaque (%) | 33.4 | 40.3 | 0.06 |
| Total Plaque Score | 2 (1–5) | 2 (1–5) | 0.63‡ |
| Noncalcified Plaque Score | 1 (0–3) | 1 (0–2) | 0.004‡, § |
| Mixed Plaque Score | 0 (0–1) | 0 (0–1) | 0.66‡ |
| Calcified Plaque Score | 0 (0–1) | 0 (0–2) | 0.03‡, § |
CAC indicates coronary artery calcification; CT, computed tomography.
*Data are presented as median (interquartile range) for continuous variables and percentage for categorical variables. P values were calculated by χ2 test for categorical variables, Student t test with log transformation (†), or Wilcoxon Rank‐Sum test (‡). Note that Wilcoxon Rank‐Sum test is a nonparametric test that tests rank‐sums, rather than medians. Therefore, medians may be similar while there are significant differences in rank‐sums. However, medians are provided in the table as a commonly used estimate for variables without normal distribution.
§Statistically significant findings.
Table 5 summarizes the associations of inflammatory biomarkers with coronary artery stenosis on CTA studies. In HIV+ men, higher levels of IL‐6 and ICAM‐1 were significantly associated with greater prevalence of moderate to severe (≥50%) coronary artery stenosis on CTA (in separate models), and these associations remained significant even after adjustment for traditional cardiovascular risk factors and HIV clinical factors. Every SD increase in log‐IL‐6 and log ICAM‐1 was associated with 30% and 60%, respectively, increase in prevalence of at least moderate coronary stenosis (≥50%) among HIV+ men (P<0.05 for all), adjusting for other risk factors. Similarly, higher levels of sTNFαR I and sTNFαR II were associated with higher prevalence of severe (≥70%) coronary artery stenosis. The prevalence ratios for severe coronary artery stenosis for every SD increase in log sTNFαR I and log sTNFαR II were 2.3 (95% CI: 1.3, 4.2; P=0.006) and 1.7 (95% CI: 1.1, 2.7; P=0.02), respectively, after adjustment for traditional risk factors and HIV clinical factors. D‐dimer levels were also associated with coronary artery stenosis greater than 50% in HIV− men (adjusted prevalence ratio for each SD increase in log D‐dimer: 1.4, P=0.03). The relationship between levels of inflammatory biomarkers and coronary stenosis follows a relative dose–response pattern. Figure illustrates the prevalence of moderate to severe (≥50%) coronary artery stenosis in different quartiles of inflammatory biomarkers in HIV+ individuals and all participants.
Table 5.
Associations of Inflammatory Markers With Coronary Artery Stenosis on Coronary CT Angiographya
| HIV‐Infected (N=411)b | HIV‐Uninfected (N=281)b | ||||
|---|---|---|---|---|---|
| Model 1 | Model 2 | Model 3 | Model 1 | Model 2 | |
| Coronary stenosis ≥50% | |||||
| Log‐IL‐6 | 1.3 (1.1–1.6), 0.003c | 1.3 (1.04–1.6), 0.02c | 1.3 (1.1–1.5), 0.01c | 1.1 (0.8–1.5), 0.77 | 0.8 (0.5–1.3), 0.47 |
| Log ICAM‐1 | 1.6 (1.2–2.2), 0.001c | 1.4 (1.03–1.9), 0.03c | 1.5 (1.03–2.1), 0.035c | 1.5 (0.99–2.4), 0.06 | 1.2 (0.8–1.8), 0.31 |
| Fibrinogen | 1.1 (0.9–1.3), 0.26 | 1.2 (0.9–1.6), 0.15 | 1.3 (0.95–1.7), 0.10 | 0.97 (0.6–1.6), 0.91 | 0.93 (0.7–1.3), 0.70 |
| Log D‐dimer | 1.2 (0.9–1.5), 0.18 | 1.1 (0.9–1.5), 0.36 | 1.2 (0.9–1.6), 0.20 | 1.2 (0.9–1.8), 0.25 | 1.4 (1.03–2.0), 0.03c |
| Log‐CRP | 1.2 (1.0–1.6), 0.07 | 1.2 (0.9–1.5), 0.15 | 1.3 (1.0–1.6), 0.06 | 1.0 (0.7–1.4), 0.99 | 0.8 (0.6–1.1), 0.23 |
| Log sTNFαR I | 1.2 (0.9–1.6), 0.23 | 1.1 (0.8–1.4), 0.55 | 1.1 (0.8–1.5), 0.58 | 0.8 (0.6–1.1), 0.20 | 0.6 (0.4–0.8), 0.004c |
| Log sTNFαR II | 1.3 (1.1–1.6), 0.007c | 1.2 (0.9–1.4), 0.17 | 1.2 (0.97–1.6), 0.09 | 0.9 (0.6–1.4), 0.58 | 0.7 (0.4–1.2), 0.22 |
| Coronary stenosis ≥70% | |||||
| Log‐IL‐6 | 1.3 (1.0–1.8), 0.05c | 1.1 (0.8–1.5), 0.48 | 1.0 (0.7–1.5), 0.83 | 0.98 (0.5–1.8), 0.95 | 0.7 (0.3–1.8), 0.48 |
| Log ICAM‐1 | 1.4 (0.97–2.0), 0.07 | 1.1 (0.8–1.5), 0.56 | 1.0 (0.7–1.5), 0.83 | 1.9 (0.9–3.7), 0.07 | 1.5 (0.8–2.8), 0.22 |
| Fibrinogen | 1.1 (0.8–1.4), 0.64 | 1.0 (0.6–1.7), 0.97 | 1.0 (0.6–1.8), 0.90 | 1.2 (0.6–2.5), 0.66 | 1.2 (0.8–2.0), 0.43 |
| Log D‐dimer | 1.1 (0.7–1.6), 0.69 | 1.1 (0.7–1.7), 0.79 | 1.1 (0.7–1.7), 0.71 | 1.2 (0.7–2.0), 0.54 | 1.4 (0.9–2.1), 0.14 |
| Log‐CRP | 1.2 (0.8–1.8), 0.27 | 1.2 (0.8–1.9), 0.39 | 1.3 (0.8–2.0), 0.25 | 1.3 (0.8–2.1), 0.30 | 1.3 (0.8–2.1), 0.22 |
| Log sTNFαR I | 1.9 (1.2–3.0), 0.004c | 1.9 (1.2–3.0), 0.004c | 2.3 (1.3–4.2), 0.006c | 0.9 (0.6–1.4), 0.67 | 0.7 (0.5–1.04), 0.08 |
| Log sTNFαR II | 1.6 (1.2–2.1), 0.001c | 1.4 (1.0–2.0), 0.06 | 1.7 (1.1–2.7), 0.02c | 1.2 (0.6–2.3), 0.65 | 1.1 (0.5–2.3), 0.86 |
Model 1: minimally adjusted models (including age, race/ethnicity, study center, and study cohort [pre‐ vs post‐2001]). Model 2: Model 1 plus traditional cardiovascular risk factors (systolic blood pressure, antihypertensive medication use, diabetes medication use, fasting glucose, total cholesterol, HDL cholesterol, use of lipid‐lowering medications, body mass index, smoking, and pack‐years of smoking). Model 3: Model 2 plus parameters of HIV infection (HIV duration, current viral load, current and nadir CD4+ T‐cell counts, and history of an AIDS‐defining malignancy or opportunistic infection, and duration of ART use). ART indicates antiretroviral therapy; CAD, coronary artery disease; CRP, C‐reactive protein; CT, computed tomography; HDL, high‐density lipoprotein cholesterol; ICAM‐1, intracellular adhesion molecule‐1; IL‐6, interleukin‐6; sTNFαR I, soluble tumor necrosis factor α receptor I.
Results presented as prevalence ratio (95% CI), P value.
N for these analyses was 692 participants who had CT scan and had no missing values for any of the 7 inflammatory markers of interest. The number of participants dropped in Models 2 and 3 due to missing values in CAD risk factors and clinical parameters of HIV infection was negligible (less than 3%).
Statistically significant findings.
Figure 1.
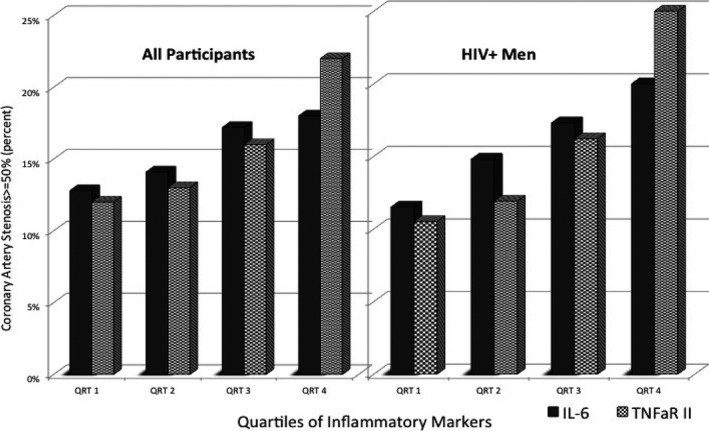
Prevalence of coronary artery stenosis (≥50%) on CT scan with quartiles of inflammatory markers in HIV‐infected men and all participants in the MACS study. CT indicates computed tomography; IL‐6, interleukin‐6; MACS, Multicenter AIDS Cohort Study; TNFαR II, tumor necrosis factor α receptor II.
Higher serum levels of IL‐6, sTNFαR I, and sTNFαR II were also associated with a greater CAC score in HIV+ men (each SD increase in the log of levels of each of these factors associated with 0.3, 0.2, and 0.2 units, respectively, increase in log‐CAC score, all P≤0.01), and these associations remained significant after adjustment for traditional risk factors and HIV clinical factors. To provide a frame of reference, 0.2 and 0.3 units increase in log‐CAC score correspond to ≈22% and 35% increase in CAC score, respectively. These 3 biomarkers were also associated with presence of CAC in minimally adjusted models, although serum IL‐6 was the only biomarker that continued to be marginally significant (PR: 1.1, P=0.06) after adjustment for risk factors. The only inflammatory biomarker associated with CAC score in HIV− men was IL‐6, which did not remain significant in adjusted models (Table 6).
Table 6.
Associations of Inflammatory Markers With Coronary Artery Calcification on Cardiac CT Scana
| HIV Seropositive (N=575)b | HIV Seronegative (N=347)b | ||||
|---|---|---|---|---|---|
| Model 1 | Model 2 | Model 3 | Model 1 | Model 2 | |
| CAC score (Log)c | |||||
| Log‐IL‐6 | 0.3 (0.1–0.5), <0.01d | 0.2 (0.03–0.4), 0.02d | 0.2 (0.03–0.4), 0.03d | 0.3 (0.02–0.6), 0.04d | 0.1 (−0.2 to 0.4), 0.50 |
| Log ICAM‐1 | 0.1 (0.0–0.3), 0.06 | 0.1 (−0.05 to 0.3), 0.19 | 0.1 (−0.1 to 0.2), 0.33 | 0.1 (−0.3 to 0.5), 0.56 | 0.1 (−0.3 to 0.4), 0.68 |
| Fibrinogen | 0.1 (−0.1 to 0.2), 0.53 | 0.1 (−0.04 to 0.3), 0.14 | 0.1 (−0.0 to 0.4), 0.08 | 0.2 (−0.2 to 0.5), 0.45 | 0.03 (−0.4 to 0.4), 0.89 |
| Log D‐dimer | 0.1 (−0.1 to 0.3), 0.27 | 0.1 (−0.1 to 0.3), 0.28 | 0.1 (−0.1 to 0.3), 0.33 | 0.1 (−0.1 to 0.3), 0.33 | 0.1 (−0.1 to 0.3), 0.38 |
| Log‐CRP | 1.30.1 (−0.1 to 0.3), 0.17 | 0.1 (−0.1 to 0.2), 0.55 | 0.1 (−0.1 to 0.3), 0.37 | 0.0 (−0.2 to 0.3), 0.80 | −0.2 (−0.5 to 0.1), 0.28 |
| Log sTNFαR I | 0.2 (0.1–0.4), <0.01d | 0.2 (0.0–0.4), 0.05d | 0.2 (0.0–0.4), 0.047d | 0.0 (−0.3 to 0.2), 0.86 | −0.2 (−0.5 to 0.1), 0.12 |
| Log sTNFαR II | 0.2 (0.04–0.4), 0.01d | 0.2 (0.0–0.4), 0.05d | 0.2 (0.0–0.4), 0.046d | 0.1 (−0.2 to 0.5), 0.46 | 0.0 (−0.3 to 0.4), 0.82 |
| Presence of CAC | |||||
| Log‐IL‐6 | 1.1 (1.03–1.2), 0.006d | 1.1 (1.0–1.15), 0.06d | 1.1 (1.0–1.2), 0.06d | 1.1 (0.98–1.2), 012 | 1.0 (0.9–1.2), 0.63 |
| Log ICAM‐1 | 1.1 (0.97–1.1), 0.21 | 1.1 (0.96–1.2), 0.25 | 1.0 (0.95–1.1), 0.37 | 1.1 (0.9–1.3), 0.45 | 1.0 (0.9–1.2), 0.54 |
| Fibrinogen | 1.0 (0.96–1.1), 0.65 | 1.0 (0.97–1.1), 0.39 | 1.0 (0.9–1.1), 0.14 | 1.03 (0.9–1.2), 0.88 | 1.0 (0.86–1.1), 0.86 |
| Log D‐dimer | 1.0 (0.95–1.1), 0.46 | 1.0 (0.9–1.1), 0.71 | 1.0 (0.9–1.1), 0.99 | 1.0 (0.9–1.1), 0.53 | 1.0 (0.9–1.1), 0.50 |
| Log‐CRP | 1.0 (0.97–1.1), 0.27 | 1.0 (0.93–1.1), 0.86 | 1.0 (0.9–1.1), 0.72 | 1.0 (0.9–1.1), 0.61 | 0.99 (0.9–1.1), 0.82 |
| Log sTNFαR I | 1.1 (1.02–1.1), 0.01d | 1.0 (0.96–1.1), 0.40 | 1.0 (0.96–1.1), 0.39 | 0.99 (0.9–1.1), 0.89 | 0.98 (0.9–1.1), 0.67 |
| Log sTNFαR II | 1.1 (1.0–1.1), 0.04d | 1.0 (0.97–1.1), 0.27 | 1.0 (0.96–1.1), 0.32 | 1.0 (0.9–1.2), 0.65 | 1.0 (0.9–1.2), 0.81 |
Model 1: minimally adjusted models (including age, race/ethnicity, study center, and study cohort [pre‐ vs post‐2001]). Model 2: Model 1 plus traditional cardiovascular risk factors (systolic blood pressure, antihypertensive medication use, diabetes medication use, fasting glucose, total cholesterol, HDL cholesterol, use of lipid‐lowering medications, body mass index, smoking, and pack‐years of smoking). Model 3: Model 2 plus parameters of HIV infection (HIV duration, current viral load, current and nadir CD4+ T‐cell counts, and history of an AIDS‐defining malignancy or opportunistic infection, and duration of ART use). ART indicates antiretroviral therapy; CAC, coronary artery calcification; CAD, coronary artery disease; CRP, C‐reactive protein; CT, computed tomography; HDL, high‐density lipoprotein cholesterol; ICAM‐1, intracellular adhesion molecule‐1; IL‐6, interleukin‐6; sTNFαR I, soluble tumor necrosis factor α receptor I.
Results presented as (prevalence ratio [95% CI], P value) for presence of CAC score and (regression coefficient [95% CI], P value) for log‐CAC score. These values correspond to 1 SD increase in the value of biomarkers.
N for these analyses was 922 participants who had CT scan and had no missing values for any of the 7 inflammatory markers of interest. The number of participants dropped in Models 2 and 3 due to missing values in CAD risk factors and clinical parameters of HIV infection was negligible (less than 3%).
In order to include participants with CAC score of 0, log of CAC score was calculated after adding a 1 to the scores. Therefore, the independent variable in this model is log (CAC score+1).
Statistically significant findings.
In general, the studied inflammatory biomarkers were not significant determinants of plaque composition and extent on CTA (presence and extent of any plaque, or of noncalcified, calcified, or mixed plaque). For the purpose of brevity, all these results are not presented; but some of these results are summarized in Table 7 as examples. Fibrinogen level was the only biomarker that was significantly associated with the extent of noncalcified plaques in HIV+ men in minimally adjusted models (PR for each point increase in plaque score: 1.1 [95% CI: 1.03, 1.2], P<0.01) and after further adjustment for other covariates (PR for each point increase: 1.2 [95% CI: 1.02, 1.4], P=0.03).
Table 7.
Associations of Inflammatory Markers With Plaque Characterization on Coronary CT Angiographya
| HIV‐Infected (N=422)b | HIV‐Uninfected (N=285)b | ||||
|---|---|---|---|---|---|
| Model 1 | Model 2 | Model 3 | Model 1 | Model 2 | |
| Presence of any plaque | |||||
| Log‐IL‐6 | 1.0 (0.99–1.1), 0.17 | 1.0 (0.97–1.1), 0.38 | 1.0 (0.97–1.1), 0.39 | 1.0 (0.96–1.1), 0.36 | 1.0 (0.93–1.1), 0.87 |
| Log ICAM‐1 | 1.0 (0.97–1.1), 0.62 | 1.0 (0.96–1.1), 0.85 | 1.0 (0.96–1.1), 0.99 | 1.0 (0.9–1.2), 0.46 | 1.1 (0.9–1.2), 0.43 |
| Fibrinogen | 1.0 (0.99–1.1), 0.10 | 1.0 (0.97–1.1), 0.37 | 1.0 (0.98–1.1), 0.23 | 1.0 (0.9–1.1), 0.90 | 1.0 (0.9–1.1), 0.51 |
| Log D‐dimer | 1.0 (0.9–1.04), 0.72 | 1.0 (0.9–1.03), 0.60 | 1.0 (0.9–1.04), 0.66 | 1.0 (0.9–1.1), 0.97 | 1.0 (0.9–1.1), 0.78 |
| Log‐CRP | 1.0 (0.97–1.1), 0.54 | 1.0 (0.95–1.1), 0.89 | 1.0 (0.95–1.1), 0.82 | 1.0 (0.96–1.1), 0.37 | 1.0 (0.96–1.1), 0.34 |
| Log sTNFαR I | 1.0 (0.9–1.1), 0.86 | 1.0 (0.9–1.1), 0.64 | 1.0 (0.9–1.05), 0.58 | 0.97 (0.9–1.0), 0.37 | 0.98 (0.9–1.1), 0.64 |
| Log sTNFαR II | 1.0 (0.95–1.0), 0.98 | 0.99 (0.9–1.1), 0.81 | 1.0 (0.9–1.05), 0.62 | 0.95 (0.9–1.1), 0.34 | 0.96 (0.9–1.1), 0.49 |
| Calcified Plaque Scorec | |||||
| Log‐IL‐6 | 1.1 (0.97–1.3), 0.12 | 1.1 (0.9–1.4), 0.40 | 1.1 (0.9–1.4), 0.23 | 1.1 (0.9–1.4), 0.31 | 1.0 (0.8–1.3), 0.77 |
| Log ICAM‐1 | 1.1 (0.9–1.4), 0.30 | 1.1 (0.9–1.4), 0.29 | 1.1 (0.9–1.3), 0.33 | 0.9 (0.7–1.2), 0.45 | 0.9 (0.6–1.2), 0.34 |
| Fibrinogen | 0.97 (0.8–1.1), 0.70 | 1.0 (0.8–1.3), 0.81 | 1.1 (0.8–1.4), 0.52 | 0.97 (0.7–1.3), 0.81 | 0.9 (0.7–1.3), 0.60 |
| Log D‐dimer | 0.9 (0.7–1.1), 0.44 | 0.9 (0.7–1.2), 0.58 | 1.0 (0.8–1.3), 0.99 | 1.1 (0.8–1.4), 0.25 | 1.2 (0.96–1.4), 0.13 |
| Log‐CRP | 0.96 (0.8–1.2), 0.67 | 0.97 (0.8–1.2), 0.80 | 0.99 (0.8–1.2), 0.98 | 0.9 (0.7–1.1), 0.16 | 0.8 (0.6–1.0), 0.04d |
| Log sTNFαR I | 1.0 (0.7–1.4), 0.99 | 0.9 (0.7–1.1), 0.30 | 0.8 (0.7–1.1), 0.17 | 0.96 (0.8–1.2), 0.72 | 0.9 (0.7–1.1), 0.17 |
| Log sTNFαR II | 1.1 (0.9–1.3), 0.21 | 1.2 (0.96–1.4), 0.11 | 1.2 (1.0–1.5), 0.05d | 1.0 (0.8–1.3), 0.83 | 1.0 (0.7–1.4), 0.99 |
| Noncalcified Plaque Scorec | |||||
| Log‐IL‐6 | 1.1 (0.98–1.3), 0.10 | 1.1 (0.9–1.2), 0.19 | 1.1 (0.95–1.2), 0.24 | 1.1 (0.96–1.3), 0.18 | 0.95 (0.8–1.1), 0.52 |
| Log ICAM‐1 | 0.99 (0.9–1.1), 0.82 | 0.97 (0.9–1.1), 0.48 | 0.97 (0.9–1.1), 0.56 | 1.1 (0.9–1.3), 0.31 | 1.0 (0.9–1.3), 0.46 |
| Fibrinogen | 1.1 (1.03–1.2), <0.01d | 1.2 (1.03–1.5), 0.02d | 1.2 (1.02–1.4), 0.03d | 1.1 (0.8–1.5), 0.70 | 1.1 (0.8–1.4), 0.72 |
| Log D‐dimer | 1.0 (0.9–1.1), 0.87 | 1.0 (0.9–1.1), 0.74 | 1.0 (0.8–1.1), 0.65 | 1.1 (0.9–1.3), 0.46 | 1.1 (0.9–1.3), 0.33 |
| Log‐CRP | 1.1 (0.9–1.2), 0.28 | 1.0 (0.9–1.2), 0.76 | 1.0 (0.9–1.2), 0.59 | 1.2 (1.02–1.5), 0.03d | 1.1 (0.9–1.4), 0.32 |
| Log sTNFαR I | 1.1 (0.9–1.3), 0.17 | 1.1 (0.9–1.3), 0.29 | 1.1 (0.9–1.3), 0.17 | 1.0 (0.9–1.2), 0.65 | 1.0 (0.8–1.2), 0.97 |
| Log sTNFαR II | 1.0 (0.9–1.2), 0.79 | 1.0 (0.8–1.1), 0.66 | 1.0 (0.9–1.1), 0.94 | 1.0 (0.8–1.3), 0.90 | 0.95 (0.7–1.3), 0.73 |
| Mixed Plaque Scorec | |||||
| Log‐IL‐6 | 1.1 (0.9–1.4), 0.21 | 1.1 (0.85–1.3), 0.61 | 1.0 (0.8–1.3), 0.89 | 1.0 (0.8–1.4), 0.79 | 0.8 (0.5–1.2), 0.32 |
| Log ICAM‐1 | 1.2 (0.9–1.4), 0.20 | 1.1 (0.9–1.3), 0.31 | 1.1 (0.9–1.3), 0.45 | 1.2 (0.9–1.6), 0.26 | 1.0 (0.8–1.3), 0.83 |
| Fibrinogen | 1.0 (0.9–1.2), 0.72 | 1.1 (0.8–1.4), 0.64 | 1.1 (0.8–1.4), 0.62 | 1.4 (0.9–2.1), 0.11 | 1.2 (0.9–1.7), 0.17 |
| Log D‐dimer | 0.9 (0.7–1.1), 0.27 | 0.9 (0.7–1.1), 0.16 | 0.9 (0.7–1.1), 0.18 | 0.9 (0.7–1.2), 0.43 | 0.8 (0.6–1.1), 0.17 |
| Log‐CRP | 1.0 (0.9–1.3), 0.62 | 1.0 (0.8–1.3), 0.84 | 1.0 (0.8–1.2), 0.92 | 1.0 (0.8–1.3), 0.92 | 0.8 (0.7–1.1), 0.14 |
| Log sTNFαR I | 1.2 (1.0–1.5), 0.035d | 1.1 (0.9–1.4), 0.22 | 1.1 (0.9–1.3), 0.36 | 1.0 (0.8–1.3), 0.94 | 0.8 (0.5–1.1), 0.15 |
| Log sTNFαR II | 1.1 (0.8–1.3), 0.60 | 0.97 (0.7–1.3), 0.85 | 0.9 (0.7–1.1), 0.36 | 1.1 (0.8–1.5), 0.56 | 0.9 (0.6–1.3), 0.55 |
| Total Plaque Scorec | |||||
| Log‐IL‐6 | 1.1 (1.02–1.2), 0.02d | 1.1 (0.98–1.2), 0.12 | 1.1 (0.98–1.2), 0.14 | 1.1 (0.97–1.3), 0.15 | 0.95 (0.8–1.1), 0.52 |
| Log ICAM‐1 | 1.0 (0.96–1.1), 0.27 | 1.0 (0.96–1.1), 0.48 | 1.0 (0.9–1.1), 0.65 | 1.1 (0.9–1.2), 0.44 | 1.0 (0.8–1.2), 0.85 |
| Fibrinogen | 1.1 (0.98–1.2), 0.13 | 1.1 (0.99–1.3), 0.08 | 1.1 (0.99–1.3), 0.07 | 1.1 (0.9–1.4), 0.23 | 1.1 (0.9–1.3), 0.31 |
| Log D‐dimer | 0.96 (0.9–1.1), 0.37 | 0.9 (0.8–1.04), 0.23 | 0.9 (0.8–1.1), 030 | 1.0 (0.9–1.2), 0.54 | 1.1 (0.9–1.2), 0.43 |
| Log‐CRP | 1.0 (0.9–1.1), 0.59 | 1.0 (0.9–1.1), 0.99 | 1.0 (0.9–1.1), 0.81 | 1.1 (0.9–1.2), 0.45 | 0.9 (0.8–1.03), 0.17 |
| Log sTNFαR I | 1.1 (0.98–1.3), 0.10 | 1.03 (0.9–1.2), 0.50 | 1.03 (0.9–1.2), 0.60 | 1.0 (0.9–1.1), 0.90 | 0.9 (0.8–1.02), 0.09 |
| Log sTNFαR II | 1.1 (0.95–1.2), 0.32 | 1.0 (0.9–1.1), 0.83 | 1.1 (0.9–1.1), 0.80 | 1.05 (0.9–1.2), 0.56 | 0.95 (0.8–1.1), 0.60 |
Model 1: Minimally adjusted models (including age, race/ethnicity, study center, and study cohort [pre‐ vs post‐2001]). Model 2: Model 1 plus traditional cardiovascular risk factors (systolic blood pressure, antihypertensive medication use, diabetes medication use, fasting glucose, total cholesterol, HDL cholesterol, use of lipid‐lowering medications, body mass index, smoking, and pack‐years of smoking). Model 3: Model 2 plus parameters of HIV infection (HIV duration, current viral load, current and nadir CD4+ T‐cell counts, and history of an AIDS‐defining malignancy or opportunistic infection, and duration of ART use). ART indicates antiretroviral therapy; CAD, coronary artery disease; CRP, C‐reactive protein; CT, computed tomography; HDL, high‐density lipoprotein cholesterol; ICAM‐1, intracellular adhesion molecule‐1; IL‐6, interleukin‐6; sTNFαR I, soluble tumor necrosis factor α receptor I.
Results presented as prevalence ratio (95% CI), P value.
The number participants dropped in Models 2 and 3 due to missing values in CAD risk factors and clinical parameters of HIV infection was negligible (less than 3%).
The results for plaque scores are based on the Poisson regressions and represent prevalence ratio associated with 1 score increase in plaque scores.
Statistically significant findings.
The interaction terms between inflammatory biomarkers and HIV serostatus were not statistically significant. As mentioned above, the analyses were done in 923 participants who did not have any missing values for the primary biomarkers of interest. Repeating these analyses in the whole study population after imputing missing values for biomarkers and CAD risk factors (using multiple imputations) did not yield significantly different results. Also, when the analyses were limited to participants with undetectable viral load, the results did not change significantly.
Discussion
To our knowledge, this is the largest study of the association between inflammatory biomarkers and measures of subclinical coronary artery disease using CTA in an HIV+ population. Our results demonstrate that several inflammatory biomarkers representing different domains of inflammation (IL‐6, ICAM‐1, sTNFαR I, and sTNFαR II) were significantly associated with a greater prevalence of coronary artery stenosis on CTA in HIV+ men, and these associations were independent of traditional risk factors and HIV clinical factors. Our study also shows that IL‐6, sTNFαR I, and sTNFαR II were independently related to extent of coronary artery calcification in HIV+ men. The study expands our knowledge of the relationship between inflammatory biomarkers and coronary plaque characteristics. Although HIV‐infected patients have higher prevalence of coronary artery plaques on CTA, predominantly noncalcified plaques, the studied inflammatory biomarkers were not associated with presence and extent of these coronary plaques and therefore do not appear to be mediating these associations.
Previous studies on HIV+ populations have reported the relationship of inflammatory biomarkers with cardiovascular mortality,26 evidence of ischemia on ECGs,51 and traditional risk factors for CAD.52 However, little is known about the relationship of these biomarkers with subclinical measures of atherosclerosis, specifically coronary artery stenosis and plaque characterization on CT scan, in HIV+ patients. Previously, a study of 60 HIV+ and 30 HIV− women reported higher prevalence of noncalcified plaques in HIV+ women.53 Although that study showed that sCD163 (a marker of monocyte activation) was related to plaque characterization,53 there were no significant differences in levels of IL‐6 between HIV+ and HIV− women. Similarly, another study by the same group on 101 HIV+ and 41 HIV− men showed increased plaque vulnerability in HIV+ patients and the plaque vulnerability was related to sCD163, but not to IL‐6, hs‐CRP, or D‐dimer.54 Our study expands our knowledge by providing detailed evaluation of coronary atherosclerosis using CT scans and determining the relationship of CT scan findings with general markers of inflammation and coagulation (fibrinogen and D‐dimer) in a larger extensively phenotyped population.
Our results showed that HIV+ participants, even those with undetectable viremia, had higher levels of inflammatory markers. More importantly, while these markers were not strong predictors of presence, extent, and composition of coronary plaques seen on CTA, they were independently associated with coronary artery stenosis. This is important as coronary artery stenosis could be considered the closest indicator of potentially clinically significant CAD among the measured CT scan parameters, and is the main parameter that is used in clinical practice for decision making with regard to referral for more invasive evaluations, particularly if associated with symptoms. In other words, these markers are not associated with the early stages of atherosclerosis, but are related to a more advanced stage, namely, coronary artery stenosis. These findings are consistent with the results of our previous analyses on the relationship of adiponectin and circulatory markers of monocyte activation with CT scan findings in the MACS population.44, 55
The biomarkers of inflammation and coagulation included in this study are widely used to represent different domains of inflammation (systemic mediators, endothelial cell activation, TNF‐α‐mediated immune cell activation, and acute phase response proteins) and coagulation, and the generally positive associations suggest widespread involvement of many facets of inflammation in HIV‐mediated atherosclerosis. Some of these markers are widely available for clinical use, and have been suggested by other studies to be related to clinical CAD in the general population.30, 31 In the SMART study,56 elevated IL‐6, hs‐CRP, and D‐dimer levels were related to risk for future CVD events in HIV+ patients, although the relationships with all‐cause mortality were stronger than for CVD. More recently, Nordell et al57 analyzed 3 trials, including the SMART trial, and reported that IL‐6 and D‐dimer, but not CRP, are associated with future fatal CVD and mortality following a nonfatal cardiovascular event. These studies have focused on prediction of future clinical events based on baseline levels of biomarkers. Our study enhances our knowledge by showing that the associations reported in these studies can be expanded to subclinical coronary artery stenosis determined by CTA, but not to the extent and composition of the atherosclerotic plaques. Interestingly, after adjustment for HIV− and CVD‐related risk factors, the prevalence ratios of coronary artery stenosis above 50% associated with each SD increase in values of IL‐6, hs‐CRP, and D‐dimer in our study were comparable to the hazard ratios reported in the SMART trial,56 although the association of hs‐CRP with coronary artery stenosis was only marginally significant (P=0.06) and the relationship of D‐dimer with coronary artery stenosis was not statistically significant.
The stronger relationship of the studied inflammatory markers with clinically important findings on CT scan (coronary stenosis and CAC score rather than extent and composition of atherosclerotic plaques) implies the potential of these markers in clinical practice for risk stratification of HIV‐infected patients and possibly monitoring progression of the subclinical atherosclerosis in this population. In other words, combining our results with the results of the previous studies on clinical CVD, it is possible that certain inflammatory markers may indicate an increased likelihood that the atherosclerotic process has progressed to subclinical stenosis of the coronary arteries and might impose an increased risk of CVD events in the future. However, further studies will be needed to determine the accuracy and reliability of using these markers in clinical practice.
The results of our study provide additional evidence of the complexity of the immunologic and inflammatory changes in HIV infection and their interactions with the atherosclerotic process. While some of the analyzed markers (IL‐6 and ICAM‐1) were independently associated with higher prevalence of coronary artery stenosis of above 50%, some others (sTNFαR I and sTNFαR II) were related to higher prevalence of more severe (≥70%) coronary artery stenosis; and hs‐CRP, D‐dimer, and fibrinogen did not have significant associations with coronary stenosis. Also, some markers (IL‐6, sTNFαR I, and sTNFαR II) were associated with CAC score, while fibrinogen was the only marker associated with the extent of noncalcified plaques. While one should recognize the different biological domains they represent when considering these differences, all blood biomarkers have substantial independent within‐subject variability, along with analytical imprecision, which also may explain some of the differences in association with outcomes we have observed.
While in our study several inflammatory markers were associated with coronary artery stenosis, these associations were not significant in HIV− participants. While the smaller sample size in this group, coupled with the lower level of inflammatory markers may play a role, this finding is consistent with observations in the general population, viz, that inflammation biomarkers are generally less strongly related to measures of underlying atherosclerosis than they are with clinical events58 and associate with clinical events somewhat independently of measures of atherosclerosis.59 The relatively wider ranges of CIs for PRs in the HIV− group indicate the possibility of not being able to capture the associations in this group due to power limitations. However, as mentioned above, our sample size is larger than other similar studies. Of note, the fact that the HIV− control group in MACS is drawn from the same reference population, namely, men who have sex with men with similar risk of smoking, drug use, and socioeconomic status, would minimize the potential for unmeasured confounding and selection bias.
One of the major strengths of our study is that it benefits from detailed phenotyping of subclinical CAD, using CTA in addition to noncontrast CT scans in a large, well‐defined cohort. The large sample size of our study confirms that the lack of association with some inflammatory markers and cardiac CT scan findings in HIV+ men are less likely to be due to lack of power. Our study, nonetheless, has some limitations. The cross‐section design of the study limits our ability to relate the inflammatory markers measured at a certain point to the atherosclerotic process that is developed over years. Long‐term follow‐up of the participants of this study will help us better understand the prognostic value of coronary CT scan findings, such as CAC, noncalcified plaque, and coronary stenosis in individuals with chronic inflammation due to HIV infection or other chronic diseases—an area that is less studied. The unstable nature of some of these inflammatory biomarkers, the within‐person variability (biological and lab‐related), and the fact that these markers represent global (rather than organ‐specific) inflammatory processes make it more challenging to demonstrate mechanisms linking inflammatory biomarkers with subclinical CAD. Additionally, while providing a comprehensive report of the relationship of seven biomarkers with several measures of subclinical CAD on CT scan is one of the strengths of this study, the large number of analyses performed may also be a limitation of the study, as there is a possibility of false‐positive findings. Therefore, the emphasis has been put on highlighting the associations that appear more consistent and plausible. These analyses include several models with the same predictors and outcomes, and the markers are correlated with each other. Therefore, borderline results should be considered cautiously. The fact that the P values associated with many positive findings are highly significant is reassuring. Finally, our study had less power to study the relationship of inflammatory markers with CT scan findings in HIV− men, and no definite conclusions can be made about associations in women.
In conclusion, inflammatory biomarker levels, representing several different aspects of inflammation, are higher in HIV+ men than HIV− men and elevated levels of some of these markers are associated with greater prevalence of coronary artery stenosis, especially in HIV+ men. While inflammatory biomarkers are significant indicators of clinically important stenosis (≥50%) and CAC score, these markers are not significantly related to the extent and composition of atherosclerotic plaques. Our findings support the view that HIV‐mediated inflammation is an important contributor to CAD, and reflects the complexity of inflammatory processes in HIV‐infected individuals. Our ongoing studies will evaluate the longitudinal relationship of these biomarkers with progression of coronary artery atherosclerosis. Additional studies are needed to continue to evaluate the potential for using these markers for risk stratification and monitoring of high‐risk patients as well as the efficacy of therapeutic interventions.
Sources of Funding
The MACS CVD 2 study is funded by National Heart Lung and Blood Institute (NHLBI), RO1 HL095129 (Post), with additional support from UL1 RR 025005 from the National Center for Advancing Translational Sciences (NCATS), a component of the National Institutes of Health (NIH), and NIH Roadmap for Medical Research. The MACS is funded by the National Institute of Allergy and Infectious Diseases (NIAID), with additional supplemental funding from the National Cancer Institute (NCI), UO1‐AI‐35042, UL1‐RR025005, UM1‐AI‐35043, UO1‐AI‐35039, UO1‐AI‐35040, UO1‐AI‐35041, and CTSI grant UL1TR000124. The leading and corresponding author (Bahrami) was supported in part by National Heart, Lung, and Blood Institute grant 5K23HL128164A and National Institute of Biomedical Imaging and Bioengineering (NIBIB) training grant to Stanford Cardiovascular Institute (5T32EB009035‐06A1). The contents of this publication are solely the responsibility of the authors and do not necessarily represent the official view of the NIH, NIAID, NCI, or NHLBI.
Disclosures
Dr Palella is on the speaker's bureau for Gilead Sciences, Janssen Pharmaceuticals, Merck & Co., Inc., and Bristol‐Myers Squibb. Dr Matthew Budoff has received grants from General Electric Company and National Institute of Health (NIH). Dr McConnell has received research support from GE Healthcare. He is currently on partial leave of absence from Stanford and is employed at Verily Life Sciences. The other authors have no conflicts of interest to disclose.
Acknowledgments
The authors thank the other investigators, the staff, and the participants of the MACS study for their valuable contributions. Data in this article were collected by the Multicenter AIDS Cohort Study (MACS) with centers (Principal Investigators) at The Johns Hopkins Bloomberg School of Public Health (Joseph B. Margolick), Feinberg School of Medicine, Northwestern University, and Cook County Bureau of Health Services (John P. Phair, Steven M. Wolinsky), University of California, Los Angeles (Roger Detels), and University of Pittsburgh (Charles R. Rinaldo), and the Data Center located at the Johns Hopkins Bloomberg School of Public Health (Lisa P. Jacobson). More information about the study and other investigators can be found on the website located at: http://www.statepi.jhsph.edu/macs/macs.html.
(J Am Heart Assoc. 2016;5:e003371 doi: 10.1161/JAHA.116.003371)
References
- 1. WHO, UNICEF, UNAIDS . Global HIV/AIDS response: epidemic update and health sector progress towards universal access. Progress report. 2011.
- 2. Ho JE, Hsue PY. Cardiovascular manifestations of HIV infection. Heart. 2009;95:1193–1202. [DOI] [PubMed] [Google Scholar]
- 3. Sudano I, Spieker LE, Noll G, Corti R, Weber R, Luscher TF. Cardiovascular disease in HIV infection. Am Heart J. 2006;151:1147–1155. [DOI] [PubMed] [Google Scholar]
- 4. Thienemann F, Sliwa K, Rockstroh JK. HIV and the heart: the impact of antiretroviral therapy: a global perspective. Eur Heart J. 2013;34:3538–3546. [DOI] [PubMed] [Google Scholar]
- 5. Neumann T, Esser S, Potthoff A, Pankuweit S, Neumann A, Breuckmann F, Neuhaus K, Kondratieva J, Buck T, Muller‐Tasch T, Wachter R, Prettin C, Gelbrich G, Herzog W, Pieske B, Rauchhaus M, Loffler M, Maisch B, Mugge A, Wasem J, Gerken G, Brockmeyer NH, Erbel R. Prevalence and natural history of heart failure in outpatient HIV‐infected subjects: rationale and design of the HIV‐HEART study. Eur J Med Res. 2007;12:243–248. [PubMed] [Google Scholar]
- 6. Sackoff JE, Hanna DB, Pfeiffer MR, Torian LV. Causes of death among persons with AIDS in the era of highly active antiretroviral therapy: New York City. Ann Intern Med. 2006;145:397–406. [DOI] [PubMed] [Google Scholar]
- 7. Barbarinia G, Barbaro G. Incidence of the involvement of the cardiovascular system in HIV infection. AIDS. 2003;17(suppl 1):S46–S50. [PubMed] [Google Scholar]
- 8. Palella FJ Jr, Baker RK, Moorman AC, Chmiel JS, Wood KC, Brooks JT, Holmberg SD. Mortality in the highly active antiretroviral therapy era: changing causes of death and disease in the HIV outpatient study. J Acquir Immune Defic Syndr. 2006;43:27–34. [DOI] [PubMed] [Google Scholar]
- 9. Grunfeld C, Delaney JA, Wanke C, Currier JS, Scherzer R, Biggs ML, Tien PC, Shlipak MG, Sidney S, Polak JF, O'Leary D, Bacchetti P, Kronmal RA. Preclinical atherosclerosis due to HIV infection: carotid intima‐medial thickness measurements from the FRAM study. AIDS. 2009;23:1841–1849. [DOI] [PMC free article] [PubMed] [Google Scholar]
- 10. Holloway CJ, Ntusi N, Suttie J, Mahmod M, Wainwright E, Clutton G, Hancock G, Beak P, Tajar A, Piechnik SK, Schneider JE, Angus B, Clarke K, Dorrell L, Neubauer S. Comprehensive cardiac magnetic resonance imaging and spectroscopy reveal a high burden of myocardial disease in HIV patients. Circulation. 2013;128:814–822. [DOI] [PubMed] [Google Scholar]
- 11. Hsue PY, Hunt PW, Ho JE, Farah HH, Schnell A, Hoh R, Martin JN, Deeks SG, Bolger AF. Impact of HIV infection on diastolic function and left ventricular mass. Circ Heart Fail. 2010;3:132–139. [DOI] [PMC free article] [PubMed] [Google Scholar]
- 12. Hsue PY, Lo JC, Franklin A, Bolger AF, Martin JN, Deeks SG, Waters DD. Progression of atherosclerosis as assessed by carotid intima‐media thickness in patients with HIV infection. Circulation. 2004;109:1603–1608. [DOI] [PubMed] [Google Scholar]
- 13. Lai H, Redheuil A, Tong W, Bluemke DA, Lima JA, Ren S, Lai S. HIV infection and abnormal regional ventricular function. Int J Cardiovasc Imaging. 2009;25:809–817. [DOI] [PMC free article] [PubMed] [Google Scholar]
- 14. Sims A, Frank L, Cross R, Clauss S, Dimock D, Purdy J, Mikhail I, Hazra R, Hadigan C, Sable C. Abnormal cardiac strain in children and young adults with HIV acquired in early life. J Am Soc Echocardiogr. 2012;25:741–748. [DOI] [PMC free article] [PubMed] [Google Scholar]
- 15. Bahrami H, Fonarow G, Heidenreich P. Heart failure admission in HIV‐infected patients. J Am Coll Cardiol. 2014;63:(12_s). [Google Scholar]
- 16. Grinspoon SK, Grunfeld C, Kotler DP, Currier JS, Lundgren JD, Dube MP, Lipshultz SE, Hsue PY, Squires K, Schambelan M, Wilson PW, Yarasheski KE, Hadigan CM, Stein JH, Eckel RH. State of the science conference: initiative to decrease cardiovascular risk and increase quality of care for patients living with HIV/AIDS: executive summary. Circulation. 2008;118:198–210. [DOI] [PMC free article] [PubMed] [Google Scholar]
- 17. Friis‐Moller N, Weber R, Reiss P, Thiebaut R, Kirk O, d'Arminio Monforte A, Pradier C, Morfeldt L, Mateu S, Law M, El‐Sadr W, De Wit S, Sabin CA, Phillips AN, Lundgren JD. Cardiovascular disease risk factors in HIV patients—association with antiretroviral therapy. Results from the DAD study. AIDS. 2003;17:1179–1193. [DOI] [PubMed] [Google Scholar]
- 18. Krishnaswamy G, Chi DS, Kelley JL, Sarubbi F, Smith JK, Peiris A. The cardiovascular and metabolic complications of HIV infection. Cardiol Rev. 2000;8:260–268. [DOI] [PubMed] [Google Scholar]
- 19. Ssinabulya I, Kayima J, Longenecker C, Luwedde M, Semitala F, Kambugu A, Ameda F, Bugeza S, McComsey G, Freers J, Nakanjako D. Subclinical atherosclerosis among HIV‐infected adults attending HIV/AIDS care at two large ambulatory HIV clinics in Uganda. PLoS One. 2014;9:e89537. [DOI] [PMC free article] [PubMed] [Google Scholar]
- 20. Bavinger C, Bendavid E, Niehaus K, Olshen RA, Olkin I, Sundaram V, Wein N, Holodniy M, Hou N, Owens DK, Desai M. Risk of cardiovascular disease from antiretroviral therapy for HIV: a systematic review. PLoS One. 2013;8:e59551. [DOI] [PMC free article] [PubMed] [Google Scholar]
- 21. Sabin CA, Worm SW, Weber R, Reiss P, El‐Sadr W, Dabis F, De Wit S, Law M, D'Arminio Monforte A, Friis‐Moller N, Kirk O, Pradier C, Weller I, Phillips AN, Lundgren JD. Use of nucleoside reverse transcriptase inhibitors and risk of myocardial infarction in HIV‐infected patients enrolled in the D:A:D study: a multi‐cohort collaboration. Lancet. 2008;371:1417–1426. [DOI] [PMC free article] [PubMed] [Google Scholar]
- 22. Friis‐Moller N, Sabin CA, Weber R, d'Arminio Monforte A, El‐Sadr WM, Reiss P, Thiebaut R, Morfeldt L, De Wit S, Pradier C, Calvo G, Law MG, Kirk O, Phillips AN, Lundgren JD. Combination antiretroviral therapy and the risk of myocardial infarction. N Engl J Med. 2003;349:1993–2003. [DOI] [PubMed] [Google Scholar]
- 23. Lang S, Mary‐Krause M, Cotte L, Gilquin J, Partisani M, Simon A, Boccara F, Costagliola D. Impact of individual antiretroviral drugs on the risk of myocardial infarction in human immunodeficiency virus‐infected patients: a case‐control study nested within the French Hospital Database on HIV ANRS cohort CO4. Arch Intern Med. 2010;170:1228–1238. [DOI] [PubMed] [Google Scholar]
- 24. Ding X, Andraca‐Carrera E, Cooper C, Miele P, Kornegay C, Soukup M, Marcus KA. No association of abacavir use with myocardial infarction: findings of an FDA meta‐analysis. J Acquir Immune Defic Syndr. 2012;61:441–447. [DOI] [PubMed] [Google Scholar]
- 25. Emery S, Neuhaus JA, Phillips AN, Babiker A, Cohen CJ, Gatell JM, Girard PM, Grund B, Law M, Losso MH, Palfreeman A, Wood R. Major clinical outcomes in antiretroviral therapy (ART)‐naive participants and in those not receiving ART at baseline in the SMART study. J Infect Dis. 2008;197:1133–1144. [DOI] [PubMed] [Google Scholar]
- 26. Kuller LH, Tracy R, Belloso W, De Wit S, Drummond F, Lane HC, Ledergerber B, Lundgren J, Neuhaus J, Nixon D, Paton NI, Neaton JD. Inflammatory and coagulation biomarkers and mortality in patients with HIV infection. PLoS Med. 2008;5:e203. [DOI] [PMC free article] [PubMed] [Google Scholar]
- 27. Hunt PW, Landay AL, Sinclair E, Martinson JA, Hatano H, Emu B, Norris PJ, Busch MP, Martin JN, Brooks C, McCune JM, Deeks SG. A low T regulatory cell response may contribute to both viral control and generalized immune activation in HIV controllers. PLoS One. 2011;6:e15924. [DOI] [PMC free article] [PubMed] [Google Scholar]
- 28. Jain V, Hartogensis W, Bacchetti P, Hunt PW, Hatano H, Sinclair E, Epling L, Lee TH, Busch MP, McCune JM, Pilcher CD, Hecht FM, Deeks SG. Antiretroviral therapy initiated within 6 months of HIV infection is associated with lower T‐cell activation and smaller HIV reservoir size. J Infect Dis. 2013;208:1202–1211. [DOI] [PMC free article] [PubMed] [Google Scholar]
- 29. Hunt PW, Martin JN, Sinclair E, Bredt B, Hagos E, Lampiris H, Deeks SG. T cell activation is associated with lower CD4+ T cell gains in human immunodeficiency virus‐infected patients with sustained viral suppression during antiretroviral therapy. J Infect Dis. 2003;187:1534–1543. [DOI] [PubMed] [Google Scholar]
- 30. Ridker PM. Inflammation, C‐reactive protein, and cardiovascular disease: moving past the marker versus mediator debate. Circ Res. 2014;114:594–595. [DOI] [PubMed] [Google Scholar]
- 31. Kaptoge S, Di Angelantonio E, Lowe G, Pepys MB, Thompson SG, Collins R, Danesh J. C‐reactive protein concentration and risk of coronary heart disease, stroke, and mortality: an individual participant meta‐analysis. Lancet. 2010;375:132–140. [DOI] [PMC free article] [PubMed] [Google Scholar]
- 32. Jialal I, Devaraj S, Venugopal SK. C‐reactive protein: risk marker or mediator in atherothrombosis? Hypertension. 2004;44:6–11. [DOI] [PubMed] [Google Scholar]
- 33. Bahrami H, Bluemke DA, Kronmal R, Bertoni AG, Lloyd‐Jones DM, Shahar E, Szklo M, Lima JA. Novel metabolic risk factors for incident heart failure and their relationship with obesity: the MESA (Multi‐Ethnic Study of Atherosclerosis) study. J Am Coll Cardiol. 2008;51:1775–1783. [DOI] [PubMed] [Google Scholar]
- 34. Detrano R, Guerci AD, Carr JJ, Bild DE, Burke G, Folsom AR, Liu K, Shea S, Szklo M, Bluemke DA, O'Leary DH, Tracy R, Watson K, Wong ND, Kronmal RA. Coronary calcium as a predictor of coronary events in four racial or ethnic groups. N Engl J Med. 2008;358:1336–1345. [DOI] [PubMed] [Google Scholar]
- 35. Currier JS, Kendall MA, Henry WK, Alston‐Smith B, Torriani FJ, Tebas P, Li Y, Hodis HN. Progression of carotid artery intima‐media thickening in HIV‐infected and uninfected adults. AIDS. 2007;21:1137–1145. [DOI] [PubMed] [Google Scholar]
- 36. Kingsley LA, Cuervo‐Rojas J, Munoz A, Palella FJ, Post W, Witt MD, Budoff M, Kuller L. Subclinical coronary atherosclerosis, HIV infection and antiretroviral therapy: Multicenter AIDS Cohort Study. AIDS. 2008;22:1589–1599. [DOI] [PMC free article] [PubMed] [Google Scholar]
- 37. Talwani R, Falusi OM, Mendes de Leon CF, Nerad JL, Rich S, Proia LA, Sha BE, Smith KY, Kessler HA. Electron beam computed tomography for assessment of coronary artery disease in HIV‐infected men receiving antiretroviral therapy. J Acquir Immune Defic Syndr. 2002;30:191–195. [DOI] [PubMed] [Google Scholar]
- 38. Acevedo M, Sprecher DL, Calabrese L, Pearce GL, Coyner DL, Halliburton SS, White RD, Sykora E, Kondos GT, Hoff JA. Pilot study of coronary atherosclerotic risk and plaque burden in HIV patients: ‘a call for cardiovascular prevention’. Atherosclerosis. 2002;163:349–354. [DOI] [PubMed] [Google Scholar]
- 39. Fitch KV, Lo J, Abbara S, Ghoshhajra B, Shturman L, Soni A, Sacks R, Wei J, Grinspoon S. Increased coronary artery calcium score and noncalcified plaque among HIV‐infected men: relationship to metabolic syndrome and cardiac risk parameters. J Acquir Immune Defic Syndr. 2010;55:495–499. [DOI] [PMC free article] [PubMed] [Google Scholar]
- 40. Voros S, Rinehart S, Qian Z, Joshi P, Vazquez G, Fischer C, Belur P, Hulten E, Villines TC. Coronary atherosclerosis imaging by coronary CT angiography: current status, correlation with intravascular interrogation and meta‐analysis. JACC Cardiovasc Imaging. 2011;4:537–548. [DOI] [PubMed] [Google Scholar]
- 41. Ahmadi N, Nabavi V, Hajsadeghi F, Flores F, French WJ, Mao SS, Shavelle D, Ebrahimi R, Budoff M. Mortality incidence of patients with non‐obstructive coronary artery disease diagnosed by computed tomography angiography. Am J Cardiol. 2011;107:10–16. [DOI] [PubMed] [Google Scholar]
- 42. Motoyama S, Kondo T, Sarai M, Sugiura A, Harigaya H, Sato T, Inoue K, Okumura M, Ishii J, Anno H, Virmani R, Ozaki Y, Hishida H, Narula J. Multislice computed tomographic characteristics of coronary lesions in acute coronary syndromes. J Am Coll Cardiol. 2007;50:319–326. [DOI] [PubMed] [Google Scholar]
- 43. Habib PJ, Green J, Butterfield RC, Kuntz GM, Murthy R, Kraemer DF, Percy RF, Miller AB, Strom JA. Association of cardiac events with coronary artery disease detected by 64‐slice or greater coronary CT angiography: a systematic review and meta‐analysis. Int J Cardiol. 2013;169:112–120. [DOI] [PubMed] [Google Scholar]
- 44. McKibben RA, Margolick JB, Grinspoon S, Li X, Palella FJ Jr, Kingsley LA, Witt MD, George RT, Jacobson LP, Budoff M, Tracy RP, Brown TT, Post WS. Elevated levels of monocyte activation markers are associated with subclinical atherosclerosis in men with and those without HIV infection. J Infect Dis. 2015;211:1219–1228. [DOI] [PMC free article] [PubMed] [Google Scholar]
- 45. Kaslow RA, Ostrow DG, Detels R, Phair JP, Polk BF, Rinaldo CR Jr. The Multicenter AIDS Cohort Study: rationale, organization, and selected characteristics of the participants. Am J Epidemiol. 1987;126:310–318. [DOI] [PubMed] [Google Scholar]
- 46. Post WS, Budoff M, Kingsley L, Palella FJ Jr, Witt MD, Li X, George RT, Brown TT, Jacobson LP. Associations between HIV infection and subclinical coronary atherosclerosis. Ann Intern Med. 2014;160:458–467. [DOI] [PMC free article] [PubMed] [Google Scholar]
- 47. Hacioglu Y, Gupta M, Choi TY, George RT, Deible CR, Jacobson LP, Witt MD, Palella FJ, Post WS, Budoff MJ. Use of cardiac CT angiography imaging in an epidemiology study—the Methodology of the Multicenter AIDS Cohort Study cardiovascular disease substudy. Anadolu Kardiyol Derg. 2013;13:207–214. [DOI] [PMC free article] [PubMed] [Google Scholar]
- 48. Austen WG, Edwards JE, Frye RL, Gensini GG, Gott VL, Griffith LS, McGoon DC, Murphy ML, Roe BB. A reporting system on patients evaluated for coronary artery disease. Report of the Ad Hoc Committee for Grading of Coronary Artery Disease, Council on Cardiovascular Surgery, American Heart Association. Circulation. 1975;51:5–40. [DOI] [PubMed] [Google Scholar]
- 49. Pagali SR, Madaj P, Gupta M, Nair S, Hamirani YS, Min JK, Lin F, Budoff MJ. Interobserver variations of plaque severity score and segment stenosis score in coronary arteries using 64 slice multidetector computed tomography: a substudy of the ACCURACY trial. J Cardiovasc Comput Tomogr. 2010;4:312–318. [DOI] [PubMed] [Google Scholar]
- 50. Zou G. A modified Poisson regression approach to prospective studies with binary data. Am J Epidemiol. 2004;159:702–706. [DOI] [PubMed] [Google Scholar]
- 51. Gupta M, Miller CJ, Baker JV, Lazar J, Bogner JR, Calmy A, Soliman EZ, Neaton JD. Biomarkers and electrocardiographic evidence of myocardial ischemia in patients with human immunodeficiency virus infection. Am J Cardiol. 2013;111:760–764. [DOI] [PMC free article] [PubMed] [Google Scholar]
- 52. Tebas P, Henry WK, Matining R, Weng‐Cherng D, Schmitz J, Valdez H, Jahed N, Myers L, Powderly WG, Katzenstein D. Metabolic and immune activation effects of treatment interruption in chronic HIV‐1 infection: implications for cardiovascular risk. PLoS One. 2008;3:e2021. [DOI] [PMC free article] [PubMed] [Google Scholar]
- 53. Fitch KV, Srinivasa S, Abbara S, Burdo TH, Williams KC, Eneh P, Lo J, Grinspoon SK. Noncalcified coronary atherosclerotic plaque and immune activation in HIV‐infected women. J Infect Dis. 2013;208:1737–1746. [DOI] [PMC free article] [PubMed] [Google Scholar]
- 54. Zanni MV, Abbara S, Lo J, Wai B, Hark D, Marmarelis E, Grinspoon SK. Increased coronary atherosclerotic plaque vulnerability by coronary computed tomography angiography in HIV‐infected men. AIDS. 2013;27:1263–1272. [DOI] [PMC free article] [PubMed] [Google Scholar]
- 55. Ketlogetswe KS, Post WS, Li X, Palella FJ Jr, Jacobson LP, Margolick JB, Kingsley LA, Witt MD, Dobs AS, Budoff MJ, Brown TT. Lower adiponectin is associated with subclinical cardiovascular disease among HIV‐infected men. AIDS. 2014;28:901–909. [DOI] [PMC free article] [PubMed] [Google Scholar]
- 56. Duprez DA, Neuhaus J, Kuller LH, Tracy R, Belloso W, De Wit S, Drummond F, Lane HC, Ledergerber B, Lundgren J, Nixon D, Paton NI, Prineas RJ, Neaton JD. Inflammation, coagulation and cardiovascular disease in HIV‐infected individuals. PLoS One. 2012;7:e44454. [DOI] [PMC free article] [PubMed] [Google Scholar]
- 57. Nordell AD, McKenna M, Borges AH, Duprez D, Neuhaus J, Neaton JD. Severity of cardiovascular disease outcomes among patients with HIV is related to markers of inflammation and coagulation. J Am Heart Assoc. 2014;3:e000844 doi: 10.1161/JAHA.114.000844. [DOI] [PMC free article] [PubMed] [Google Scholar]
- 58. Folsom AR, Pankow JS, Tracy RP, Arnett DK, Peacock JM, Hong Y, Djousse L, Eckfeldt JH. Association of C‐reactive protein with markers of prevalent atherosclerotic disease. Am J Cardiol. 2001;88:112–117. [DOI] [PubMed] [Google Scholar]
- 59. Cao JJ, Thach C, Manolio TA, Psaty BM, Kuller LH, Chaves PH, Polak JF, Sutton‐Tyrrell K, Herrington DM, Price TR, Cushman M. C‐reactive protein, carotid intima‐media thickness, and incidence of ischemic stroke in the elderly: the Cardiovascular Health Study. Circulation. 2003;108:166–170. [DOI] [PubMed] [Google Scholar]