

Abstract
Background
ECG criteria differentiating Takotsubo cardiomyopathy (TTC) from mainly anterior myocardial infarction (MI) have been suggested; however, this was in small patient populations.
Methods and Results
Twelve‐lead admission ECGs of consecutive 200 TTC and 200 MI patients were compared in dichotomized groups based on the presence or absence of ST‐elevation MI (STEMI versus STE‐TTC and non‐ST elevation MI versus non ST‐elevation‐TTC). When comparing STEMI and STE‐TTC, ST‐elevation in –aVR was characteristic of STE‐TTC with a sensitivity/specificity of 43% and 95%, positive predictive value (PPV) 91%, and a negative predictive value (NPV) 62% (P<0.001); when ST‐elevation in –aVR is accompanied by ST‐elevation in inferior leads, sensitivity/specificity were 14% and 98% (PPV was 89% and NPV 52%) (P=0.001), and 12% and 100% when associated with ST‐elevation in anteroseptal leads (PPV 100%, NPV 52%) (P<0.001). On the other hand, STEMI was characterized by ST‐elevation in aVR (sensitivity/specificity of 31% and 95% P<0.001, PPV 85% and NPV 59%) and ST‐depression in V2‐V3‐V4 (sensitivity/specificity of 24% and 100% P<0.001, PPV 100% and NPV 76%). When comparing non‐ST elevation MI and non ST‐elevation‐TTC, T‐inversion in leads I‐aVL‐V5‐V6 had a sensitivity/specificity of 17% and 97% for non ST‐elevation‐TTC (PPV 83% and NPV 55%) (P<0.001), and ST‐elevation in –aVR with T‐inversion in any lead was also specific for non ST‐elevation‐TTC (sensitivity/specificity of 8% and 100%, PPV 100% and NPV 53%) (P=0.006). In non‐ST elevation MI patients, the presence of ST‐depression in V2‐V3 was specific (sensitivity/specificity of 11% and 99%, PPV 91% and NPV 51%) (P=0.01).
Conclusions
ECG on admission can differentiate between TTC and acute MI, with high specificity and positive predictive value.
Clinical Trial Registration
URL: https://www.clinicaltrials.gov/. Unique identifier: NCT01947621.
Keywords: differential diagnosis, electrocardiogram, myocardial infarction, stress‐induced cardiomyopathy, Takotsubo cardiomyopathy
Subject Categories: Cardiomyopathy, Myocardial Infarction, Electrophysiology
Introduction
Takotsubo cardiomyopathy (TTC), also called stress‐induced cardiomyopathy, is characterized by a transient, reversible, regional systolic and diastolic dysfunction usually involving the left ventricular apex and midventricle with hyperkinesia of the basal left ventricular segments.1, 2, 3, 4, 5, 6 The early clinical features are similar to those of acute coronary syndromes including chest pain, ECG changes, and modest elevation in cardiac troponin.1, 6, 7, 8 The differential diagnosis can be challenging, especially in the presence of ST‐segment elevation on the admission ECG, where a rapid treatment decision including reperfusion therapy is crucial.
Electrocardiographic characteristics at the time of presentation have been proposed as a means to differentiate between TTC and acute coronary syndromes,9, 10, 11, 12, 13, 14, 15, 16 but data are still insufficient, partially due to limited sample size of most studies and heterogeneity of study designs. In addition, the majority of ECG studies compared TTC to only anterior myocardial infarction (MI). In fact, admission ECG patterns of TTC patients are diverse, and the prevalence of ST‐elevation is quite variable, ranging from 11% to 100%.3, 5, 17, 18
The aim of the present study was to compare admission ECG between TTC and acute MI including ST elevation MI (STEMI) and non‐ST elevation MI (NSTEMI) in our large cohort of patients in order to define specific ECG changes that differentiate between both entities.
Methods
Study Population
We retrospectively included 200 consecutive patients who met the revised TTC Mayo Clinic diagnostic criteria7, 19 from 7 cardiovascular centers of 4 countries (Austria, Germany, Poland, and Switzerland) (Data S1) participating in the International Takotsubo Registry (InterTAKRegistry; www.takotsubo-registry.com; ClinicalTrials.gov number NCT01947621) between 2002 and 2012, and 200 consecutive patients admitted for MI20 from the Zurich Acute Coronary Syndromes Registry from February until August 2013. The registry adhered to the requirements of the respective local ethics committee and all patients gave informed consent. Inclusion criteria were hospital admission less than 12 hours after the onset of acute coronary syndromes symptoms, followed by emergency coronary angiography; no electrocardiographic findings such as bundle branch block, intraventricular conduction disturbance, or ventricular rhythm; TTC was defined as transient akinesia or dyskinesia of the left ventricular apical and midventricular segments with regional wall motion abnormalities extending to the epicardial coronary artery.
The admission ECGs at hospital presentation were reviewed in a blinded manner by 2 experienced cardiologists. ECGs from patients with TTC were compared to ECGs of patients with MI. Dichotomization of all patients into 2 groups was performed based on the presence or absence of ST‐segment elevation (ST‐elevation) on ECG: STEMI versus TTC with ST‐elevation and NSTEMI versus TTC without ST‐elevation. Subgroups were compared and specific differentiating ECG criteria were identified to differentiate between both diseases.
Electrocardiogram
A 12‐lead ECG was recorded on admission at a paper speed of 25 mm/s and an amplification of 10 mm/mV. he isoelectric line was defined as the level of the preceding TP segment. ST‐segment deviation was measured to the nearest 0.5 mm at the J point as recommended by the third universal definition of myocardial infarction.20 An ST‐elevation was considered present if it was ≥1.0 mm in any leads. A T wave inversion (T‐inversion) was considered present if the depth was >1.0 mm in any lead. ST‐segment depression (ST‐depression) was defined as horizontal or downsloping ST‐segment deviation ≥1.0 mm in any lead. ST‐depression in aVR, also known as ST‐elevation in –aVR, was considered an independent entity from STEMI and NSTEMI.
We analyzed the following electrocardiographic findings: the presence or absence of ST‐elevation in limb and precordial lead (subgroup when ST‐elevation ≥2.0 mm in V2 and V3) and/or the presence or absence of ST‐depression and/or T‐inversion. ST‐elevation magnitude, when existing, was also measured to the nearest 0.5 mm in all leads. Furthermore, ECG localization was categorized as follows: inferior changes when the ECG pattern met the criteria mentioned above in ≥2 of 3 leads (II, III, and avF), anteroseptal when it applies in ≥2 of 3 leads (V1, V2, and V3), lateral in ≥2 of 4 leads (I, avL, V5, and V6), and anterior in ≥4 of 6 leads (V1, V2, V3, V4, V5, and V6).20, 21 Basic parameters (ventricular rate, PR interval, QRS duration, and QT interval) were measured in all cases of ECG and corrected QT intervals (QTc) were measured using Bazett's formula (QTc=QT/RR interval).
Statistical Analysis
Continuous data are expressed as mean±SD. Comparisons of continuous data were performed using the unpaired Student t test or the Mann–Whitney U test and paired Student t test for evolution comparison. Categorical data were analyzed using the Fisher's exact test or the χ2 test as well as the McNemar test for evolution. Based on the results of the univariate analysis comparing simple ECG parameters to differentiate between TTC and acute MI, combinations of the most significant ECG parameters were performed and analyzed accordingly. Sensitivity and specificity for the most significant ECG combinations as well as positive and negative predictive values (PPV and NPV) were then computed. Afterwards, ECG criteria for the differentiation between TTC and MI proposed in previously published studies were collected and re‐analysis of the same criteria with the same subgroups of patients from our data was performed. A binary logistic regression was performed on 2 steps in each subgroup, analyzing the significant baseline and clinical characteristics in univariate analysis at first, then adding to the model the specific differential ECG combinations. A P<0.05 was considered statistically significant. All analyses were performed using SPSS version 20.0 for Windows (SPSS, Inc., Chicago, IL).
Results
TTC Versus MI
Two hundred TTC patients were compared with 200 MI patients. Baseline clinical characteristics are summarized in Table 1. While the median age was similar, the percentage of women was much higher in the TTC group (91% versus 27%, P<0.001). Furthermore, MI patients had significantly higher body mass index, a higher rate of diabetes mellitus, dyslipidemia, smoking history and, by definition, known coronary artery disease. Ejection fraction on admission was lower in TTC patients (43% versus 51%, P<0.001), as were peak levels of troponin, creatinine kinase, and C‐reactive protein. In‐hospital complications, cardiogenic shock, and all‐cause mortality were similar in both groups.
Table 1.
Characteristics of the Total Study Population; Comparison Between MI and TTC
| Total TTC | Total MI | P Value | |
|---|---|---|---|
| N=200 | N=200 | ||
| Baseline characteristics | |||
| Age, ya | 65.5±12.1 | 65.8±12.3 | 0.62 |
| Female | 182 (91) | 53 (27) | <0.001 |
| BMI, kg/m²a | 24.5±4.4 | 28.4±6.0 | <0.001 |
| Cardiovascular risk factors and cardiovascular history | |||
| Hypertension | 109 (55) | 125 (64) | 0.10 |
| Diabetes mellitus | 18 (9) | 37 (19) | 0.006 |
| Ever‐smoker | 71 (36) | 114 (57) | <0.001 |
| Current smoker | 38 (19) | 86 (43) | <0.001 |
| Dyslipidemia | 52 (26) | 109 (56) | <0.001 |
| Positive family history of cardiovascular disease | 50 (25) | 53 (28) | 0.65 |
| Known CAD | 11 (6) | 31 (16) | 0.001 |
| Clinical and laboratory parameters | |||
| EF at admission (%)a | 43±10 (N=193) | 51±11 (N=151) | <0.001 |
| Peak troponin level (ULN)a | 21.0±27.7 (N=187) | 36.4±63.5 (N=200) | 0.002 |
| Peak CK level (ULN)a | 2.5±7.3 (N=164) | 7.5±10.2 (N=200) | <0.001 |
| Peak CRP level, mg/La | 35.4±54.5 (N=173) | 67.5±109.9 (N=192) | 0.001 |
| In‐hospital complications | |||
| Cardiogenic shock | 16 (8) | 19 (10) | 0.60 |
| All‐cause mortality | 8 (4) | 10 (5) | 0.64 |
Depicted are counts, N incidence (%). BMI indicates body mass index; CAD, coronary artery disease; CK, creatine kinase; CRP, C‐reactive protein; EF, ejection fraction; MI, myocardial infarction; TTC, Takotsubo cardiomyopathy; ULN, upper limit of normal.
Mean±SD.
Admission ECG features upon admission in TTC and MI are shown in Figure 1, Table 2, and Table S1. QTc was longer in TTC patients, but QTc prolongation was not significant (102 [51%] versus 84 [42%] for TTC and MI, respectively, P=0.088). Heart rate was higher, PQ interval longer, and QRS width smaller in TTC patients. Normal ECG was present in 14% in both groups. ST‐elevation was present in 56% (n=111) in TTC and 53% (n=106) in MI, respectively, P=0.69.
Figure 1.
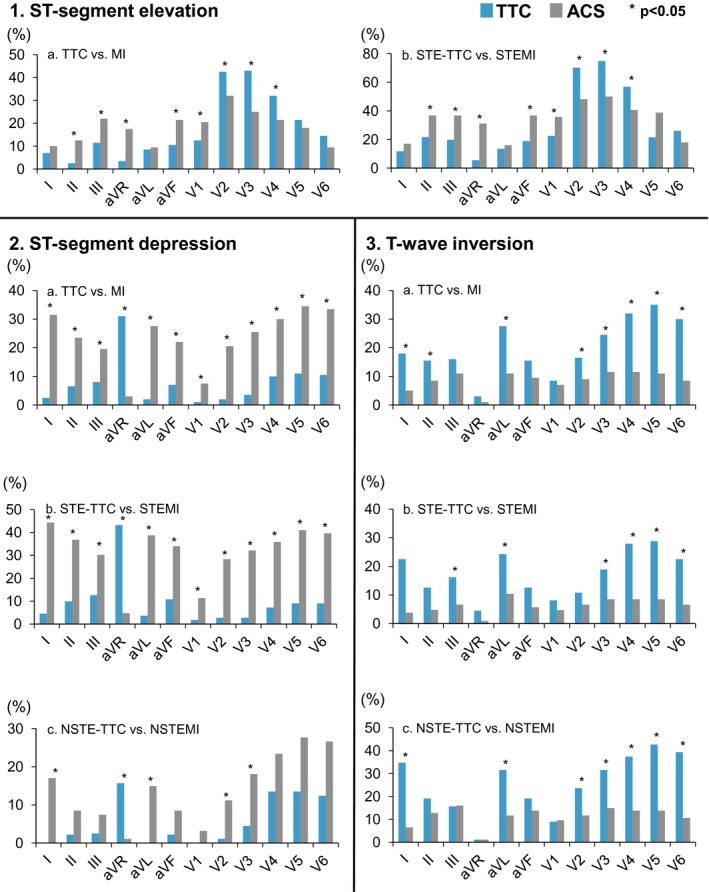
Comparison of 1—ST‐elevation, 2—ST‐depression, and 3—T‐wave inversion in 12‐lead ECG between Takotsubo cardiomyopathy and myocardial infarction in the setting of STEMI and NSTEMI presentation. ACS indicates acute coronary syndromes; MI, myocardial infarction; NSTEMI, non ST‐elevation MI; STEMI, ST‐elevation MI.
Table 2.
Admission ECG Characteristics; Comparison Between MI and TTC
| Total TTC | Total MI | P Value | |
|---|---|---|---|
| N=200 | N=200 | ||
| Sinus rhythm | 194 (97) | 188 (94) | 0.23 |
| Atrial fibrillation | 5 (3) | 11 (6) | 0.20 |
| Axis | |||
| Normal | 162 (81) | 164 (82) | 0.90 |
| Left | 33 (17) | 27 (14) | 0.48 |
| QTc, msa | 457.3±36.5 | 439.9±37.2 | <0.001 |
| QT prolongationb | 102 (51) | 84 (42) | 0.09 |
| Heart rate, bpma | 83±20 | 76±19 | <0.001 |
| PQ, msa | 165.3±31.4 | 153.9±48.7 | 0.006 |
| QRS, msa | 89.4±13.8 | 98.2±22.1 | <0.001 |
| RR, msa | 755±174 | 822±203 | 0.001 |
| Normal ECG | 28 (14) | 28 (14) | 1 |
| Q wave | 20 (10) | 29 (15) | 0.22 |
| ST‐elevation (STe) | 111 (56) | 106 (53) | 0.69 |
| STe with no concomitant ST depression or T wave inversion | 59 (30) | 23 (12) | <0.001 |
| STe inferiorc | 22 (11) | 41 (21) | 0.013 |
| STe laterald | 15 (8) | 9 (5) | 0.29 |
| STe anteroseptale | 43 (22) | 25 (13) | 0.023 |
| STe anteriorf | 45 (23) | 27 (14) | 0.026 |
| STe aVR | 7 (4) | 35 (18) | <0.001 |
| ST‐depression (STd) | 31 (16) | 106 (53) | <0.001 |
| STd with no concomitant ST elevation or T wave inversion | 8 (4) | 25 (13) | 0.003 |
| STd inferiorc | 15 (8) | 39 (19) | <0.001 |
| STd laterald | 19 (10) | 43 (22) | 0.001 |
| STd anteroseptale | 2 (1) | 10 (5) | 0.036 |
| STd anteriorf | 5 (3) | 38 (19) | <0.001 |
| STd in aVR (STe in ‐aVR) | 62 (31) | 6 (3) | <0.001 |
| T wave inversion (Tinv) | 90 (45) | 43 (22) | <0.001 |
| Sum of leads presenting Tinva | 2.20±0.16 | 2.29±2.46 | 0.71 |
| Tinv present in ≥5 leads | 60 (30) | 13 (7) | <0.001 |
| Tinv with no concomitant ST elevation or ST depression | 43 (22) | 24 (12) | 0.016 |
| Tinv inferiorc | 31 (16) | 18 (9) | 0.066 |
| Tinv laterald | 38 (19) | 11 (6) | <0.001 |
| Tinv anteroseptale | 4 (2) | 10 (5) | 0.17 |
| Tinv anteriorf | 43 (22) | 11 (6) | <0.001 |
Depicted are counts, N incidence (%). MI indicates myocardial infarction; TTC, Takotsubo cardiomyopathy.
Mean±SD.
QTc ≥440 ms and ≥460 ms for male and female sex, respectively.
More than 2 leads out of 3 in II‐III‐aVF.
More than 2 leads out of 4 in (I‐aVL‐V5‐V6).
More than 2 leads out of 3 in (V1‐V2‐V3).
More than 4 leads out of 6 in (V1‐V2‐V3‐V4‐V5‐V6).
ST‐depression was more common in all ECG leads in MI patients except aVR. Indeed, ST‐elevation in –aVR was more prevalent in TTC (31%; n=62) than in MI (3%; n=6; P<0.001). Similarly, T‐inversion occurred more often in TTC (45%; n=90) than in MI (22%, n=43; P<0.001), especially in lateral and anterior leads. Of note, T‐inversion in TTC patients also occurred more frequently in isolated form, with no concomitant ST‐elevation or ST‐depression (22%, n=43 versus 12%, n=24; P=0.016) and was more commonly present in 5 leads (30%, n=60) in TTC than in MI patients (7%, n=13; P<0.001).
When considering differences according to clinical presentation between physical and emotional triggers, no significant differences were noted between groups except for patients with 1 particular emotional trigger. Interestingly, we have found that patients presenting for TTC after panic/fear/anxiety had significantly more ST‐elevation on admission ECG compared with other TTC patients (16/18, 89% versus 95/182, 52% with ST‐elevation between groups, P=0.002).
TTC With ST‐Elevation Versus STEMI
One hundred eleven TTC patients with ST‐elevation were then compared to 106 STEMI patients. Baseline characteristics, which were similar to that of the entire groups (Table 1), are listed in Table S2.
The characteristics of the admission ECGs in TTC and STEMI are shown in Figure 1, Table 3, and Table S3. QTc prolongation was similarly common in both groups and occurred in 46.8% (n=52) in TTC and in 49.1% (n=52) in STEMI, respectively (P=0.79). Heart rate was higher in TTC, but the prolongation of the PQ interval fell short of significance. On the other hand, QRS width was broader in STEMI patients. Among those, isolated ST‐elevation with no concomitant ST‐depression or T‐inversion was more prevalent in the TTC group (30%, n=59) than in STEMI patients (12%, n=23; P<0.001), in which ST‐elevation was particularly more prevalent in anteroseptal or anterior leads (38%, n=42 versus 22%, n=23; P=0.012 and 40%, n=44 versus 26%, n=27; P=0.03, respectively), whereas STEMI patients exhibited ST‐elevation more commonly in aVR or in inferior leads (31%, n=33 versus 5%, n=6; P<0.001 and 38%, n=40 versus 20%, n=22; P=0.004, respectively).
Table 3.
Baseline ECG Characteristics; Comparison Between STE‐TTC and STEMI
| STE‐TTC | STEMI | P Value | |
|---|---|---|---|
| N=111 | N=106 | ||
| Sinus rhythm | 107 (96) | 99 (93) | 0.37 |
| Atrial fibrillation | 3 (3) | 6 (6) | 0.32 |
| Axis | |||
| Normal | 82 (74) | 83 (78) | 0.53 |
| Left | 26 (23) | 15 (14) | 0.09 |
| QTc, msa | 453±34 | 445±36 | 0.08 |
| QT prolongationb | 52 (47) | 52 (49) | 0.79 |
| Heart rate, bpma | 87±22 | 81±20 | 0.031 |
| PQ, msa | 165±31 | 158±48 | 0.22 |
| QRS, msa | 88±17 | 102±24 | <0.001 |
| RR, msa | 720±154 | 776±13 | 0.023 |
| Q wave | 17 (15) | 19 (18) | 0.72 |
| ST‐elevation (STe) | |||
| STe with no concomitant ST depression or T wave inversion | 58 (52) | 22 (21) | <0.001 |
| STe inferiorc | 22 (20) | 40 (38) | 0.004 |
| STe laterald | 15 (14) | 7 (7) | 0.12 |
| STe anteroseptale | 42 (38) | 23 (22) | 0.012 |
| STe anteriorf | 44 (40) | 27 (26) | 0.03 |
| STe aVR | 6 (5) | 33 (31) | <0.001 |
| ST‐depression (STd) | 18 (16) | 73 (69) | <0.001 |
| STd inferiorc | 13 (12) | 33 (31) | <0.001 |
| STd laterald | 11 (10) | 27 (26) | 0.004 |
| STd anteroseptale | 2 (2) | 9 (9) | 0.031 |
| STd anteriorf | 2 (2) | 23 (22) | <0.001 |
| STd in aVR (STe in ‐aVR) | 48 (43) | 5 (5) | <0.001 |
| T wave inversion (Tinv) | 40 (36) | 18 (17) | 0.002 |
| Sum of leads presenting Tinva | 3.80±1.80 | 3.98±2.17 | 0.51 |
| Tinv present in ≥5 leads | 60 (30) | 13 (7) | <0.001 |
| Tinv inferiorc | 14 (13) | 6 (6) | 0.10 |
| Tinv laterald | 15 (14) | 5 (5) | 0.033 |
| Tinv anteroseptale | 1 (1) | 3 (3) | 0.36 |
| Tinv anteriorf | 20 (18) | 5 (5) | 0.003 |
Depicted are counts, N incidence (%). STEMI indicates ST‐elevation myocardial infarction; STE‐TTC, ST‐elevation Takotsubo cardiomyopathy.
Mean±SD.
QTc ≥440 ms and ≥460 ms for male and female sex, respectively.
More than 2 leads out of 3 in II‐III‐aVF.
More than 2 leads out of 4 in (I‐aVL‐V5‐V6).
More than 2 leads out of 3 in (V1‐V2‐V3).
More than 4 leads out of 6 in (V1‐V2‐V3‐V4‐V5‐V6).
ST‐depression was more prevalent in STEMI compared to TTC ECGs (69%, n=73 versus 16%, n=18; P<0.001). This was the case in all leads, with the exception of aVR where ST‐elevation in –aVR was more common in TTC (43%, n=48 versus 5%, n=5; P<0.001). On the other hand, T‐inversion was more often observed in TTC in more than 5 leads (30%, n=60 versus 7%, n=13; P<0.001) and particularly in lateral and anterior leads.
Table 4 shows the diagnostic values of combined ECG findings for differentiating TTC from STEMI in the setting of a ST‐elevation ECG. The presence of T‐inversion in any lead on the admission ECG predicted TTC with a sensitivity and specificity of 36% and 83%, respectively (P=0.002) with a correspondent PPV of 63% and a NPV of 55%. ST‐elevation in –aVR was characteristic for TTC with a sensitivity and specificity of 43% and 95%, respectively (P<0.001; PPV of 91% and NPV of 62%, respectively).
Table 4.
Diagnostic Values of Combined Electrocardiographic Findings for Differentiating TTC From STEMI and NSTEMI
| Sensitivity (%) | Specificity (%) | PPV (%) | NPV (%) | P Value | |
|---|---|---|---|---|---|
| TTC vs STEMI in the setting of STe‐ECG | |||||
| Specific criteria for TTC | |||||
| Tinv (any lead) | 36 | 83 | 63 | 55 | 0.002 |
| STe in –aVR | 43 | 95 | 91 | 62 | <0.001 |
| STe in ‐aVR and No STe in V1 | 38 | 95 | 89 | 59 | <0.001 |
| STe in ‐aVR and no STe in V1 and no abnormal Q‐waves | 32 | 97 | 92 | 58 | <0.001 |
| STe in ‐aVR and STe in inferiora | 14 | 98 | 89 | 52 | 0.001 |
| STe in ‐aVR and STe in anteriorb | 19 | 98 | 91 | 54 | <0.001 |
| STe in ‐aVR and STe in anteroseptalc | 12 | 100 | 100 | 52 | <0.001 |
| Specific criteria for STEMI | |||||
| STd (any lead) | 69 | 84 | 80 | 74 | <0.001 |
| STd in inferiora | 31 | 88 | 72 | 57 | <0.001 |
| STe in aVR | 31 | 95 | 85 | 59 | <0.001 |
| STd in I and aVL | 34 | 96 | 90 | 64 | <0.001 |
| STe in aVR and STd in inferiora | 13 | 96 | 74 | 54 | 0.03 |
| STe in aVR and STd in anteriorb | 11 | 98 | 86 | 54 | 0.005 |
| STd in V2, V3, and V4 | 24 | 100 | 100 | 76 | <0.001 |
| TTC vs NSTEMI in the setting of non STe‐ECG | |||||
| Specific criteria for TTC | |||||
| Tinv in V5 and V6 | 39 | 90 | 80 | 61 | <0.001 |
| Tinv in ≥5 leads (any leads) | 36 | 92 | 80 | 60 | <0.001 |
| Tinv in I and aVL | 29 | 94 | 81 | 58 | <0.001 |
| Tinv in I, aVL, V5, and V6 | 17 | 97 | 83 | 55 | 0.002 |
| STe in –aVR | 16 | 99 | 93 | 55 | <0.001 |
| STe in ‐aVR and Tinv (any lead) | 8 | 100 | 100 | 53 | 0.006 |
| Specific criteria for NSTEMI | |||||
| STd (with no Tinv in any lead) | 25 | 91 | 74 | 53 | 0.006 |
| STd in anteriorb | 16 | 97 | 83 | 52 | 0.005 |
| STd in V2 and V3 | 11 | 99 | 91 | 51 | 0.01 |
NPV indicates negative predictive value; NSTEMI, non ST‐elevation myocardial infarction; PPV, positive predictive value; STd, ST‐depression; STe, ST‐elevation; STEMI, ST‐elevation myocardial infarction; Tinv, T wave inversion; TTC, Takotsubo cardiomyopathy.
More than 2 leads out of 3 in II‐III‐aVF.
More than 4 leads out of 6 in (V1‐V2‐V3‐V4‐V5‐V6).
More than 2 leads out of 3 in (V1‐V2‐V3).
If ST‐elevation in –aVR was combined with no ST‐elevation in V1 along with no pathologic Q waves, the sensitivity and specificity rose to 32% and 97%, respectively (P<0.001; PPV of 92% and NPV of 58%). When ST‐elevation in –aVR was accompanied by inferior ST‐elevation, the sensitivity and specificity were 14% and 98%, respectively (P=0.001; PPV of 89% and NPV of 52%). An even better specificity (100%) with a lower sensitivity (12%) was reached, in the presence of ST‐elevations in the anteroseptal leads together with ST‐elevation in –aVR (P<0.001; PPV of 100% and NPV of 52%).
On the other hand, STEMI was characterized with ST‐depression in any lead, and more specifically in inferior leads with a sensitivity and specificity of 31% and 88%, respectively (P<0.001; PPV of 72% and NPV of 57%). ST‐elevation in aVR (sensitivity and specificity 31% and 95%, P<0.001; PPV of 85% and NPV of 59%), and ST‐depression in V2, V3, and V4 (sensitivity and specificity 24% and 100%; P<0.001; with PPV of 100% and NPV of 76%) were the most specific ECG patterns directing the diagnosis towards a STEMI versus TTC (Table 4).
After multivariate analysis, the independent diagnostic parameters to differentiate TTC from STEMI in the setting of an ST‐elevation ECG were sex, body mass index, peak troponin, peak creatine kinase levels, and ST‐elevation in –aVR.
TTC Without ST‐Elevation Versus NSTEMI
Eighty‐nine TTC patients without ST‐elevation were then compared to 94 NSTEMI patients. Baseline characteristics are listed in Table S4. NSTEMI patients more often had hypertension, a smoking history, and/or dyslipidemia, but a similar incidence of coronary artery disease as compared to TTC patients' subgroup.
Figure 1 and Table 5 show admission ECG characteristics of TTC without ST‐elevation and patients with NSTEMI. Again, QTc prolongation was more prevalent in the TTC group (56%, n=50 versus 34%, n=32; P=0.005). Similarly to previously analyzed subgroups, heart rate was higher and PQ interval longer in TTC patients, whereas QRS width was comparable between the 2 subgroups.
Table 5.
Baseline ECG Characteristics; Comparison Between NSTE‐TTC and NSTEMI
| NSTE‐TTC | NSTEMI | P Value | |
|---|---|---|---|
| N=89 | N=94 | ||
| Sinus rhythm | 87 (98) | 89 (95) | 0.45 |
| Atrial fibrillation | 2 (2) | 5 (5) | 0.45 |
| Axis | |||
| Normal | 80 (90) | 81 (86) | 0.50 |
| Left | 7 (8) | 12 (13) | 0.34 |
| QTc, msa | 463±38 | 434±38 | <0.001 |
| QT prolongationb | 50 (56) | 32 (34) | 0.005 |
| Heart rate, bpma | 78±18 | 71±17 | 0.004 |
| PQ, msa | 165±32 | 148±49 | 0.008 |
| QRS, msa | 90±15 | 94±19 | 0.14 |
| RR, msa | 802±190 | 874±191 | 0.014 |
| Normal ECG | 28 (32) | 28 (30) | 0.87 |
| ST‐depression (STd) | 13 (15) | 33 (35) | 0.002 |
| STd with no concomitant ST elevation or T wave inversion | 8 (9) | 16 (17) | 0.13 |
| STd inferiorc | 2 (2) | 6 (6) | 0.28 |
| STd laterale | 11 (12) | 20 (21) | 0.12 |
| STd anteroseptale | 0 | 1 (1) | 1 |
| STd anteriorf | 3 (3) | 15 (16) | 0.005 |
| STd in aVR (STe in ‐aVR) | 14 (16) | 1 (1) | <0.001 |
| T wave inversion (Tinv) | 50 (56) | 25 (27) | <0.001 |
| Sum of leads presenting Tinva | 3.04±3.11 | 1.37±2.11 | <0.001 |
| Tinv present in ≥5 leads | 32 (36) | 8 (9) | <0.001 |
| Tinv with no concomitant ST depression | 43 (49) | 24 (26) | 0.002 |
| Tinv inferiorc | 17 (19) | 12 (13) | 0.31 |
| Tinv laterald | 23 (26) | 6 (6) | <0.001 |
| Tinv anteroseptale | 3 (3) | 7 (7) | 0.33 |
| Tinv anteriorf | 23 (26) | 6 (6) | <0.001 |
Depicted are counts, N incidence (%). NSTEMI indicates non ST‐elevation myocardial infarction; NSTE‐TTC, non ST‐elevation Takotsubo cardiomyopathy.
Mean±SD.
QTc ≥440 ms and ≥460 ms for male and female sex, respectively.
More than 2 leads out of 3 in (II‐III‐aVF).
More than 2 leads out of 4 in (I‐aVL‐V5‐V6).
More than 2 leads out of 3 in (V1‐V2‐V3).
More than 4 leads out of 6 in (V1‐V2‐V3‐V4‐V5‐V6).
ST‐depression was overall more prevalent in NSTEMI patients (35%, n=33 versus 15%, n=13; P=0.002), particularly in anterior leads. Here again ST‐elevation in –aVR was characteristic of TTC (16%, n=14 versus 1%, n=1; P<0.001). On the other hand, T‐inversion was also more often present in TTC patients (56%, n=50 versus 27%, n=25; P<0.001) with ≈3 times as many leads involved, and T‐inversion in more than 5 leads in 36% (n=32) of TTC as compared to 9% (n=8) in NSTEMI patients (P<0.001). Moreover, T‐inversion in TTC was more isolated, with no concomitant ST‐depression, and present particularly in anterior and lateral leads (Table 5 and Table S5).
Diagnostic values of combined ECG findings for differentiating TTC from NSTEMI in the setting of non ST‐elevation ECG are shown in Table 4. T‐inversion in more than 5 of any leads had a sensitivity of 36% to diagnose TTC in this particular setting with a specificity of 92% (P<0.001, with PPV of 80% and NPV of 60%). When T‐inversion was present in leads V5 and V6, or I and aVL the sensitivity and specificity became 39% and 90%, respectively (PPV of 80% and NPV of 61%) and 29% and 94%, respectively (PPV of 81% and NPV of 58%), respectively, P<0.001. When combining all these leads, T‐inversion in V5‐V6‐I‐aVL provided a sensitivity and specificity of 17% and 97% for diagnosing TTC rather than NSTEMI (P=0.002; PPV of 83% and NPV of 55%). Here again, ST‐elevation in –aVR was specific for TTC with a sensitivity and specificity of 16% and 99% (P<0.001; PPV of 93% and NPV of 55%), rising to 8% and 100% when adding to it T‐inversion in any lead (P=0.006; PPV of 100% and NPV of 53%). On the other hand, NSTEMI was characterized by isolated ST‐depression with no concomitant T‐inversion in any lead, with a sensitivity and specificity of 25% and 91% (P=0.006; with PPV of 74% and NPV of 53%). When ST‐depression was present in anterior leads and particularly in V2 and V3, NSTEMI was likely present with a sensitivity and specificity of 16% and 97% (P=0.005; PPV of 83% and NPV of 52%) and 11% and 99% (P=0.01; PPV of 91% and NPV of 51%), respectively.
Receiver Operating Characteristic (ROC) curves showing the diagnostic accuracy of the different ECG parameters in identifying TTC are shown in Figures S1 through S4.
After multivariate analysis, the independent diagnostic parameters to differentiate TTC from NSTEMI in the setting of a non ST‐elevation ECG were sex, body mass index, peak CK levels, and left ventricular ejection fraction.
Discussion
This is the largest study defining specific ECG criteria to differentiate between TTC and MI. Our aim was to generate simple and specific ECG criteria that are helpful in the differential diagnosis of TTC and acute MI in the emergency setting. Due to a different management, the acute recognition of TTC is clinically important, but usually a challenging task given the similarities in the clinical presentation, ECG, and biomarker characteristics of the 2 entities.1, 6, 7, 8 Eventually, emergency coronary angiography and ventriculography are required to confirm the underlying diagnosis of both conditions. The early differentiation between these 2 entities has a potential benefit regarding the timing of the coronary angiography and the antiplatelet/anticoagulation regimen to be used, especially in patients with multiple comorbidities such as those presenting after physical stressors such as subarachnoid hemorrhage or hemorrhagic stroke, known to be typical triggers for TTC.1
Twelve‐lead surface ECG on admission is a simple diagnostic tool that is available in a primary emergency setting. Although several studies have proposed ECG characteristics to differentiate between TTC and acute MI,9, 10, 11, 12, 13, 14, 15 data are still insufficient, partially due to limited sample size and the heterogeneity of study designs. Most of these studies compared TTC only to anterior MI. However, admission ECGs of TTC patients can vary, and the degree of ST‐elevation, ST‐depression, and T‐inversion is considerably different (11–100%). Some patients may even present with a normal ECG.3, 5, 17, 18 This makes it more clinically relevant to define ECG findings specific to TTC compared to all MI patients, where the differential diagnosis is a question. In the current study, we compared not only admission ECGs between TTC and acute MI but we further dichotomized into TTC with ST‐elevation versus STEMI and TTC without ST‐elevation versus NSTEMI, and we defined specific ECG changes that differentiate between both entities. Moreover, we considered ST‐segment deviation at the J point as recommended by the third universal definition of MI,20 since this can affect the presence or absence of ST‐elevation. We also classified ECG leads by localization‐based ECG criteria (anterior, inferior, and lateral), which are easy to apply in the clinical setting. The patients with TTC in our study were predominantly postmenopausal women (91% with mean age of 65 years) and had lower rates of smoking history, dyslipidemia, and diabetes compared to MI patients, in accordance with previous publications.8, 22 Our results confirmed the heterogeneity of ECG at the time of presentation in both TTC and MI, with a comparable rate of ST‐elevation, as well as a similar rate of normal ECGs, which supports the choice of our study design.
In our study cohort with TTC, normal QRS axis was the predominant feature, whereas there was a trend for left axis deviation in the ST‐elevation subgroup, in accordance with previously reported findings.23 This observation is likely due to severe apical ballooning and alterations in the cardiac conduction system.23 QTc interval was described to be greater in patients with TTC, especially in the subacute phase,17, 24 probably reflecting a stunned myocardium. In our study, QTc prolongation was more prevalent in TTC patients, particularly in the subgroup without ST‐elevation. Abnormal Q waves occurred in only 10% of TTC patients, which was not significantly different from MI patients (15%). The rate of abnormal Q waves in TTC was previously reported to be 6% to 85%.18 Q waves often tend to regress afterwards along with R‐wave reappearance, suggesting electrical stunning, even when Q‐waves appear in the acute phase in TTC.
Although the ability of ECG to reliably differentiate TTC from MI was questioned in some studies,5, 14, 17 our data showed that ECG criteria could in fact distinguish between the 2 entities. In our study, when ST‐elevation was present in TTC patients, its distribution differed widely, which was consistent with previous studies.11, 12, 14, 15 In fact, in TTC, ST‐elevation was diffusely prevalent, particularly in anteroseptal and anterior leads, and occurred more in commonly in –aVR. The lead –aVR (+30°), equivalent to the inverse lead of aVR, bridges the gap between lead I (0°) and lead II (+60°)25 and faces the apical and inferolateral regions.18 Moreover, the diffuse ST‐elevation in TTC is thought to reflect the extensive distribution of wall‐motion abnormalities centered around the apex, extending beyond the perfusion territory of any single coronary artery,18 which gives the possibility to establish a differential diagnosis based on ECG criteria. In contrast, ST‐elevation in V1 and inferior leads was less prevalent in TTC patients. The lead V1 points out to the right ventricular anterior region, as well as the right paraseptal region,26 where TTC rarely extends,27, 28 whereas TTC possibly more commonly involves the posterolateral region.27, 29
In our study, ST‐depression in inferior leads was a rare finding in TTC patients. In the context of STEMI, the presence of ST‐depression in inferior leads suggests left anterior descending coronary artery occlusion proximal to the first septal branch in opposite to mid or distal left anterior descending occlusion.30 The absence of reciprocal changes in inferior leads in TTC can be explained by the fact that the vector of injuries of opposing walls cancel each other out; simultaneous ischemia in both lateral and inferior walls tends to attenuate the ST‐segment changes in their respective leads.10 Another observation was the presence of more diffuse T‐inversion in TTC patients, especially in anterior and lateral leads, which was consistent with previous studies.13, 16, 31 These repolarization changes were also documented after reperfusion of prolonged myocardial ischemia and were referred to stunned as well as viable but sympathetically denervated myocardium.32, 33
ECG criteria for the differential diagnosis of TTC proposed in previously published studies9, 10, 11, 12, 13, 14, 15 are summarized in Table 6. The results of re‐analysis of the same criteria with the same subgroups of patients from our data are also given in the table. This analysis showed similarities and confirmed many of the previously proposed criteria. However, when the results became inconsistent, this may be due to the effect of the sample size and the delay between onset of symptoms and ECG recordings. It is important to take into consideration that our ECG findings were obtained within 12 hours from the onset of symptoms and ST‐segment changes were measured at the J point, as mentioned previously.
Table 6.
Review of Proposed Differentiating Electrocardiographic Criteria From Major Studies
| Reference | Study Description | Onset of Pain | No. of Patients | Origin of ST‐Segment | ECG Criteria for Identifying ACS/TTC | Sensitivity | Specificity | Testing of Proposed Criteria in Our Cohorta | P Value | |
|---|---|---|---|---|---|---|---|---|---|---|
| Sensitivity | Specificity | |||||||||
| Mugnai et al Journal of Electrocardiology 201515 | TTC vs AMI | <12 h |
27 (STEMI) 27 (TTC) |
J point | Lack of STe in lead V1, absence of abnormal Q waves and STd in aVR | 40 | 95 | 25 | 98.1 | <0.001 |
| Parkkonen et al Journal of Electrocardiology 201414 | TTC vs AMI | <24 h |
96 (AMI) 48 (apical TTC) 9 (midventricular TTC) |
J point | Lack of STe in lead V1 and STe <2 mm in V2 | 63 | 93 | 57.5 | 100 | <0.001 |
| Jim et al Heart Vessels 200910 | TTC vs AMI | <12 h |
27 (AMI) 8 (TTC) |
80 ms from J point | STe in lead II >1 mm | 62.5 | 92.6 | 12.5 | 84.6 | 0.644 |
| Tamura et al Am J Cardiol 201112 | TTC vs AMI | <6 h |
280 (AMI) 62 (TTC) |
80 ms from J point | STe >1 mm in >1 V3‐V5 and no STd >1 mm in V1 | 74.2 | 80.6 | 36.5 | 73.1 | 0.252 |
| Guerra et al Am J Cardiol 201313 | TTC vs ACS | <12 h |
45 (ACS) 45 (TTC) |
J‐point | ∑STe V4‐V6/∑STe V1‐V3 | Non discriminative | 64.3 | 21.5 | 0.002 | |
| Kosuge et al JACC 201011 | TTC vs AMI | <6 |
342 (AMI) 33 (TTC) |
80 ms from J‐point | STd in aVR, and no STe in V1 | 91 | 95 | 28 | 96.2 | <0.001 |
| Ogura et al Circ J 20039 | TTC vs AMI |
13 (AMI) 13 (TTC) |
80 ms from J‐point | Absence of reciprocal changes | 100 | 69 | 92.5 | 44.2 | <0.001 | |
| ∑STe V4‐V6/∑STe V1‐V3 ≥1 | 80 | 77 | 64.3 | 73.1 | <0.001 | |||||
| Combined criteria | 100 | 61.3 | 86.5 | <0.001 | ||||||
ACS indicates acute coronary syndromes; AMI, anterior myocardial infarction; STd, ST‐segment depression; STe, ST‐segment elevation; STEMI, ST‐segment elevation myocardial infarction; TTC, Takotsubo cardiomyopathy.
Onset of pain <12 h, origin of ST‐segment J point.
Moreover, in order to determine the most specific criteria differentiating TTC from MI, we dichotomized our study population into 2 subgroups of patients based on the presence or absence of ST‐elevation on the admission ECG. The rationale was to reach higher sensitivity and specificity by selecting subgroups based on electrocardiographic changes, considering the variability of ECG patterns in TTC patients discussed above and to be able afterwards to create a practical tool for cardiologists in the emergency setting to categorize their patients and look for specific ECG criteria that could help in the differential diagnosis.
Furthermore, we combined the most differentiating criteria and defined sensitivity and specificity as well as the correspondent NPV and PPV (Table 4, Figure 2). Interestingly, in the ST‐elevation setting, ST‐elevation in –aVR when combined with ST‐elevation in anteroseptal leads was 100% specific for TTC versus STEMI with PPV of 100%, but NPV of 52% and low sensitivity of 12%. In contrast, ST‐depression in V2, V3, and V4 was 100% specific for STEMI with 100% PPV, 72% NPV, and sensitivity of 24%. On the other hand, in the non ST‐elevation setting, ST‐elevation in –aVR combined with concomitant T‐inversion in any lead was again 100% specific of TTC with 100% PPV, but 53% NPV and low sensitivity of 8%. The low sensitivity is due to the heterogeneity of ECG presentation, described above, as well as the fact that we compared all TTC patients to all acute MI patients including STEMI and NSTEMI, as seen in daily clinical practice.
Figure 2.
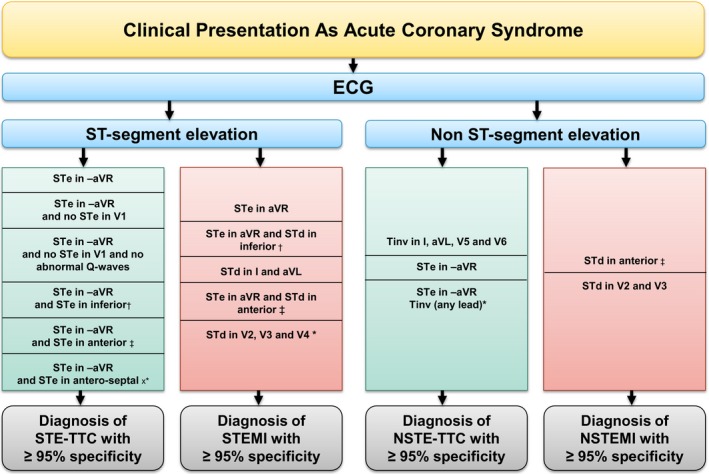
Algorithm favoring the diagnosis of Takotsubo based on highly specific admission ECG criteria in the setting of acute coronary syndrome (STEMI and NSTEMI). NSTEMI indicates non ST‐elevation myocardial infarction; STEMI, ST‐elevation myocardial infarction; STe, ST‐segment elevation; STd, ST‐segment depression; TTC, Takotsubo cardiomyopathy. *100% specificity and 100% positive predictive value; †More than 2 leads out of 3 in II‐III‐aVF; ‡More than 4 leads out of 6 in (V1‐V2‐V3‐V4‐V5‐V6); xMore than 2 leads out of 3 in (V1‐V2‐V3).
The flow chart in Figure 2 is a guide for the clinician with admission ECG in hand in an acute setting. It shows highly specific ECG criteria, with a high PPV, helping in establishing the differential diagnosis. Figure 3 shows ECG examples for the most specific combination of criteria in each group of patients.
Figure 3.
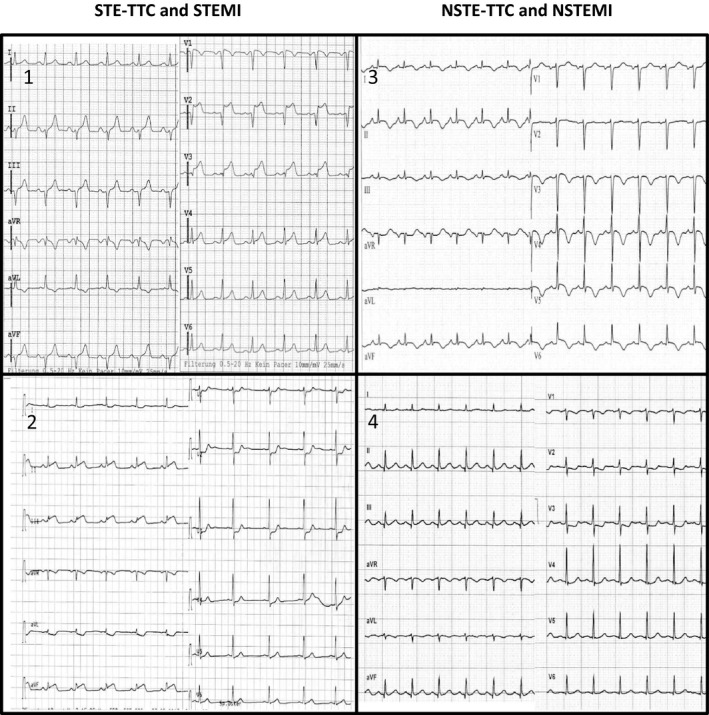
ECG examples for the most specific combination of criteria in each group of patients. Group 1: Takotsubo with ST‐elevation (STE‐TTC): STe in –aVR and STe in anteroseptal lead; Group 2: ST‐elevation myocardial infarction (STEMI): STd in V2, V3 and V4 (among others); Group 3: Takotsubo without ST‐elevation (NSTE‐TTC): STe in –aVR and Tinv (any lead); Group 4: Non ST‐elevation myocardial infarction (NSTEMI): STd in V2, V3.
Limitations
Despite the large sample size and having the strengths of a multicenter registry, our study is limited by its retrospective design. Furthermore, we did not take into consideration the difference between typical and atypical forms of TTC, as our primary aim was to establish simple ECG criteria to differentiate TTC from acute MI in an acute setting.
In conclusion, ECG on admission proves to be helpful in differentiating between TTC and acute MI with high specificity and PPV.
Appendix
InterTAK Collaborators for this Study
Johanna Diekmann; Victoria L. Cammann and Milosz Jaguszewski, MD (University Hospital Zurich, University Heart Center, Department of Cardiology, Zurich, Switzerland); Wolfgang Dichtl, MD, PhD and Wolfgang M. Franz, MD (University Hospital for Internal Medicine III (Cardiology and Angiology), Medical University Innsbruck, Innsbruck, Austria); Marcin Fijalkowski, MD (First Department of Cardiology, Medical University of Gdansk, Gdansk, Poland); Grzegorz Opolski, MD (Department of Cardiology, Medical University of Warsaw, Warsaw, Poland); Jennifer Franke, MD and Hugo A. Katus, MD (Department of Cardiology, Heidelberg University Hospital, Heidelberg, Germany); Guido Michels, MD and Roman Pfister, MD (Department of Internal Medicine III, Heart Center University of Cologne, Cologne, Germany), and Florim Cuculi, MD (Heart Centre Lucerne, Luzerner Kantonsspital, Lucerne, Switzerland).
Sources of Funding
Frangieh was supported by an Excellent Scholar Grant from the Swiss Federal Government and in part by the Foundation for Cardiovascular Research, Zurich, Switzerland. Obeid was supported in part by the Foundation for Cardiovascular Research, Zurich, Switzerland. Templin has received research grants from the Mach‐Gaensslen Foundation, Olten Heart Foundation, Prof. Otto‐Beisheim‐Foundation, and Swiss Heart Foundation. Ghadri has received a research grant from the Olten Heart Foundation and a research grant “Filling the Gap” from the University of Zurich.
Disclosures
None.
Supporting information
Data S1. Supplemental methods.
Table S1. Baseline Electrocardiographic Changes in TTC and MI Patients
Table S2. Baseline Characteristics; Comparison Between TTC With ST‐Elevation and STEMI
Table S3. Baseline Electrocardiographic Changes in STE‐TTC and STEMI Patients
Table S4. Baseline Characteristics; Comparison Between TTC Without ST‐Elevation and NSTEMI
Table S5. Baseline Electrocardiographic Changes in TTC Without ST‐Elevation and NSTEMI Patients
Figure S1. Receiver operating characteristic (ROC) curves showing the diagnostic accuracy of different ECG parameters to identify TTC in the setting of an ST‐elevation ECG.
Figure S2. Receiver operating characteristic (ROC) curves showing the diagnostic accuracy of different ECG localization parameters to identify TTC in the setting of an ST‐elevation ECG.
Figure S3. Receiver operating characteristic (ROC) curves showing the diagnostic accuracy of different ECG parameters to identify TTC in the setting of a non ST‐elevation ECG.
Figure S4. Receiver operating characteristic (ROC) curves showing the diagnostic accuracy of different ECG localization parameters to identify TTC in the setting of a non ST‐elevation ECG.
(J Am Heart Assoc. 2016;5:e003418 doi: 10.1161/JAHA.116.003418)
References
- 1. Templin C, Ghadri JR, Diekmann J, Napp LC, Bataiosu DR, Jaguszewski M, Cammann VL, Sarcon A, Geyer V, Neumann CA, Seifert B, Hellermann J, Schwyzer M, Eisenhardt K, Jenewein J, Franke J, Katus HA, Burgdorf C, Schunkert H, Moeller C, Thiele H, Bauersachs J, Tschope C, Schultheiss HP, Laney CA, Rajan L, Michels G, Pfister R, Ukena C, Bohm M, Erbel R, Cuneo A, Kuck KH, Jacobshagen C, Hasenfuss G, Karakas M, Koenig W, Rottbauer W, Said SM, Braun‐Dullaeus RC, Cuculi F, Banning A, Fischer TA, Vasankari T, Airaksinen KE, Fijalkowski M, Rynkiewicz A, Pawlak M, Opolski G, Dworakowski R, MacCarthy P, Kaiser C, Osswald S, Galiuto L, Crea F, Dichtl W, Franz WM, Empen K, Felix SB, Delmas C, Lairez O, Erne P, Bax JJ, Ford I, Ruschitzka F, Prasad A, Luscher TF. Clinical features and outcomes of Takotsubo (stress) cardiomyopathy. N Engl J Med. 2015;373:929–938. [DOI] [PubMed] [Google Scholar]
- 2. Bybee KA, Kara T, Prasad A, Lerman A, Barsness GW, Wright RS, Rihal CS. Systematic review: transient left ventricular apical ballooning: a syndrome that mimics ST‐segment elevation myocardial infarction. Ann Intern Med. 2004;141:858–865. [DOI] [PubMed] [Google Scholar]
- 3. Gianni M, Dentali F, Grandi AM, Sumner G, Hiralal R, Lonn E. Apical ballooning syndrome or Takotsubo cardiomyopathy: a systematic review. Eur Heart J. 2006;27:1523–1529. [DOI] [PubMed] [Google Scholar]
- 4. Akashi YJ, Goldstein DS, Barbaro G, Ueyama T. Takotsubo cardiomyopathy: a new form of acute, reversible heart failure. Circulation. 2008;118:2754–2762. [DOI] [PMC free article] [PubMed] [Google Scholar]
- 5. Pilgrim TM, Wyss TR. Takotsubo cardiomyopathy or transient left ventricular apical ballooning syndrome: a systematic review. Int J Cardiol. 2008;124:283–292. [DOI] [PubMed] [Google Scholar]
- 6. Ghadri JR, Ruschitzka F, Luscher TF, Templin C. Takotsubo cardiomyopathy: still much more to learn. Heart. 2014;100:1804–1812. [DOI] [PubMed] [Google Scholar]
- 7. Scantlebury DC, Prasad A. Diagnosis of Takotsubo cardiomyopathy. Circ J. 2014;78:2129–2139. [DOI] [PubMed] [Google Scholar]
- 8. Sharkey SW, Windenburg DC, Lesser JR, Maron MS, Hauser RG, Lesser JN, Haas TS, Hodges JS, Maron BJ. Natural history and expansive clinical profile of stress (tako‐tsubo) cardiomyopathy. J Am Coll Cardiol. 2010;55:333–341. [DOI] [PubMed] [Google Scholar]
- 9. Ogura R, Hiasa Y, Takahashi T, Yamaguchi K, Fujiwara K, Ohara Y, Nada T, Ogata T, Kusunoki K, Yuba K, Hosokawa S, Kishi K, Ohtani R. Specific findings of the standard 12‐lead ECG in patients with ‘Takotsubo’ cardiomyopathy: comparison with the findings of acute anterior myocardial infarction. Circ J. 2003;67:687–690. [DOI] [PubMed] [Google Scholar]
- 10. Jim MH, Chan AO, Tsui PT, Lau ST, Siu CW, Chow WH, Lau CP. A new ECG criterion to identify Takotsubo cardiomyopathy from anterior myocardial infarction: role of inferior leads. Heart Vessels. 2009;24:124–130. [DOI] [PubMed] [Google Scholar]
- 11. Kosuge M, Ebina T, Hibi K, Morita S, Okuda J, Iwahashi N, Tsukahara K, Nakachi T, Kiyokuni M, Ishikawa T, Umemura S, Kimura K. Simple and accurate electrocardiographic criteria to differentiate Takotsubo cardiomyopathy from anterior acute myocardial infarction. J Am Coll Cardiol. 2010;55:2514–2516. [DOI] [PubMed] [Google Scholar]
- 12. Tamura A, Watanabe T, Ishihara M, Ando S, Naono S, Zaizen H, Abe Y, Yano S, Shinozaki K, Kotoku M, Momii H, Kadokami T, Kadota J. A new electrocardiographic criterion to differentiate between Takotsubo cardiomyopathy and anterior wall ST‐segment elevation acute myocardial infarction. Am J Cardiol. 2011;108:630–633. [DOI] [PubMed] [Google Scholar]
- 13. Guerra F, Rrapaj E, Pongetti G, Fabbrizioli A, Pelizzoni V, Giannini I, Aschieri D, Costantini C, Capucci A. Differences and similarities of repolarization patterns during hospitalization for Takotsubo cardiomyopathy and acute coronary syndrome. Am J Cardiol. 2013;112:1720–1724. [DOI] [PubMed] [Google Scholar]
- 14. Parkkonen O, Allonen J, Vaara S, Viitasalo M, Nieminen MS, Sinisalo J. Differences in ST‐elevation and T‐wave amplitudes do not reliably differentiate Takotsubo cardiomyopathy from acute anterior myocardial infarction. J Electrocardiol. 2014;47:692–699. [DOI] [PubMed] [Google Scholar]
- 15. Mugnai G, Pasqualin G, Benfari G, Bertagnolli L, Mugnai F, Vassanelli F, Marchese G, Pesarini G, Menegatti G. Acute electrocardiographic differences between Takotsubo cardiomyopathy and anterior ST elevation myocardial infarction. J Electrocardiol. 2015;48:79–85. [DOI] [PubMed] [Google Scholar]
- 16. Looi JL, Wong CW, Lee M, Khan A, Webster M, Kerr AJ. Usefulness of ECG to differentiate Takotsubo cardiomyopathy from acute coronary syndrome. Int J Cardiol. 2015;199:132–140. [DOI] [PubMed] [Google Scholar]
- 17. Sharkey SW, Lesser JR, Menon M, Parpart M, Maron MS, Maron BJ. Spectrum and significance of electrocardiographic patterns, troponin levels, and thrombolysis in myocardial infarction frame count in patients with stress (tako‐tsubo) cardiomyopathy and comparison to those in patients with ST‐elevation anterior wall myocardial infarction. Am J Cardiol. 2008;101:1723–1728. [DOI] [PubMed] [Google Scholar]
- 18. Kosuge M, Kimura K. Electrocardiographic findings of Takotsubo cardiomyopathy as compared with those of anterior acute myocardial infarction. J Electrocardiol. 2014;47:684–689. [DOI] [PubMed] [Google Scholar]
- 19. Prasad A, Lerman A, Rihal CS. Apical ballooning syndrome (Tako‐Tsubo or stress cardiomyopathy): a mimic of acute myocardial infarction. Am Heart J. 2008;155:408–417. [DOI] [PubMed] [Google Scholar]
- 20. Thygesen K, Alpert JS, Jaffe AS, Simoons ML, Chaitman BR, White HD; Writing Group on the Joint ESCAAHAWHFTFftUDoMI , Thygesen K, Alpert JS, White HD, Jaffe AS, Katus HA, Apple FS, Lindahl B, Morrow DA, Chaitman BA, Clemmensen PM, Johanson P, Hod H, Underwood R, Bax JJ, Bonow RO, Pinto F, Gibbons RJ, Fox KA, Atar D, Newby LK, Galvani M, Hamm CW, Uretsky BF, Steg PG, Wijns W, Bassand JP, Menasche P, Ravkilde J, Ohman EM, Antman EM, Wallentin LC, Armstrong PW, Simoons ML, Januzzi JL, Nieminen MS, Gheorghiade M, Filippatos G, Luepker RV, Fortmann SP, Rosamond WD, Levy D, Wood D, Smith SC, Hu D, Lopez‐Sendon JL, Robertson RM, Weaver D, Tendera M, Bove AA, Parkhomenko AN, Vasilieva EJ, Mendis S; Guidelines ESCCfP . Third universal definition of myocardial infarction. Eur Heart J. 2012;33:2551–2567. [DOI] [PubMed] [Google Scholar]
- 21. Birnbaum Y, Drew BJ. The electrocardiogram in ST elevation acute myocardial infarction: correlation with coronary anatomy and prognosis. Postgrad Med J. 2003;79:490–504. [DOI] [PMC free article] [PubMed] [Google Scholar]
- 22. Schneider B, Athanasiadis A, Stollberger C, Pistner W, Schwab J, Gottwald U, Schoeller R, Gerecke B, Hoffmann E, Wegner C, Sechtem U. Gender differences in the manifestation of tako‐tsubo cardiomyopathy. Int J Cardiol. 2013;166:584–588. [DOI] [PubMed] [Google Scholar]
- 23. Ghadri JR, Saguner AM, Templin C, Brunckhorst C. [CME ECG 42. Chest pain. Takotsubo cardiomyopathy]. Praxis. 2013;102:1207–1209. [DOI] [PubMed] [Google Scholar]
- 24. Kurisu S, Inoue I, Kawagoe T, Ishihara M, Shimatani Y, Nakamura S, Yoshida M, Mitsuba N, Hata T, Sato H. Time course of electrocardiographic changes in patients with tako‐tsubo syndrome: comparison with acute myocardial infarction with minimal enzymatic release. Circ J. 2004;68:77–81. [DOI] [PubMed] [Google Scholar]
- 25. Wagner GS, Macfarlane P, Wellens H, Josephson M, Gorgels A, Mirvis DM, Pahlm O, Surawicz B, Kligfield P, Childers R, Gettes LS, Bailey JJ, Deal BJ, Gorgels A, Hancock EW, Kors JA, Mason JW, Okin P, Rautaharju PM, van Herpen G; American Heart Association E, Arrhythmias Committee CoCC, American College of Cardiology F and Heart Rhythm S . AHA/ACCF/HRS recommendations for the standardization and interpretation of the electrocardiogram: part VI: acute ischemia/infarction: a scientific statement from the American Heart Association Electrocardiography and Arrhythmias Committee, Council on Clinical Cardiology; the American College of Cardiology Foundation; and the Heart Rhythm Society. Endorsed by the International Society for Computerized Electrocardiology. J Am Coll Cardiol. 2009;53:1003–1011. [DOI] [PubMed] [Google Scholar]
- 26. Ben‐Gal T, Sclarovsky S, Herz I, Strasberg B, Zlotikamien B, Sulkes J, Birnbaum Y, Wagner GS, Sagie A. Importance of the conal branch of the right coronary artery in patients with acute anterior wall myocardial infarction: electrocardiographic and angiographic correlation. J Am Coll Cardiol. 1997;29:506–511. [DOI] [PubMed] [Google Scholar]
- 27. Bybee KA, Prasad A. Stress‐related cardiomyopathy syndromes. Circulation. 2008;118:397–409. [DOI] [PubMed] [Google Scholar]
- 28. Eitel I, von Knobelsdorff‐Brenkenhoff F, Bernhardt P, Carbone I, Muellerleile K, Aldrovandi A, Francone M, Desch S, Gutberlet M, Strohm O, Schuler G, Schulz‐Menger J, Thiele H, Friedrich MG. Clinical characteristics and cardiovascular magnetic resonance findings in stress (Takotsubo) cardiomyopathy. JAMA. 2011;306:277–286. [DOI] [PubMed] [Google Scholar]
- 29. Patel SM, Lennon RJ, Prasad A. Regional wall motion abnormality in apical ballooning syndrome (Takotsubo/stress cardiomyopathy): importance of biplane left ventriculography for differentiating from spontaneously aborted anterior myocardial infarction. Int J Cardiovasc Imaging. 2012;28:687–694. [DOI] [PubMed] [Google Scholar]
- 30. Engelen DJ, Gorgels AP, Cheriex EC, De Muinck ED, Ophuis AJ, Dassen WR, Vainer J, van Ommen VG, Wellens HJ. Value of the electrocardiogram in localizing the occlusion site in the left anterior descending coronary artery in acute anterior myocardial infarction. J Am Coll Cardiol. 1999;34:389–395. [DOI] [PubMed] [Google Scholar]
- 31. Kosuge M, Ebina T, Hibi K, Tsukahara K, Iwahashi N, Gohbara M, Matsuzawa Y, Okada K, Morita S, Umemura S, Kimura K. Differences in negative T waves among acute coronary syndrome, acute pulmonary embolism, and Takotsubo cardiomyopathy. Eur Heart J Acute Cardiovasc Care. 2012;1:349–357. [DOI] [PMC free article] [PubMed] [Google Scholar]
- 32. Matetzky S, Barabash GI, Shahar A, Rabinowitz B, Rath S, Zahav YH, Agranat O, Kaplinsky E, Hod H. Early T wave inversion after thrombolytic therapy predicts better coronary perfusion: clinical and angiographic study. J Am Coll Cardiol. 1994;24:378–383. [DOI] [PubMed] [Google Scholar]
- 33. Bateman TM, Czer LS, Gray RJ, Maddahi J, Raymond MJ, Geft IL, Ganz W, Shah PK, Berman DS. Transient pathologic Q waves during acute ischemic events: an electrocardiographic correlate of stunned but viable myocardium. Am Heart J. 1983;106:1421–1426. [DOI] [PubMed] [Google Scholar]
Associated Data
This section collects any data citations, data availability statements, or supplementary materials included in this article.
Supplementary Materials
Data S1. Supplemental methods.
Table S1. Baseline Electrocardiographic Changes in TTC and MI Patients
Table S2. Baseline Characteristics; Comparison Between TTC With ST‐Elevation and STEMI
Table S3. Baseline Electrocardiographic Changes in STE‐TTC and STEMI Patients
Table S4. Baseline Characteristics; Comparison Between TTC Without ST‐Elevation and NSTEMI
Table S5. Baseline Electrocardiographic Changes in TTC Without ST‐Elevation and NSTEMI Patients
Figure S1. Receiver operating characteristic (ROC) curves showing the diagnostic accuracy of different ECG parameters to identify TTC in the setting of an ST‐elevation ECG.
Figure S2. Receiver operating characteristic (ROC) curves showing the diagnostic accuracy of different ECG localization parameters to identify TTC in the setting of an ST‐elevation ECG.
Figure S3. Receiver operating characteristic (ROC) curves showing the diagnostic accuracy of different ECG parameters to identify TTC in the setting of a non ST‐elevation ECG.
Figure S4. Receiver operating characteristic (ROC) curves showing the diagnostic accuracy of different ECG localization parameters to identify TTC in the setting of a non ST‐elevation ECG.