

Abstract
Background
Carotid intima–media thickness (cIMT) is a noninvasive marker of cardiovascular risk. The cIMT may be increased in patients with harmonisation, but little is known regarding the functional form of the association between blood pressure (BP) and cIMT in hypertensive and nonhypertensive persons. We aimed to define the shape of the association between BP and cIMT.
Methods and Results
We studied cIMT and ambulatory BP monitoring data from a single‐center, cross‐sectional, population‐based study involving 696 adult participants from the STANISLAS cohort, a familial longitudinal cohort from the Nancy region of France. Participants with a history of hypertension were more likely to have a cIMT >900 μm and had higher mean cIMT (both P<0.001). The risk of cIMT >900 μm increased linearly with higher 24‐hour and daytime systolic BP in participants both with and without history of hypertension. The relationship between systolic BP and the risk of cIMT >900 μm was not dependent on hypertension status (all P for interaction >0.10). In multivariable analysis adjusted on cardiovascular risk factors, each 5‐mm Hg increase in systolic BP was associated with an 8‐μm increase in cIMT (β=8.249 [95% CI 2.490–14.008], P=0.005). In contrast, the association between diastolic BP and cIMT was weaker and not significant.
Conclusions
Systolic BP is linearly and continuously associated with higher cIMT in both hypertensive and nonhypertensive persons, suggesting a detrimental effect of BP on the vascular tree prior to overt hypertension. Similarly, it suggests a detrimental effect of BP at the higher end of the normal range in treated hypertensive patients.
Clinical Trial Registration
URL: https://www.clinicaltrials.gov/. Unique identifier: NCT01391442.
Keywords: ambulatory blood pressure monitoring, hypertension, intima–media thickness, linear associations
Subject Categories: Clinical Studies, Cardiovascular Disease, Hypertension, Ultrasound
Introduction
Carotid intima–media thickness (cIMT) measured by ultrasound is a noninvasive, safe, inexpensive, reproducible, and well‐validated surrogate marker of early atherosclerosis, vascular aging, and adaptive response to an increased hemodynamic load.1, 2, 3, 4 Increased cIMT is independently associated with future cardiovascular events.5, 6, 7 This relationship has promoted the use of cIMT in pathophysiological studies and clinical trials, as either a secondary end point or a surrogate marker of risk for cardiovascular events.8
It has also been noted that cIMT increases in participants with a history of hypertension (a major risk factor for cardiovascular events),9, 10, 11, 12 reflecting the vascular damage caused by this condition. Evidence is scarce, however, regarding the association between blood pressure (BP) and cIMT in both hypertensive and nonhypertensive persons. An association of higher BP with higher cIMT, even in nonhypertensive patients, would support identification of early vascular damage using cIMT prior to overt hypertension—an aspect of noteworthy clinical implications. To identify whether a BP cutoff for increased cIMT exists or if BP is linearly associated with increased cIMT, the functional form of the association between BP and cIMT needs to be evaluated.
We intended to determine whether BP was linearly (or nonlinearly) associated with cIMT in participants with and without hypertension.
Methods
Study Population
The STANISLAS cohort is a single‐center familial longitudinal cohort composed of 1006 families (4295 participants) from the Nancy region of France who were recruited during 1993–1995 at the Center for Preventive Medicine. This cohort was established with the primary objective of investigating gene–gene and gene–environment interactions in the field of cardiovascular diseases. The families were deemed healthy and free of declared acute and/or chronic illness so as to assess the effect of genetics on the variability of intermediate phenotypes on the transition toward pathology.
From 2011 to 2015 onward, 1218 survivors of the original cohort underwent their fourth examination at our department, as described previously.13 For the present study, 696 adult participants (ie, persons with ≥18 years and cIMT measurements) were included (Figure 1).
Figure 1.
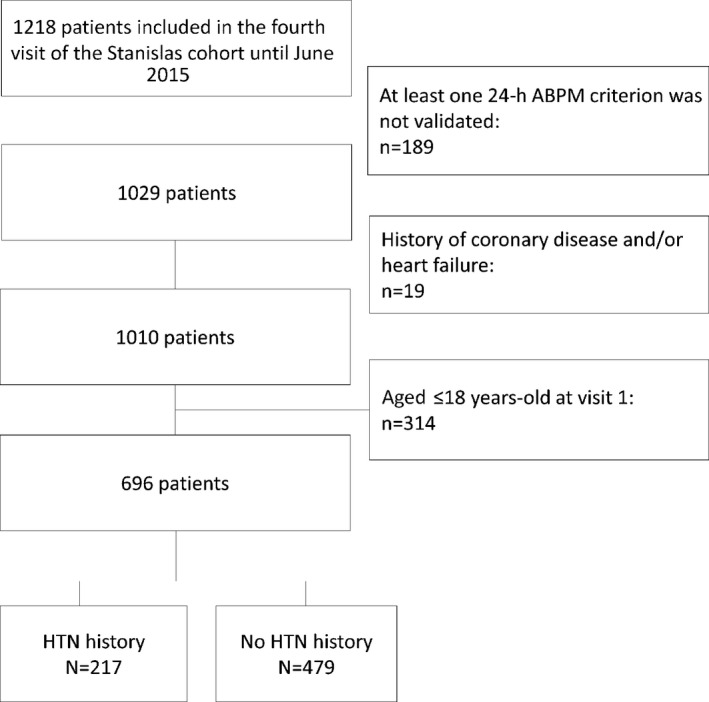
Study flowchart. ABPM indicates ambulatory blood pressure measurement; HTN, hypertension.
The research protocol was approved by the local ethics committee in Nancy, France, and all study participants gave written informed consent to participate. The informed written consent was approved previously by the local ethics committee (ClinicalTrials.gov identifier NCT01391442).
Study Design
In this cross‐sectional study, all participants were scheduled to attend the Centre d'Investigation Clinique Plurithématique Pierre Drouin at Nancy Hospital Center at 8 am after a 12‐ to 14‐hour fast. Blood samples were taken to measure glucose and cholesterol.
Medical history, medications, anthropometric parameters (body mass index [BMI] was calculated from height and weight [in kg/m2]), BP, pulse‐wave velocity, and cIMT were also recorded.
Carotid Intima–Media Thickness
To measure the cIMT, a B‐mode ultrasound examination of the right common carotid artery was performed by experienced sonographers. The investigations were performed in a controlled environment after 10 minutes rest in supine position. IMT was measured by an echo tracking system (Wall Track System; Pie Medical) on the right common carotid artery at 1 to 2 cm below the carotid bifurcation. The Wall Track System measures the parameters in 2 dimensions on 1 radiofrequency line perpendicular to the artery (7.5 MHz probe). The cIMT was assessed at the far wall. The retained value was the mean of 4 measurements.3, 8, 14, 15 The interobserver agreement of IMT assessment was analyzed by intraclass correlation coefficients and was classified as excellent (intraclass correlation coefficient >0.75) for all operators (intraclass correlation coefficients 0.870–0.919). The mean absolute and relative difference compared with a senior operator was <5% for all operators.
Blood Pressure
Office BP was measured 3 times in all participants, at 1‐minute intervals, using an electronic sphygmomanometer after the participant had rested for at least 10 minutes. Office BP was calculated as the mean of the 3 measurements.
All participants underwent a 24‐hour recording of ambulatory BP (ABP) using the Spacelabs 90207 ambulatory monitor (Spacelabs Medical). The monitoring cuff was placed around the participant's nondominant arm. The BP system was programmed to measure every 15 minutes from 6 am to 10 pm and every 30 minutes from 10 pm to 6 am. Self‐reported sleep–wake times have been used to divide ABP monitoring data into daytime and nocturnal periods. The BP indices were calculated from 24‐hour, daytime, and nighttime measurements. Furthermore, participants had to complete a diary describing their main daily activities (eg, eat, sleep) and were asked to avoid excessive exercise during the 24‐hour recording. Central reading of the recordings was performed by a trained technician blinded from participant clinical features. Data were considered for further analysis if they met the following criteria: The recording lasted ≥24 hours, ≥70% of the expected number of readings were available, the data were not missing for >2 consecutive hourly intervals, and ≥2 valid measurements were obtained per hour.16
Definition of hypertension history was based on assistant physician registries and/or ongoing treatment for hypertension. Participants without these criteria were considered to have no history of hypertension.
Statistical Methods
Proportions were compared using chi‐square tests and were expressed as number (proportion as percentage). Continuous variables were expressed as mean±SD or median (interquartile range [IQR]) and compared using a t test or Mann–Whitney tests, according to the normality of the variables.
We focused on the outcome of cIMT, either continuous or dichotomized with a cutoff of 900 μm, a value that has been defined as definitely abnormal.17
Logistic (for dichotomous cIMT) and linear (for continuous cIMT) regressions were performed to assess the associations between the dependent variable (cIMT) and independent variables (BP, age, sex, total cholesterol, smoking status, glycemia, and BMI). To assess the detailed influence of BP in cIMT measurements, we performed 3 different models: 1 unadjusted for BP, 1 adjusted for 24‐hour systolic BP (SBP), and 1 adjusted for 24‐hour diastolic BP (DBP). Each model was further and progressively adjusted for age, sex, smoking status, total cholesterol, glycemia, and BMI.
We also wanted to determine whether a nonlinear link could be detected between BP and IMT (Table S1). Restricted cubic splines of BP variables were computed with a macro in SAS (SAS Institute) that consisted of transforming the independent variable 1 linear variable and k−2 cubic variables, in which k is the number of knots (at least 3, more often between 3 and 5 is sufficient). Three knots were used and fixed to the 10th, 50th, and 90th percentiles, according to Harrel's recommendation.18 Testing the log‐linear association between the exposure and the outcome consists of testing the nullity of the coefficient attributed to the cubic part (P<0.05 means that the coefficient is significantly different from zero, indicating non–log‐linearity).
The interaction between BP and hypertension on cIMT was also assessed in crude logistic regression and linear regression models, that is, in models including only the terms BP and hypertension and an interaction term of BP times hypertension (Table S2).
P<0.05 was considered statistically significant. All analyses were performed using SAS version 9.3.
Results
Participants' Baseline Characteristics
Participants with history of hypertension were significantly older (60.8±5.1 versus 58.4±5.9 years, P<0.001), had higher BMI (28.1 [IQR 25.3–32.0] versus 25.1 [IQR 22.8–27.9], P<0.001), had lower cholesterol levels (low‐density lipoprotein 1.35±0.37 versus 1.48±0.31 mmol/L, P<0.001; high‐density lipoprotein 0.55±0.14 versus 0.62±0.15 mmol/L, P<0.001), were more often diabetic (12% versus 3%, P<0.001), had higher SBP and DBP (SBP 135±15 versus 126±15 mm Hg, P<0.001; DBP 76±9 versus 74±9 mm Hg, P=0.001), higher cIMT (713 μm [IQR 633–817 μm] versus 684 μm [IQR 607–776 μm], P=0.001), and more participants with cIMT >900 μm (15% versus 6%, P<0.001) (Table 1).
Table 1.
Comparison of the Characteristics of Patients With Previously Known HTN History and Previously Unknown HTN Status
| HTN History (n=217) | No HTN History (n=479) | P Value | |
|---|---|---|---|
| Age, y | 60.8±5.1 | 58.4±5.9 | <0.001 |
| Male | 54% | 48% | 0.149 |
| Height, m | 1.66 (1.58–1.73) | 1.67 (1.60–1.74) | 0.104 |
| Weight, kg | 78.8 (67.7–89.7) | 70.1 (61.6–80.8) | <0.001 |
| BMI, kg/m² | 28.1 (25.3–32.0) | 25.1 (22.8–27.9) | <0.001 |
| Smoking | 13% | 12% | 0.602 |
| eGFR, mL/min/1.73 m² | 87.6 (77.2–96.0) | 91.0 (81.6–97.8) | 0.005 |
| eGFR <60 mL/min/1.73 m² | 2% | 2% | 0.772 |
| Total cholesterol, g/L | 2.16±0.43 | 2.31±0.35 | <0.001 |
| LDL, g/L | 1.35±0.37 | 1.48±0.31 | <0.001 |
| HDL, g/L | 0.55±0.14 | 0.62±0.15 | <0.001 |
| Hypercholesterolemia treatment | 42% | 13% | <0.001 |
| Glycemia, g/L | 0.95 (0.88–1.03) | 0.90 (0.84–0.96) | <0.001 |
| Diabetes | 12% | 3% | <0.001 |
| Diabetes treatment | 12% | 2% | <0.001 |
| Antihypertensive treatment | 100% | 0 | <0.001 |
| SBP, mm Hg, office measure | 135±15 | 126±15 | <0.001 |
| DBP, mm Hg, office measure | 76±9 | 74±9 | 0.001 |
| Nocturnal SBP, mm Hg | 116±12 | 111±10 | <0.001 |
| Diurnal SBP, mm Hg | 129±12 | 125±10 | <0.001 |
| 24‐h SBP, mm Hg | 124±11 | 120±9 | <0.001 |
| cIMT, μm | 713 (633–817) | 684 (607–776) | 0.001 |
| cIMT >900 μm | 15% | 6% | <0.001 |
Parametric tests were used for normally distributed variables; nonparametric tests were used for positively skewed variables (weight, BMI, glycemia, and IMT). BMI indicates body mass index; cIMT, carotid intima–media thickness; DBP, diastolic blood pressure; eGFR, estimated glomerular filtration rate; HDL, high‐density lipoproteins; HTN, hypertension; LDL, low‐density lipoproteins; SBP, systolic blood pressure.
Associations Between IMT and Hypertension Status
In the univariable model, participants with history of hypertension were more likely to have cIMT >900 μm (odds ratio 2.675 [95% CI 1.571–4.554], P<0.001) and had higher mean cIMT (β=45.30 [95% CI 20.80–69.70], P<0.001) compared with those without history of hypertension. These associations remained significant after adjustment for BP variables (24‐hour SBP and DBP) (Table 2). We adjusted for sex, age, and smoking status (model 1) plus total cholesterol and glycemia (model 2), retaining the described associations in the “crude model” (Table 2); however, when adjusting model 2 plus BMI (model 3), the association between having history of hypertension and increased cIMT (both categorical and continuous) was no longer significant (cIMT >900 μm: odds ratio 1.603 [95% CI 0.868–2.959], P=0.132; cIMT continuous: β=12.70 [95% CI −13.70 to 39.10], P=0.345) (Table 2).
Table 2.
Crude and Adjusted Association Between HTN History and IMT Expressed Either as a Dichotomous or Continuous Variable
| Variables (n=696) | IMT Cutoff 900 μm | Continuous IMT | ||
|---|---|---|---|---|
| OR for HTN History (95% CI) | P Value | β for HTN History (95% CI) | P Value | |
| Model without adjustment on cardiovascular risk factors | ||||
| Without adjustment for BP | 2.675 (1.571–4.554) | <0.001 | 45.265 (20.781–69.748) | <0.001 |
| With adjustment for 24‐h SBP | 2.253 (1.300–3.906) | 0.004 | 34.361 (9.570–59.151) | 0.007 |
| With adjustment for 24‐h DBP | 2.675 (1.571–4.555) | <0.001 | 45.194 (20.719–69.670) | <0.001 |
| Model adjusted for age, sex, and smoking status | ||||
| Without adjustment for BP | 2.229 (1.284–3.868) | 0.004 | 32.060 (7.205–56.915) | 0.012 |
| With adjustment for 24‐h SBP | 2.020 (1.149–3.551) | 0.014 | 25.789 (0.654–50.923) | 0.044 |
| With adjustment for 24‐h DBP | 2.229 (1.284–3.869) | 0.004 | 32.033 (7.200–56.867) | 0.012 |
| Model adjusted for age, sex, smoking status, total cholesterol, and glycemia | ||||
| Without adjustment for BP | 2.107 (1.179–3.765) | 0.012 | 29.562 (3.656–55.478) | 0.025 |
| With adjustment for 24‐h SBP | 1.969 (1.094–3.546) | 0.024 | 24.808 (−1.254 to 50.870) | 0.062 |
| With adjustment for 24‐h DBP | 2.104 (1.176–3.764) | 0.012 | 29.675 (3.775–55.576) | 0.025 |
| Model adjusted for age, sex, smoking status, total cholesterol, glycemia, and BMI | ||||
| Without adjustment for BP | 1.603 (0.868–2.959) | 0.132 | 12.689 (−13.680 to 39.058) | 0.345 |
| With adjustment for 24‐h SBP | 1.523 (0.822–2.820) | 0.181 | 9.193 (−17.238 to 35.624) | 0.495 |
| With adjustment for 24‐h DBP | 1.598 (0.864–2.956) | 0.135 | 12.691 (−13.650 to 39.032) | 0.345 |
Analyses performed with logistic (for dichotomous IMT) and linear (for continuous IMT) regressions. BMI indicates body mass index; BP, blood pressure; DBP, diastolic blood pressure; HTN, hypertension; IMT, intima–media thickness; OR, odds ratio; SBP, systolic blood pressure.
Associations Between IMT and BP
Using spline‐based analyses, we did not find evidence of a nonlinear association of BPs (SBP, DBP, or mean for 24 hours, daytime, nighttime, or office) with cIMT (Table S1). In addition, we found no significant evidence of a differential association of BP with cIMT in participants with and without hypertension (Table S2).
We plotted the risk of having cIMT >900 μm according to history of hypertension in Figure 2. In participants with history of hypertension, the risk of cIMT >900 μm gradually rose from <5% in participants with 24‐hour SBP <110 mm Hg to >20% in participants with 24‐hour SBP >140 mm Hg (Figure 2). Likewise, in participants without history of hypertension, the risk of cIMT >900 μm gradually rose from <5% in participants with 24‐hour SBP <110 mm Hg to almost 10% in participants with 24‐hour SBP >130 mm Hg. Similar trends were observed for daytime and nighttime SBP (except for nighttime BP in participants without a history of hypertension, a biphasic pattern was observed, peaking at 115 mm Hg) (Figure 2).
Figure 2.
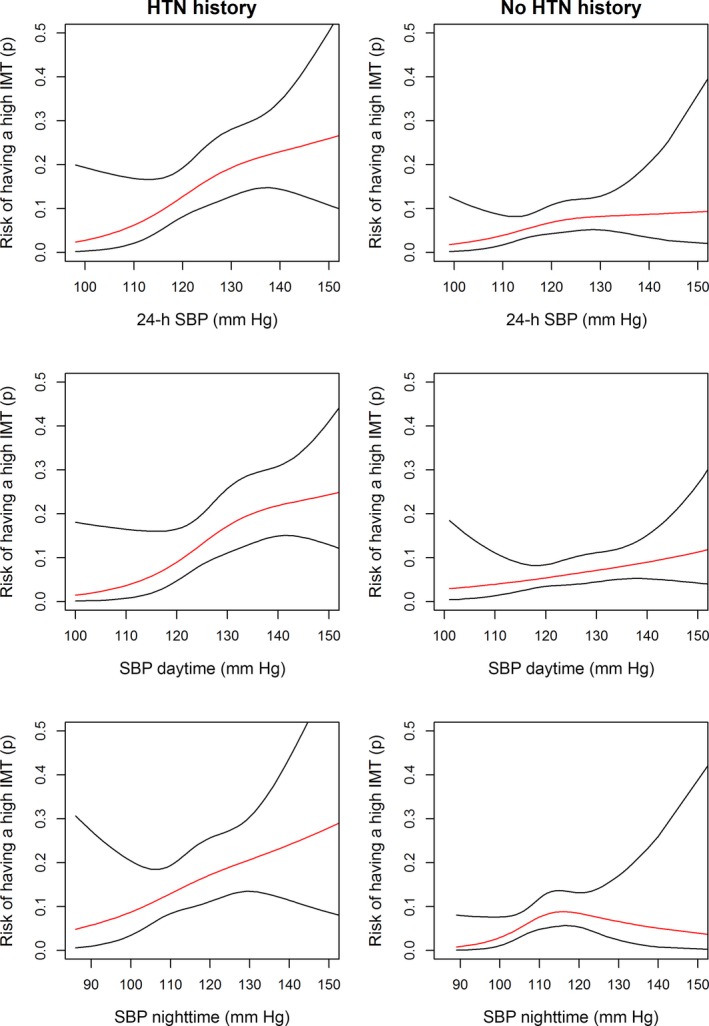
Risk of having a carotid IMT >900 μm according to previous HTN history. HTN, hypertension; IMT, intima–media thickness; SBP, systolic blood pressure.
Given this absence of significant interaction, we studied the entire cohort in further statistical models. Participants with higher SBP (24 hours, diurnal, nocturnal, and office) were significantly more likely to have cIMT >900 μm. SBP was also significantly associated with cIMT (expressed as a linear continuous variable) in univariable linear regression. In contrast, DBP was not associated with cIMT values (Table 3). After multivariable adjustment including age, sex, smoking status, total cholesterol, glycemia, BMI (model 3 in Table 3), and antihypertensive treatment (calcium channel blockers, angiotensin‐converting enzyme inhibitors, angiotensin receptors blockers, and beta blockers) (Tables S3 and S4), these associations became weaker, although they were significant for continuous cIMT. In model 3, for example, each 5‐mm Hg increase in 24‐hour SBP was associated with a ≈7‐μm increase in cIMT (IMT continuous: β=7.292 [95% CI 1.266–13.317], P=0.018), and each 5‐mm Hg increase in daytime SBP was associated with a ≈8‐μm increase in cIMT (IMT continuous: β=7.696 [95% CI 2.017–13.374], P=0.008) (Table 3).
Table 3.
Association of the IMT With BP Variables
| Variables (n=696) | IMT Cutoff 900 μm | Continuous IMT | ||
|---|---|---|---|---|
| OR for a 5‐mm Hg Increase in BP (95% CI) | P Value | β for a 5‐mm Hg Increase in BP (95% CI) | P Value | |
| Model adjusted for HTN | ||||
| Office SBP | 1.150 (1.062–1.246) | <0.001 | 8.358 (4.698–12.019) | <0.001 |
| 24‐h SBP | 1.192 (1.053–1.349) | 0.006 | 11.542 (5.896–17.187) | <0.001 |
| Diurnal SBP | 1.191 (1.059–1.339) | 0.004 | 11.367 (6.065–16.670) | <0.001 |
| Nocturnal SBP | 1.152 (1.023–1.297) | 0.019 | 8.925 (3.509–14.342) | 0.001 |
| Office DBP | 1.168 (1.004–1.359) | 0.045 | 9.546 (2.936–16.156) | 0.005 |
| 24‐h DBP | 0.976 (0.820–1.161) | 0.781 | 4.699 (−3.005 to 12.403) | 0.232 |
| Diurnal DBP | 0.989 (0.840–1.164) | 0.891 | 4.838 (−2.390 to 12.067) | 0.189 |
| Nocturnal DBP | 0.961 (0.809–1.142) | 0.651 | 3.185 (−4.348 to 10.718) | 0.407 |
| Model adjusted for HTN, age, sex, smoking status | ||||
| Office SBP | 1.115 (1.023–1.216) | 0.014 | 6.055 (2.150–9.960) | 0.002 |
| 24‐h SBP | 1.134 (0.994–1.294) | 0.062 | 8.350 (2.365–14.335) | 0.006 |
| Diurnal SBP | 1.140 (1.005–1.292) | 0.041 | 8.648 (3.010–14.287) | 0.003 |
| Nocturnal SBP | 1.103 (0.975–1.248) | 0.118 | 6.023 (0.416–11.630) | 0.035 |
| Office DBP | 1.105 (0.941–1.298) | 0.224 | 8.585 (1.678–15.492) | 0.015 |
| 24‐h DBP | 0.948 (0.783–1.147) | 0.580 | 6.085 (−2.149 to 14.319) | 0.147 |
| Diurnal DBP | 0.970 (0.810–1.161) | 0.738 | 6.617 (−1.109 to 14.342) | 0.093 |
| Nocturnal DBP | 0.932 (0.775–1.121) | 0.455 | 3.586 (−4.303 to 11.475) | 0.372 |
| Model adjusted for HTN, age, sex, smoking status, total cholesterol, and glycemia | ||||
| Office SBP | 1.105 (1.011–1.208) | 0.027 | 5.930 (1.956–9.903) | 0.004 |
| 24‐h SBP | 1.118 (0.976–1.281) | 0.106 | 7.931 (1.827–14.035) | 0.011 |
| Diurnal SBP | 1.123 (0.987–1.278) | 0.078 | 8.249 (2.490–14.008) | 0.005 |
| Nocturnal SBP | 1.095 (0.966–1.241) | 0.157 | 5.714 (0.043–11.385) | 0.048 |
| Office DBP | 1.069 (0.906–1.262) | 0.430 | 8.291 (1.277–15.304) | 0.021 |
| 24‐h DBP | 0.926 (0.763–1.124) | 0.437 | 5.656 (−2.614 to 13.925) | 0.180 |
| Diurnal DBP | 0.943 (0.785–1.133) | 0.530 | 6.109 (−1.666 to 13.885) | 0.123 |
| Nocturnal DBP | 0.928 (0.771–1.117) | 0.428 | 3.490 (−4.411 to 11.392) | 0.386 |
| Model adjusted for HTN, age, sex, smoking status, total cholesterol, glycemia, and BMI | ||||
| Office SBP | 1.094 (0.999–1.197) | 0.051 | 5.175 (1.243–9.107) | 0.010 |
| 24‐h SBP | 1.119 (0.976–1.283) | 0.107 | 7.292 (1.266–13.317) | 0.018 |
| Diurnal SBP | 1.125 (0.987–1.281) | 0.077 | 7.696 (2.017–13.374) | 0.008 |
| Nocturnal SBP | 1.094 (0.964–1.242) | 0.162 | 5.127 (−0.483 to 10.736) | 0.073 |
| Office DBP | 1.046 (0.884–1.238) | 0.601 | 6.713 (−0.257 to 13.682) | 0.059 |
| 24‐h DBP | 0.946 (0.776–1.154) | 0.586 | 6.312 (−1.786 to 14.409) | 0.126 |
| Diurnal DBP | 0.959 (0.795–1.157) | 0.664 | 6.532 (−1.086 to 14.149) | 0.093 |
| Nocturnal DBP | 0.947 (0.784–1.145) | 0.576 | 4.186 (−3.557 to 11.928) | 0.289 |
Analyses performed with logistic (for dichotomous IMT) and linear (for continuous IMT) regressions. BMI indicates body mass index; BP, blood pressure; DBP, diastolic blood pressure; HTN, hypertension; IMT, intima‐media thickness; OR, odds ratio; SBP, systolic blood pressure.
Discussion
We found that SBP is linearly and continuously associated with cIMT regardless of hypertension status. In our study, SBP had a linear association with cIMT throughout the SBP spectrum (even after adjustment for potential confounders, including antihypertensive treatment). We carefully searched for evidence of nonlinear associations using the most appropriate statistical methods (ie, spline‐based analysis). To the best of our knowledge, we are the first to perform this precise functional form of analysis for the association of BP with cIMT. The absence of a natural cutoff for the association between BP and cIMT suggests a gradual and continuous increase in the risk of vascular damage with higher levels of BP (even in normotensive participants), as observed for hard end points in the field of hypertension.
Moreover, our study is one of the largest population‐based studies to assess the association between BP, assessed by 24‐hour ABP monitoring, and cIMT.19
cIMT: A Marker of Vascular Damage
The accumulated evidence suggests that increased cIMT is associated with cardiovascular risk factors and adverse events.6, 20, 21, 22, 23 Moreover, cIMT changes over time can be assessed to monitor prognosis and/or response to treatment (eg, antihypertensive therapy).24, 25 Some studies suggest that cIMT can provide prognostic information above and beyond traditional risk factors.17, 21, 26 More recently, the prognostic utility of cIMT beyond that of other well‐known and validated risk factors has been questioned.27 Nevertheless, this does not impair the value of cIMT as an early marker of atherosclerosis, arterial hypertrophy or hyperplasia induced by pressure overload, and age‐related sclerosis. Consequently, cIMT represents an integrative measure of vascular damage rather than a marker of a particular isolated condition.12, 28
Because cIMT is a very sensitive tool that can identify mild vascular damage, we could identify as much as 6% of participants without hypertension (based on clinical records plus ABP measurement) with increased cIMT (>900 μm). In a way, this low threshold of detection enables us to study the link between BP values that are considered to be within the normal range and vascular damage.
Association of Hypertension and BP With cIMT
Increased SBP (regardless of the used method) is an important determinant of cIMT, presumably an augmentation of the intima–media complex.29, 30 As our study confirmed, participants with history of hypertension and those who had hypertension detected on 24‐hour ABP monitoring (but without a previous hypertension diagnosis) are likely to have higher cIMT values (Table S5). Why only SBP (and not DBP) was associated with increased cIMT deserves some comment. A previous study described SBP (and not DBP) as an independent predictor of increased cIMT.12 Likewise, another study found that SBP (24 hours, daytime, and nighttime) was significantly correlated with cIMT, even after adjustment for age, sex, and smoking. In that study, DBP was again not associated with cIMT measurement.31 These findings have also been reported in other studies32, 33, 34, 35 and suggest that SBP may induce higher pressure overload and thus induce more arterial hypertrophy or hyperplasia than DBP. Moreover, some authors argued that SBP may be a more important risk factor for atherosclerosis and cardiovascular disease than DBP.34, 35
We provided strong evidence for a continuum of vascular damage caused by higher BP, even in participants without a history of hypertension . In addition, the risk of cIMT >900 μm increased 2‐fold from <110 mm Hg to >130 mm Hg for 24‐hour SBP in both hypertensive and nonhypertensive participants (Figure 2). In a way, our results highlight the detrimental effect of BP in a range currently considered to be normal. This paradigm of a gradual continual increase of risk with higher values of a variable is well known in other fields of medicine, for instance, gradually increasing risk of clinical events is observed with higher fasting glucose values, even outside of the range of diabetes definition.36 This has also been described in the field of hypertension, with the risk of hard clinical end points gradually increasing with higher BP values above a certain cutoff.37
This finding can explain, to some extent, the association of “prehypertension” with poorer outcome.38, 39 Because the process is gradual, prehypertension is moderately associated with higher risk for events, possibly because of greater vascular damage, as highlighted by our results. In addition, our results are of interest in the interpretation of the recently published SPRINT trial. In the SPRINT trial,4 an office SBP <120 mm Hg (intensive treatment) significantly reduced the primary composite outcome (of myocardial infarction, other acute coronary syndromes, stroke, heart failure, or death from cardiovascular causes) and all‐cause mortality (intensive treatment: hazard ratio 0.75 [95% CI 0.64–0.89], P<0.001, and 0.73 [95% CI 0.60–0.90], P=0.003, respectively) compared with a standard strategy (target SBP <140 mm Hg). The better clinical outcome associated with intensive treatment might be partially linked to a lesser degree of vascular damage in patients with more strict BP control. Our results greatly support this hypothesis, with the number of participants with cIMT >900 µm being decreased 2‐fold in hypertensive participants with 24‐hour SBP <110 mm Hg compared with participants at the usual 24‐hour SBP target of 130 mm Hg (Figure 2). Increasing subclinical vascular damage in participants with BP at the high end of the normal range (ie, office SBP between 120 and 139 mm Hg, ambulatory SBP between 110 and 130 mm Hg) might be an important physiopathological process contributing to the disruptive results of the SPRINT trial. These results were also confirmed in a recent meta‐analysis39 in which intensive lowering of BP provided greater vascular protection than standard regimens, especially in high‐risk patients (eg, those with vascular disease, renal disease, or diabetes), including those with SBP <140 mm Hg.
Limitations
The main limitation of our study is its observational design, based on a cross‐sectional evaluation; therefore, only associations between study variables could be detected, and causality could not be inferred. These associations are likely to be reproducible by other observers (we demonstrated excellent interobserver agreement). In addition, given our sample size, we could not adjust our analysis for every possible cardiovascular risk variable. Last, the conclusions of this analysis cannot be generalized to general hypertensive population, as they refer to a sample of hypertension subjects with good BP control on average.
Conclusions
SBP was linearly and continuously associated with higher cIMT in both hypertensive and nonhypertensive participants, suggesting a detrimental effect of BP on the vascular tree prior to overt hypertension. Similarly, it suggests a detrimental effect of BP at the higher end of the normal range in treated hypertensive patients.
Sources of Funding
The Stanislas study is sponsored by Nancy CHRU. This work is supported by a public grant overseen by the French National Research Agency (ANR) as part of the second “Investissements d'Avenir” programme (reference: ANR‐15‐RHUS‐0004).
Disclosures
Dr Girerd has received Board Membership fees from Novartis. Dr Rossignol has received Board Membership fees from Novartis, Relypsa, Vifor Fresenius Medical Care Renal Pharma, and Steathpeptides. Dr Zannad has received fees for serving on the board of Boston Scientific; consulting fees from Novartis, Takeda, AstraZeneca, Boehringer Ingelheim, GE Healthcare, Relypsa, Servier, Boston Scientific, Bayer, Johnson & Johnson, and Resmed; and speakers' fees from Pfizer and AstraZeneca. He and Dr Rossignol are CardioRenal co‐founders. Dr Ferreira reported that he has no relationships relevant to the contents of this paper to disclose.
Supporting information
Table S1. Models With Spline
Table S2. Tests of Interaction Between Blood Pressure Variables and Treatment (n=696)
Table S3. Associations Adjusted for Calcium Channel Blockers
Table S4. Associations Adjusted for Hypertension Treatment
Table S5. Crude and Adjusted Association Between Hypertension History or Discovery of Hypertension by Ambulatory Blood Pressure Monitoring and Intima–Media Thickness Expressed as Either a Dichotomous or Continuous Variable
Acknowledgments
The authors deeply thank the entire Clinical Investigation Center staff all of whom are involved in the daily management of the STANISLAS cohort. We also thank Pierre Pothier for the editing of the manuscript.
(J Am Heart Assoc. 2016;5:e003529 doi: 10.1161/JAHA.116.003529)
References
- 1. Tanaka H, Dinenno FA, Monahan KD, DeSouza CA, Seals DR. Carotid artery wall hypertrophy with age is related to local systolic blood pressure in healthy men. Arterioscler Thromb Vasc Biol. 2001;21:82–87. [DOI] [PubMed] [Google Scholar]
- 2. Schmidt‐Trucksass A, Grathwohl D, Schmid A, Boragk R, Upmeier C, Keul J, Huonker M. Structural, functional, and hemodynamic changes of the common carotid artery with age in male subjects. Arterioscler Thromb Vasc Biol. 1999;19:1091–1097. [DOI] [PubMed] [Google Scholar]
- 3. Bianchini E, Bozec E, Gemignani V, Faita F, Giannarelli C, Ghiadoni L, Demi M, Boutouyrie P, Laurent S. Assessment of carotid stiffness and intima‐media thickness from ultrasound data: comparison between two methods. J Ultrasound Med. 2010;29:1169–1175. [DOI] [PubMed] [Google Scholar]
- 4. Wright JT Jr, Williamson JD, Whelton PK, Snyder JK, Sink KM, Rocco MV, Reboussin DM, Rahman M, Oparil S, Lewis CE, Kimmel PL, Johnson KC, Goff DC Jr, Fine LJ, Cutler JA, Cushman WC, Cheung AK, Ambrosius WT. A randomized trial of intensive versus standard blood‐pressure control. N Engl J Med. 2015;373:2103–2116. [DOI] [PMC free article] [PubMed] [Google Scholar]
- 5. Tardif JC, Heinonen T, Orloff D, Libby P. Vascular biomarkers and surrogates in cardiovascular disease. Circulation. 2006;113:2936–2942. [DOI] [PubMed] [Google Scholar]
- 6. Lorenz MW, Markus HS, Bots ML, Rosvall M, Sitzer M. Prediction of clinical cardiovascular events with carotid intima‐media thickness: a systematic review and meta‐analysis. Circulation. 2007;115:459–467. [DOI] [PubMed] [Google Scholar]
- 7. de Groot E, van Leuven SI, Duivenvoorden R, Meuwese MC, Akdim F, Bots ML, Kastelein JJ. Measurement of carotid intima‐media thickness to assess progression and regression of atherosclerosis. Nat Clin Pract Cardiovasc Med. 2008;5:280–288. [DOI] [PubMed] [Google Scholar]
- 8. Lorenz MW, Polak JF, Kavousi M, Mathiesen EB, Volzke H, Tuomainen TP, Sander D, Plichart M, Catapano AL, Robertson CM, Kiechl S, Rundek T, Desvarieux M, Lind L, Schmid C, DasMahapatra P, Gao L, Ziegelbauer K, Bots ML, Thompson SG; PROG‐IMT Study Group . Carotid intima‐media thickness progression to predict cardiovascular events in the general population (the PROG‐IMT collaborative project): a meta‐analysis of individual participant data. Lancet. 2012;379:2053–2062. [DOI] [PMC free article] [PubMed] [Google Scholar]
- 9. Puato M, Palatini P, Zanardo M, Dorigatti F, Tirrito C, Rattazzi M, Pauletto P. Increase in carotid intima‐media thickness in grade I hypertensive subjects: white‐coat versus sustained hypertension. Hypertension. 2008;51:1300–1305. [DOI] [PubMed] [Google Scholar]
- 10. Kannel WB. Risk stratification in hypertension: new insights from the Framingham Study. Am J Hypertens. 2000;13:3s–10s. [DOI] [PubMed] [Google Scholar]
- 11. Mancia G, Parati G, Borghi C, Ghironzi G, Andriani E, Marinelli L, Valentini M, Tessari F, Ambrosioni E; SMOOTH Investigators . Hypertension prevalence, awareness, control and association with metabolic abnormalities in the San Marino population: the SMOOTH study. J Hypertens. 2006;24:837–843. [DOI] [PubMed] [Google Scholar]
- 12. Di Bello V, Carerj S, Perticone F, Benedetto F, Palombo C, Talini E, Giannini D, La Carrubba S, Antonini‐Canterin F, Di Salvo G, Bellieni G, Pezzano A, Romano MF, Balbarini A; Research Group of the Italian Society of CardioVascular Echocardiography (SIEC) . Carotid intima‐media thickness in asymptomatic patients with arterial hypertension without clinical cardiovascular disease: relation with left ventricular geometry and mass and coexisting risk factors. Angiology. 2009;60:705–713. [DOI] [PubMed] [Google Scholar]
- 13. Frikha Z, Girerd N, Huttin O, Courand PY, Bozec E, Olivier A, Lamiral Z, Zannad F, Rossignol P. Reproducibility in echocardiographic assessment of diastolic function in a population based study (the STANISLAS Cohort study). PLoS One. 2015;10:e0122336. [DOI] [PMC free article] [PubMed] [Google Scholar]
- 14. Heiss G, Sharrett AR, Barnes R, Chambless LE, Szklo M, Alzola C. Carotid atherosclerosis measured by B‐mode ultrasound in populations: associations with cardiovascular risk factors in the ARIC study. Am J Epidemiol. 1991;134:250–256. [DOI] [PubMed] [Google Scholar]
- 15. Pignoli P, Tremoli E, Poli A, Oreste P, Paoletti R. Intimal plus medial thickness of the arterial wall: a direct measurement with ultrasound imaging. Circulation. 1986;74:1399–1406. [DOI] [PubMed] [Google Scholar]
- 16. O'Brien E, Parati G, Stergiou G, Asmar R, Beilin L, Bilo G, Clement D, de la Sierra A, de Leeuw P, Dolan E, Fagard R, Graves J, Head GA, Imai Y, Kario K, Lurbe E, Mallion JM, Mancia G, Mengden T, Myers M, Ogedegbe G, Ohkubo T, Omboni S, Palatini P, Redon J, Ruilope LM, Shennan A, Staessen JA, vanMontfrans G, Verdecchia P, Waeber B, Wang J, Zanchetti A, Zhang Y; European Society of Hypertension Working Group on Blood Pressure Monitoring . European Society of Hypertension position paper on ambulatory blood pressure monitoring. J Hypertens. 2013;31:1731–1768. [DOI] [PubMed] [Google Scholar]
- 17. Mancia G, Fagard R, Narkiewicz K, Redon J, Zanchetti A, Bohm M, Christiaens T, Cifkova R, De Backer G, Dominiczak A, Galderisi M, Grobbee DE, Jaarsma T, Kirchhof P, Kjeldsen SE, Laurent S, Manolis AJ, Nilsson PM, Ruilope LM, Schmieder RE, Sirnes PA, Sleight P, Viigimaa M, Waeber B, Zannad F; Task Force for the Management of Arterial Hypertension of the European Society of Hypertension and the European Society of Cardiology . 2013 ESH/ESC practice guidelines for the management of arterial hypertension. Blood Press. 2014;23:3–16. [DOI] [PubMed] [Google Scholar]
- 18. Harrel F. Regression Modeling Strategies: With Applications to Linear Models, Logistic Regression, and Survival Analysis. Springer‐Verlag: New York; 2001. doi: 10.1007/978‐1‐4757‐3462‐1. [Google Scholar]
- 19. Manios E, Michas F, Tsivgoulis G, Stamatelopoulos K, Tsagalis G, Koroboki E, Alexaki E, Papamichael C, Vemmos K, Zakopoulos N. Impact of prehypertension on carotid artery intima‐media thickening: actual or masked? Atherosclerosis. 2011;214:215–219. [DOI] [PubMed] [Google Scholar]
- 20. Peters SA, Grobbee DE, Bots ML. Carotid intima‐media thickness: a suitable alternative for cardiovascular risk as outcome? Eur J Cardiovasc Prev Rehabil. 2011;18:167–174. [DOI] [PubMed] [Google Scholar]
- 21. van den Oord SC, Sijbrands EJ, ten Kate GL, van Klaveren D, van Domburg RT, van der Steen AF, Schinkel AF. Carotid intima‐media thickness for cardiovascular risk assessment: systematic review and meta‐analysis. Atherosclerosis. 2013;228:1–11. [DOI] [PubMed] [Google Scholar]
- 22. Chambless LE, Heiss G, Folsom AR, Rosamond W, Szklo M, Sharrett AR, Clegg LX. Association of coronary heart disease incidence with carotid arterial wall thickness and major risk factors: the Atherosclerosis Risk in Communities (ARIC) Study, 1987–1993. Am J Epidemiol. 1997;146:483–494. [DOI] [PubMed] [Google Scholar]
- 23. Howard G, Manolio TA, Burke GL, Wolfson SK, O'Leary DH. Does the association of risk factors and atherosclerosis change with age? An analysis of the combined ARIC and CHS cohorts. The Atherosclerosis Risk in Communities (ARIC) and Cardiovascular Health Study (CHS) investigators. Stroke. 1997;28:1693–1701. [DOI] [PubMed] [Google Scholar]
- 24. Wang JG, Staessen JA, Li Y, Van Bortel LM, Nawrot T, Fagard R, Messerli FH, Safar M. Carotid intima‐media thickness and antihypertensive treatment: a meta‐analysis of randomized controlled trials. Stroke. 2006;37: 1933–1940. [DOI] [PubMed] [Google Scholar]
- 25. Yokoyama H, Katakami N, Yamasaki Y. Recent advances of intervention to inhibit progression of carotid intima‐media thickness in patients with type 2 diabetes mellitus. Stroke. 2006;37:2420–2427. [DOI] [PubMed] [Google Scholar]
- 26. Greenland P, Alpert JS, Beller GA, Benjamin EJ, Budoff MJ, Fayad ZA, Foster E, Hlatky MA, Hodgson JM, Kushner FG, Lauer MS, Shaw LJ, Smith SC Jr, Taylor AJ, Weintraub WS, Wenger NK, Jacobs AK, Smith SC Jr, Anderson JL, Albert N, Buller CE, Creager MA, Ettinger SM, Guyton RA, Halperin JL, Hochman JS, Kushner FG, Nishimura R, Ohman EM, Page RL, Stevenson WG, Tarkington LG, Yancy CW; American College of Cardiology Foundation; American Heart Association . 2010 ACCF/AHA guideline for assessment of cardiovascular risk in asymptomatic adults: a report of the American College of Cardiology Foundation/American Heart Association Task Force on Practice Guidelines. J Am Coll Cardiol. 2010;56:e50–e103. [DOI] [PubMed] [Google Scholar]
- 27. Bots ML, Groenewegen KA, Anderson TJ, Britton AR, Dekker JM, Engstrom G, Evans GW, de Graaf J, Grobbee DE, Hedblad B, Hofman A, Holewijn S, Ikeda A, Kavousi M, Kitagawa K, Kitamura A, Ikram MA, Lonn EM, Lorenz MW, Mathiesen EB, Nijpels G, Okazaki S, O'Leary DH, Polak JF, Price JF, Robertson C, Rembold CM, Rosvall M, Rundek T, Salonen JT, Sitzer M, Stehouwer CD, Franco OH, Peters SA, den Ruijter HM. Common carotid intima‐media thickness measurements do not improve cardiovascular risk prediction in individuals with elevated blood pressure: the USE‐IMT collaboration. Hypertension. 2014;63:1173–1181. [DOI] [PMC free article] [PubMed] [Google Scholar]
- 28. Roman MJ, Pickering TG, Pini R, Schwartz JE, Devereux RB. Prevalence and determinants of cardiac and vascular hypertrophy in hypertension. Hypertension. 1995;26:369–373. [DOI] [PubMed] [Google Scholar]
- 29. Suurkula M, Agewall S, Fagerberg B, Wendelhag I, Widgren B, Wikstrand J. Ultrasound evaluation of atherosclerotic manifestations in the carotid artery in high‐risk hypertensive patients. Risk Intervention Study (RIS) Group. Arterioscler Thromb. 1994;14:1297–1304. [DOI] [PubMed] [Google Scholar]
- 30. Pauletto P, Palatini P, Da Ros S, Pagliara V, Santipolo N, Baccillieri S, Casiglia E, Mormino P, Pessina AC. Factors underlying the increase in carotid intima‐media thickness in borderline hypertensives. Arterioscler Thromb Vasc Biol. 1999;19:1231–1237. [DOI] [PubMed] [Google Scholar]
- 31. Zanchetti A, Crepaldi G, Bond MG, Gallus GV, Veglia F, Ventura A, Mancia G, Baggio G, Sampieri L, Rubba P, Collatina S, Serrotti E. Systolic and pulse blood pressures (but not diastolic blood pressure and serum cholesterol) are associated with alterations in carotid intima‐media thickness in the moderately hypercholesterolaemic hypertensive patients of the Plaque Hypertension Lipid Lowering Italian Study. PHYLLIS study group. J Hypertens. 2001;19:79–88. [DOI] [PubMed] [Google Scholar]
- 32. Lusiani L, Visona A, Pagnan A. Noninvasive study of arterial hypertension and carotid atherosclerosis. Stroke. 1990;21:410–414. [DOI] [PubMed] [Google Scholar]
- 33. Salonen R, Salonen JT. Carotid atherosclerosis in relation to systolic and diastolic blood pressure: Kuopio Ischaemic Heart Disease Risk Factor Study. Ann Med. 1991;23:23–27. [DOI] [PubMed] [Google Scholar]
- 34. Lakka TA, Salonen R, Kaplan GA, Salonen JT. Blood pressure and the progression of carotid atherosclerosis in middle‐aged men. Hypertension. 1999;34:51–56. [DOI] [PubMed] [Google Scholar]
- 35. Mannami T, Konishi M, Baba S, Nishi N, Terao A. Prevalence of asymptomatic carotid atherosclerotic lesions detected by high‐resolution ultrasonography and its relation to cardiovascular risk factors in the general population of a Japanese city: the Suita study. Stroke. 1997;28:518–525. [DOI] [PubMed] [Google Scholar]
- 36. Holman RR, Paul SK, Bethel MA, Matthews DR, Neil HA. 10‐year follow‐up of intensive glucose control in type 2 diabetes. N Engl J Med. 2008;359:1577–1589. [DOI] [PubMed] [Google Scholar]
- 37. Boutitie F, Gueyffier F, Pocock S, Fagard R, Boissel JP. J‐shaped relationship between blood pressure and mortality in hypertensive patients: new insights from a meta‐analysis of individual‐patient data. Ann Intern Med. 2002;136:438–448. [DOI] [PubMed] [Google Scholar]
- 38. Skilton MR, Serusclat A, Sethu AH, Brun S, Bernard S, Balkau B, Moulin P, Bonnet F. Noninvasive measurement of carotid extra‐media thickness: associations with cardiovascular risk factors and intima‐media thickness. JACC Cardiovasc Imaging. 2009;2:176–182. [DOI] [PubMed] [Google Scholar]
- 39. Wang S, Wu H, Zhang Q, Xu J, Fan Y. Impact of baseline prehypertension on cardiovascular events and all‐cause mortality in the general population: a meta‐analysis of prospective cohort studies. Int J Cardiol. 2013;168:4857–4860. [DOI] [PubMed] [Google Scholar]
Associated Data
This section collects any data citations, data availability statements, or supplementary materials included in this article.
Supplementary Materials
Table S1. Models With Spline
Table S2. Tests of Interaction Between Blood Pressure Variables and Treatment (n=696)
Table S3. Associations Adjusted for Calcium Channel Blockers
Table S4. Associations Adjusted for Hypertension Treatment
Table S5. Crude and Adjusted Association Between Hypertension History or Discovery of Hypertension by Ambulatory Blood Pressure Monitoring and Intima–Media Thickness Expressed as Either a Dichotomous or Continuous Variable