Abstract
Central hematocrit (Hc) measurements are currently used to track the degree of ultrafiltration-induced hemoconcentration with the aim to detect and prevent excessive intravascular fluid depletion during hemodialysis (HD). Failure to maintain hemodynamic stability is commonly attributed to the misinterpretation of Hc caused by the un-accountable increase in Fcells, the ratio of whole body hematocrit to Hc.
It was the aim to examine Fcells under everyday conditions in a group of stable HD patients. Absolute plasma volume (Vp) and Hc were concomitantly measured during routine HD in the extracorporeal system in hourly intervals using optical means to derive relative plasma volumes from Vp and Hc (RPVp, RPVH), and to calculate Fcells.
Thirteen patients were studied during two mid-week treatments (n=26). Both absolute Vp (p<0.05) and relative plasma volumes RPVH (p<0.001) decreased during HD. Vp at any time point was positively correlated to RPVH (r=0.72). Moreover, relative plasma volumes RPVH and RPVp determined by independent techniques were identical and showed negligible bias (−0.2 %) but considerable limits of agreement (−15.6 to +15.3%). Fcells was in the range of 0.9±0.05 throughout HD and stable in subjects and not different from the value assumed at the beginning of HD.
In conclusion, while relative plasma volumes (RPVH and RPVp) determined by independent techniques are comparable and Fcells remains constant, individual variability and limited accuracy of absolute volume measurements appears to complicate the control problem. Alternative strategies to control for excessive hemoconcentration need to be considered.
Keywords: indicator dilution, plasma volume, vascular refilling
Introduction
On-line measurement of hematocrit, hemoglobin, or total blood protein (i.e. hemoglobin and plasma protein) in the extracorporeal circulation is currently used to track the degree of ultrafiltration-induced hemoconcentration during hemodialysis with the aim to detect and to prevent excessive intravascular fluid depletion and to maintain hemodynamic stability. Different systems have been adapted for dialysis machines from various manufacturers 1–4. In some dialysis machines the information is used for feedback control of blood volume by adjusting ultrafiltration-rate alone or in combination with dialysate conductivity 5, 6. The success of these systems, however, is in debate 7. One common critique is based on the measurement of central or large vessel hematocrit rather than whole body hematocrit so that the hemoconcentration measured by these systems does not reflect overall blood volume changes and probably underestimates the hemodynamic strain during ultrafiltration of excess body fluid. This critique is based on physiological evidence and on a few studies done in hemodialysis 8, 9. In these studies it was also observed that the underestimation of intravascular volume changes significantly increased with increasing treatment time. Thus, if this increase were systematic, it could be accounted for in mechanistic control systems.
The aim of this study therefore was to revisit this issue and to examine absolute and relative plasma volumes during dialysis conditions likely to represent the routine situation in a group of stable dialysis patients.
Material and Methods
Patients
Patients from the outpatient dialysis program of the Medical University Clinic were asked to undergo absolute and relative plasma volume measurements during two regular and subsequent midweek treatments. Patients older than 18 years and on chronic hemodialysis for at least 6 months were eligible for this study. Patients with persistent hemodynamic instability during hemodialysis, patients with suspected hypersensitivity to traces of iodine in the tracer used for plasma volume measurements, and patients with impaired liver function were excluded from the study. Patients gave written informed consent to participate in the study as approved by the Institutional Review Board of the Medical University of Graz, Austria.
Bicarbonate dialysate was delivered at flows of either 500 or 800 mL/min and at temperatures between 36 and 37 °C using standard dialysis equipment and volumetric control of dialysate flows. Blood flows and dialysate sodium concentrations were set as prescribed. Studies done in on-line hemodiafiltration (HDF) mode used post-dilution configurations to avoid interference with on-line measurement of hematocrit. Infusion volumes in HDF patients and ultrafiltration volumes to reach the clinical patient dry weight were set as prescribed. Ultrafiltration volumes were prescribed from the difference of pre-dialysis and clinical dry weights and removed by constant ultrafiltration rates maintained throughout the duration of the treatment.
Patients assumed their regular body position during dialysis and were allowed to consume their usual coffee or drink. However, patients were asked to abstain from eating and drinking prior and during the indicator dilution tests.
Measurement and calculation
Relative and absolute volumes were measured by non-invasive and continuous technology using the CritLine-Instrument-III (CLI, Hemametrics, Kaysville, UT). The CLI is approved for hemodialysis using a disposable measuring cell inserted between the arterial line and the dialyzer blood inflow port for the continuous measurement of central hematocrit in the extracorporeal circulation. Comparable to other techniques measuring optical density in the range of 800 nm the CLI can also be used to measure the concentration of indocyanine green (ICG) dye as described elsewhere 10. ICG is a classic dye to measure hemodynamic variables and plasma volume using principles of indicator dilution 11, 12. Relative and absolute volumes were measured and compared at four times during dialysis (t1, t2, t3, t4). The first measurement was done approximately 15 min into dialysis and subsequent measurements were repeated within approximately 1 h intervals. ICG was injected into the venous line of the extracorporeal circulation. Local access recirculation was excluded by absence of dye prematurely recirculating into the arterial blood line 13. Blood and plasma concentrations of ICG at the time of injection were estimated from single-pool kinetic analysis as described elsewhere, and the single-pool distribution volume for plasma (Vp) was calculated from the amount of ICG injected 14. The single-pool assumption is applicable for plasma but total blood and erythrocyte volumes are overestimated because the sample hematocrit is larger than the average whole body hematocrit. The double-pool nature of blood with regard to hematocrit is generally described by the ratio of whole body to central hematocrit (H), also know as the fraction of cells (Fcells) 15.
Erythrocyte volume (Ve) was determined from plasma volume (Vp,1) obtained from the first dilution measurement at t=1 using the following relationship
| Eq. 1 |
where H1 refers the hematocrit in the arterial blood line at t1, the time of the first ICG injection, and where Fcells,1 at that time was assumed as 0.9 as reported for pre-dialysis conditions 9.
Plasma volume at baseline (t=0) was determined from the first dilution measurement and corrected for relative plasma volume (RPV, see Eq. 4 below) to account for effects of ultrafiltration and vascular refilling within the first minutes of dialysis so that
| Eq. 2 |
Assuming constant erythrocyte volume the fraction of cells at subsequent time points t=2, 3, and 4 was calculated as
| Eq. 3 |
On-line optical measurement of central hematocrit was used to derive the relative plasma volume (RPVH) at any time as
| Eq. 4 |
where index 0 refers to conditions at t=0 (baseline). Notice that the ratio H0/H refers to relative blood volume (RBVH) provided by various on-line blood volume monitors. Eq. 4 is useful to convert relative blood volume into relative plasma volume. Both RPVH and RBVH are single-pool estimates because they are derived from central hematocrit without consideration of Fcells. However, accounting for whole body hematocrit Eq. 4 becomes
| Eq. 5 |
Relative plasma volume (RPVp) was also obtained from absolute plasma volumes as
| Eq. 6 |
Statistical analysis
Data were analyzed using commercial software (Kaleidagraph 4.5, Synergy Software Inc., Reading, PA, and StatView 4.5, Abacus Concepts Inc., Berkeley, CA) and are presented as mean±standard deviation (X±SD) unless otherwise specified. The relationship between relative and absolute volumes was analyzed for independent treatments. Data obtained or derived from measurements at different time points within one treatment were analyzed by ANOVA using Scheffé’s correction for pairwise comparison of repeated measurements as well as by non-parametric Friedman test. Linear regression of continuous variables obtained from least squares analysis was examined by ANOVA with regard to reject the null-hypothesis for intercept (β0=0) and slope (β1=0). Comparison of techniques was done by Bland-Altman analysis. A probability p<0.05 was assumed as significant to reject the null-hypothesis.
Results
Fourteen patients were studied in two subsequent midweek treatments. One patient was excluded because of repeated eating during ICG dilution tests so that 26 studies obtained in a balanced male to female population of 13 patients entered final analysis. Patient characteristics are summarized in Tab. 1.
Tab. 1.
Patient characteristics (n=13)
| Variable | Unit | Total, X±SD |
|---|---|---|
| Female | 7 (54%) | |
| Diabetes | 5 (39%) | |
| Height | cm | 169.8±9 |
| Weight | kg | 70.7±14.6 |
| Age | years | 56±15 |
| BMI | kg/m2 | 24.4±3.9 |
Abbreviations: n, number of studies; X±SD, average ± standard deviation; BMI, body mass index
Treatments were delivered without complications and patients maintained stable blood pressures and heart rates. A more detailed analysis of the time course of hemodynamic variables with focus on hepato-splanchnic resistance and blood flow in 12 patients is presented and discussed in a companion manuscript 16.
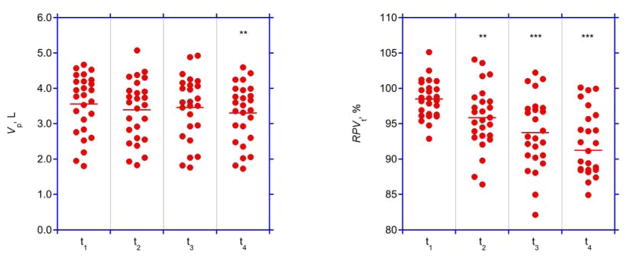
Treatment data and volumes at baseline are summarized in Tab. 2. The timing of volume measurements at 16±4, 73±4, 132±5, and 191±9 min followed the study protocol. Both absolute and relative plasma volumes decreased during the course of dialysis, but the decrease in relative plasma volume was more significant (Fig. 1, Tab. 3).
Tab. 2.
Treatment characteristics (n=26)
| Variable | Unit | Total, X±SD |
|---|---|---|
| Vu | L | 2.06±0.65 |
| Vu,s | mL/kg | 30.2±11.5 |
| t | min | 246±12 |
| Qu | L/h | 0.50±0.16 |
| H | % | 35.0±2.8 |
| Vp | L | 3.60±0.82 |
| CV | 0.06±0.04 | |
| Ve | L | 1.65±0.39 |
Abbreviations: n, number of studies; X±SD, average ± standard deviation; Vu, ultrafiltration volume; Vu,s specific ultrafiltration volume; t, treatment duration; Qu, ultrafiltration rate; H, central hematocrit at baseline; Vp, plasma volume at baseline; CV, coefficient of variation for Vp measurements repeated within the same treatment; Ve, erythrocyte volume
Fig. 1. Plasma volumes.
Absolute (Vp, left panel) and relative (RPVt,, right panel) plasma volumes at four time points (t1, t2, t3, and t4). Bars represent average values.
* p<0.01, different from baseline at t1
** p<0.001, different from baseline at t1
Tab. 3.
Time course of absolute and relative plasma volumes (n=26)
| Time point | V, L | RPV, % | Fcells |
|---|---|---|---|
| t1 | 3.55±0.84 | 98.5±2.7 | 0.9 |
| t2 | 3.39±0.87 | 95.8±4.4 | 0.917±0.056 |
| t3 | 3.46±0.91 | 93.7±5.1 | 0.897±0.048 |
| t4 | 3.30±0.83 | 91.3±5.8 | 0.903±0.054 |
| p | <0.05* | <0.0001* | n.s. |
different between times
Abbreviations: n, number of studies; V, absolute plasma volume; RPV, relative blood volume; Fcells, fraction of cells; t1 to t4, time points of measurement during dialysis; p, probability to reject the null-hypothesis for repeated measurements (Friedman test)
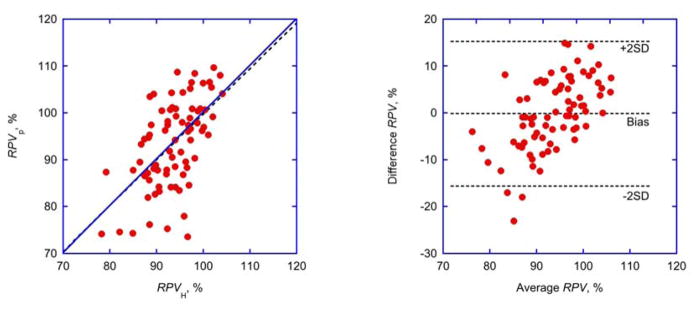
A comparison of techniques showed that plasma volume (Vp) at any time point was positively correlated to relative plasma volume (RPVH) determined from hematocrit readings (Tab. 4). Moreover, RPVH and RPVp determined by independent techniques were identical and showed negligible bias (−0.2 %) for all treatments but considerable scatter and wide limits of agreement (−15.6 to +15.3%) in individual treatments. (Fig. 2, right panel). The difference between measuring techniques, however, was positively correlated to the measuring range (Tab. 4).
Tab. 4.
Comparison of techniques (n=26)
| Y | X | β0 | p(β0) | β1 | p(β1) | r2 |
|---|---|---|---|---|---|---|
| Vp | RPVH | −4.54 | <0.001* | 0.08 | <0.0001* | 0.27 |
| RPVp | RPVH | 2.11 | 0.89 | 0.98 | <0.0001* | 0.32 |
| RPVp- | (RPVp+RPVH)/2 | - | <0.0001* | 0.67 | <0.0001* | 0.33 |
| RPVH | 62.87 | |||||
| - | <0.0001* | 1.54 | 1.00 | |||
| RPVH | RBVH | 54.00 | <0.0001* | |||
| - | <0.0001* | 1.52 | 0.99 | |||
| RPVsim | RBVsim | 52.61 | <0.0001* |
different from zero
Abbreviations: Y, dependent variable; X, independent variable; β0, β1, intercept and slope of linear regression; p(β0), p(β1), probability to reject the null-hypothesis for β0 or β1; r2, regression coefficient; Vp, absolute plasma volume; RPVH, relative plasma volume derived from hematocrit (see Eq. 4); RPVp, relative plasma volume derived from plasma volumes (see Eq. 6); RBVH, relative blood volume derived from hematocrit; RPVsim, relative plasma volume derived from simulated hematocrit data; RBVsim, relative blood volume derived from simulated hematocrit data
Fig. 2. Comparison of techniques.
Identity plot (left panel; linear regression shown as broken line) and Bland-Altman plot (right panel; bias and limits of agreement shown as broken lines) of relative plasma volumes determined from hematocrit changes (RPVH, Eq. 4) or from plasma volumes (RPVp, Eq. 6). For parameters of linear regression see Tab. 4.
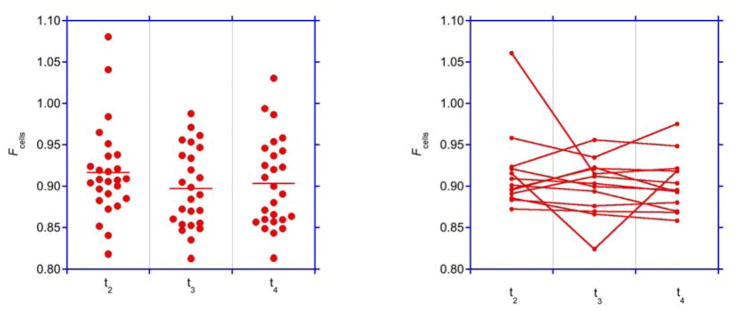
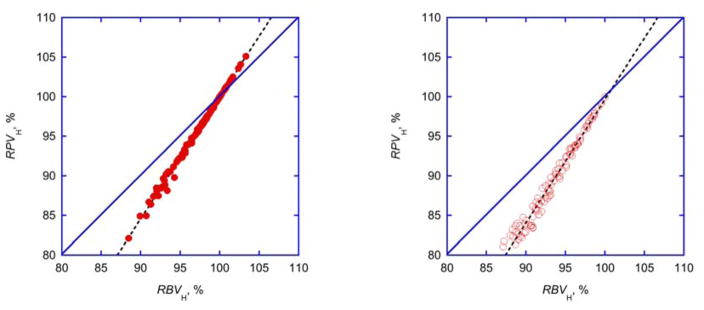
The average fraction of cells remained close to 0.9±0.05 throughout dialysis and (except for one outlier) did not change for the average treatment in individual subjects (Fig. 3, Tab. 3). Relative plasma and blood volumes where almost perfectly correlated (Fig. 4, Tab. 4).
Fig. 3. Fraction of cells.
Fraction of cells (Fcells) at times t2, t3, and t4 assuming an initial Fcell=0.9 at time t1. Left panel: individual and average data indicated by bars. Right panel: Average data from repeated measurements obtained in each patient.
Fig. 4. Comparison of relative volumes.
Identity plots of relative plasma (RPVH) and blood volumes (RBVH) calculated from hematocrit changes (Eq. 4) shown for experimental (left panel) and simulated (right panel) data. Simulated data (n=100, open symbols) were derived from evenly distributed random baseline hematrocrit (30<H0<45%) and an evenly distributed random hematocrit increase (0<(H-H0)<5%). Linear regressions are shown as broken lines. For parameters of linear regressions see Tab. 4.
Discussion
This study shows that a) ICG dilution using available on-line technology provides repeatable measures of intravascular volumes during dialysis, b) relative plasma volumes measured by independent techniques concomitantly decrease during dialysis with negligible bias but with considerable scatter, and that c) the hematocrit distribution remains stable for the average dialysis treatment delivered under everyday treatment conditions.
ICG is a classic dye used in hemodynamic studies 11, 17. ICG injected into the blood stream binds to albumin, distributes in plasma volume, and is not removed by dialysis. In absence of liver disease ICG is rapidly cleared from plasma within 20 to 30 min and excreted into bile without enterohepatic recirculation. So far, ICG has only been used in a limited number of dialysis studies either to assess liver function in intensive care patients 18, 19 or to measure absolute plasma volume during regular dialysis 20. However, the use of ICG during dialysis is greatly simplified because it can be injected and automatically measured in the extracorporeal circulation without blood sampling using available on-line technology 14.
The coefficient of variation for ICG plasma volume measurements was in the range of 6%. This is comparable to 4.1% obtained under isovolemic conditions 20 and to 5% of the reference methods 21. Part of the variation measured in the current study most likely relates to real volume changes because of ongoing ultrafiltration and vascular refilling 22. Still, to analyze relative changes during hemodialysis and ultrafiltration, and to reliably detect typical volume changes in the range of 10%, a coefficient of variation of less than 1% would be advisable. Such high repeatability is not achieved with standard indicator methods, nor is it achieved with current ICG technology.
Both absolute and relative plasma volumes decreased during dialysis but the decrease was much more significant for changes calculated from online hematocrit data (Fig. 1). This discrepancy is due to the limited repeatability of absolute volume measurements compared to the high repeatability of on-line concentration measurements in the range of 1% 1, 2.
Unlike other studies where measurements were compared to conditions before and after dialysis 23, the comparison in this study was done for corresponding time points and experimental conditions during dialysis. This has important consequences for blood volumes and concentrations. For example, the magnitude of priming solution infused while establishing the extracorporeal circulation depends on the size of the dialyzer and whether the patient is connected with or without “hemorrhage”. And the rinse-back at the end of dialysis is also variable. These uncertainties may help to explain some paradoxical observations reported elsewhere 23.
The moderate decline in plasma volume in this study is also different from the impressive decline measured by ICG dilution using repeated pulses of very high ultrafiltration rates of 3 L/h 8, 20. Revisiting the data presented in Tab. 3 of Mitra et al. 20 show that while specific ultrafiltration volume was comparable (31.5±15 mL/kg), relative plasma volume at the end of dialysis was low (75.1±8.0%) and the fraction of ultrafiltration volume refilled into the vascular space (0.52±0.22) was much lower compared to the fraction of 0.74 and 0.81 evaluated in a different study using constant ultrafiltration rates 24. The maneuver of intermittently delivering very high ultrafiltration rates apparently failed to stimulate vascular refilling which probably explains the limited success of such ultrafiltration profiles 25. The conclusions from that study regarding the increase in Fcells therefore may not be applicable to routine dialysis.
The moderate decline in plasma volume was probably also due to low ultrafiltration requirements. Specific ultrafiltration volume was around 30 mL/kg (more commonly expressed as 3%) 19 corresponding to a specific ultrafiltration rate of 7.5 mL/kg/h which is considered a low and acceptable ultrafiltration load 26, 27.
The simultaneous measurement of hematocrit and plasma volume by the same device lends itself to a comparison of relative plasma volumes computed from independent variables (Eq. 4, Eq. 6). The comparison shows identity of measures (Fig. 2, left panel) and absence of bias (Fig. 2, right panel), albeit with considerable scatter.
Again, a considerable fraction of that scatter is probably related to the limited repeatability of absolute volume measurements. A closer look, however, confirms overestimation of relative plasma volumes derived from hematocrit readings at low (negative differences), and underestimation at high relative plasma volumes (positive differences), respectively (Fig. 2, right panel). Such a relationship is expected with compensatory volume shifts of low hematocrit blood from the peripheral to the central circulation confirming previous observations, whereas identity of measures and absence of bias refutes previous observations 9. Part of the variability in this and in other studies could also be related to osmotic volume shifts between red blood cells and plasma and to different sensitivity to such shifts by different techniques 28, 29.
The simultaneous measurement of central hematocrit and plasma volume was also used to calculate the ratio of cells at different time points (Eq. 3). Surprisingly, average Fcells did not increase but remained more or less constant during dialysis. This is contrary to previous observations in dialysis 8, 9 but in line with clinical experience 21. Fairbanks et al. refer to Fcells as “… one of the most remarkable biological constants.” 21. While absolute volume estimates are indeed affected by the precise value assumed for Fcells 21, 30, 31, the stability of Fcells observed in this study is insensitive to the precise magnitude of that value. If, however, Fcells is constant, the relative blood and plasma volume change determined from central hematocrit is insensitive to Fcells as well.
The discrepancy between relative and absolute volume measurements has been held against on-line hematocrit measurements to monitor the degree of ultrafiltration induced hypovolemia during dialysis 7. However, this discrepancy becomes negligible with constant Fcells. Eq. 5 can be used to simulate relative plasma volumes with measured hemoconcentration with or without constant Fcells, and with Fcells=1 (Eq. 4) representing the single-pool assumption for hematocrit. Simulations using conditions obtained in this study show that relative plasma volumes using the single-pool assumption are almost identical with the double-pool assumption when Fcells is constant, whereas the systematic increase in Fcells from 0.9 to 1 reported elsewhere 8, 9 leads to much lower relative plasma volumes and to an overestimation of relative plasma volumes using on-line hematocrit measurements (Fig. 5).
Fig. 5. Relative plasma volume and fraction of cells.
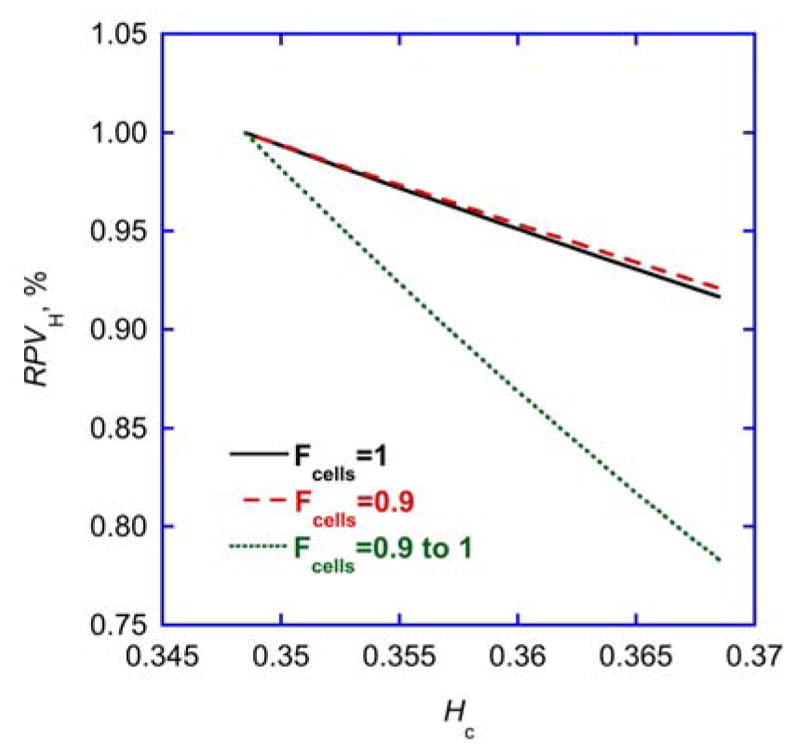
Simulation of relative plasma volumes (RPVH) derived from central hematocrit (Hc) according to Eq. 5 assuming a constant Fcells=1 (i.e. single-pool characteristics for hematocrit, full line), a constant Fcells=0.9 (i.e. steady double-pool characteristics for hematocrit, broken line), or a variable Fcells increasing from 0.9 to 1 (i.e. variable double-pool characteristics for hematocrit, dotted line), for baseline hematocrit H0 and a hematocrit increase representative of this study.
Therefore, as average Fcells did not change we conclude that relative volume measurements derived from central hematocrit data provide valid information. It appears as if the increase in Fcells observed under tight experimental control such as in Dasselaar et al. 9 or with excessive ultrafiltration rates in Mitra et al. 8 is blunted or masked under more realistic everyday experimental conditions where patients are allowed to assume a sitting position and drink a cup of coffee during dialysis. Such conditions causing peripheral sequestration of blood are likely to blunt and mask the compensatory shift of plasma-rich blood from the compliant microvasculature to central compartments 32, 33. This is also the reason why eating and sitting during dialysis is discouraged with imminent hypotensive complications 34.
The comparison of relative blood and plasma volumes derived from central hematocrit readings using Eq. 4 provides a close to perfect linear relationship, independent of variable or constant Fcells. This statistical relationship is not immediately evident from Eq. 4. The simulation with a wider range of hematocrit data provides an identical relationship. With intercept and slope (Tab. 4) obtained from the linear regression it is therefore possible to translate relative blood volumes into relative plasma volumes. This could be helpful to correct plasma concentrations for the effect of hemoconcentration (or hemodilution) when hematocrit data are no longer available 35. The relationship between relative blood and plasma volumes described in Eq. 4 is certainly different from the relationship RPV=1-H0/H proposed elsewhere 36.
In conclusion, there appears to be no discrepancy between relative volumes with moderate ultrafiltration requirements under everyday treatment conditions because Fcells remains stable for the average dialysis treatment. There is, however, considerable scatter for individual Fcells, part of which is due to the limited repeatability of absolute volume measurements and to the variability of everyday treatment conditions.
Acknowledgments
We wish to thank E. Eichmann, H. Griessner, and E. Zierler for excellent technical help with the studies. V.S. is supported by grants from the Austrian Science Foundation (P24362-B23 and P23532-B18). Y.C. is supported by the National Institute of Diabetes and Digestive and Kidney Diseases of the National Institutes of Health under Award Number K25DK09600601. The content of this article is solely the responsibility of the authors and does not necessarily represent the official views of the National Institutes of Health.
Footnotes
DISCLOSURE
Nothing to disclose. For funding information, see “The Global Forum on Home Hemodialysis: Sponsorship and Disclosure Statements.”
Bibliography
- 1.Schneditz D, Kenner T, Heimel H, Stabinger H. A sound speed sensor for the measurement of total protein concentration in disposable, blood perfused tubes. J Acoust Soc Am. 1989;86:2073–2080. [Google Scholar]
- 2.Steuer RR, Harris DH, Conis JM. A new optical technique for monitoring hematocrit and circulating blood volume: Its application in renal dialysis. Dialysis & Transplant. 1993;22:260–265. [Google Scholar]
- 3.Mancini E, Santoro A, Spongano M, Paolini F, Rossi M, Zucchelli P. Continuous on-line optical absorbance recording of blood volume changes during hemodialysis. Artif Organs. 1993;17(Aug):691–694. doi: 10.1111/j.1525-1594.1993.tb00616.x. [DOI] [PubMed] [Google Scholar]
- 4.Yoshida I, Ando K, Ando Y, Ookawara S, Suzuki M, Furuya H, et al. A new device to monitor blood volume in hemodialysis patients. Ther Apher Dial. 2010;14:560–565. doi: 10.1111/j.1744-9987.2010.00845.x. [DOI] [PubMed] [Google Scholar]
- 5.Paolini F, Bosetto A. Biofeedback systems architecture. Adv Ren Replace Ther. 1999;6:255–264. doi: 10.1016/s1073-4449(99)70021-x. [DOI] [PubMed] [Google Scholar]
- 6.Krämer M. New strategies for reducing intradialytic symptoms. Semin Dial. 1999;12:389–395. [Google Scholar]
- 7.Dasselaar JJ, van der Sande FM, Franssen CFM. Critical evaluation of blood volume measurements during hemodialysis. Blood Purif. 2012;33(1–3):177–182. doi: 10.1159/000334142. [DOI] [PubMed] [Google Scholar]
- 8.Mitra S, Chamney PW, Greenwood RN, Farrington K. The relationship between systemic and whole-body hematocrit is not constant during ultrafiltration on hemodialysis. J Am Soc Nephrol. 2004;15:463–469. doi: 10.1097/01.asn.0000108970.48370.33. [DOI] [PubMed] [Google Scholar]
- 9.Dasselaar JJ, Lub-de Hooge MN, Pruim J, Nijnuis H, Wiersum A, de Jong PE, et al. Relative blood volume changes underestimate total blood volume changes during hemodialysis. Clin J Am Soc Nephrol. 2007;2(4):669–674. doi: 10.2215/CJN.00880207. [DOI] [PubMed] [Google Scholar]
- 10.Schneditz D, Mekaroonkamol P, Haditsch B, Stauber R. Measurement of indocyanine green dye concentration in the extracorporeal circulation. ASAIO J. 2005;51:376–378. doi: 10.1097/01.mat.0000169030.37228.82. [DOI] [PubMed] [Google Scholar]
- 11.Bradley EC, Barr JW. Determination of blood volume using indocyanine green (cardio-green) dye. Life Sci. 1968;7(17):1001–1007. doi: 10.1016/0024-3205(68)90108-2. [DOI] [PubMed] [Google Scholar]
- 12.Haller M, Brechtelsbauer H, Finsterer U, Forst H, Bein T, Briegel J, Peter K. The determination of plasma volume using indocyanine green in man. Anaesthesist. 1992;41(3):115–120. [PubMed] [Google Scholar]
- 13.Schneditz D, Kaufman AM, Polaschegg HD, Levin NW, Daugirdas JT. Cardiopulmonary recirculation during hemodialysis. Kidney Int. 1992;42:1450–1456. doi: 10.1038/ki.1992.440. [DOI] [PubMed] [Google Scholar]
- 14.Schneditz D, Haditsch B, Jantscher A, Ribitsch W, Krisper P. Absolute blood volume and hepato-splanchnic blood flow measured by indocyanine green kinetics during hemodialysis. ASAIO J. 2014;60:452–458. doi: 10.1097/MAT.0000000000000075. [DOI] [PubMed] [Google Scholar]
- 15.Meier P, Zierler KL. On the theory of the indicator-dilution method for measurement of blood flow and volume. J Appl Physiol. 1954;6:731–744. doi: 10.1152/jappl.1954.6.12.731. [DOI] [PubMed] [Google Scholar]
- 16.Ribitsch W, Schneditz D, Franssen CFM, Schilcher G, Stadlbauer V, Horina JH, Rosenkranz AR. Diabetes status determines magnitude of hepato splanchnic vasoconstriction during regular hemodialysis. 2015 doi: 10.1371/journal.pone.0145411. submitted. [DOI] [PMC free article] [PubMed] [Google Scholar]
- 17.Cherrick GR, Stein SW, Leevy CM, Davidson CS. Indocyanine green: observations on its physical properties, plasma decay, and hepatic extraction. J Clin Invest. 1960;39:592–600. doi: 10.1172/JCI104072. [DOI] [PMC free article] [PubMed] [Google Scholar]
- 18.Jakob SM, Ruokonen E, Vuolteenaho O, Lampainen E, Takala J. Splanchnic perfusion during hemodialysis: evidence for marginal tissue perfusion. Crit Care Med. 2001;29(7):1393–1398. doi: 10.1097/00003246-200107000-00015. [DOI] [PubMed] [Google Scholar]
- 19.Seibel A, Zimmerschied B, Grensemann J, Defosse J, Sakka SG. Measurement of indocyanine green plasma disappearance rate during running renal replacement therapy. Anaesth Intensive Care. 2012;40(4):733–735. [PubMed] [Google Scholar]
- 20.Mitra S, Chamney PW, Greenwood RN, Farrington K. Serial determinations of absolute plasma volume with indocyanine green during hemodialysis. J Am Soc Nephrol. 2003;14:2345–2351. doi: 10.1097/01.asn.0000082998.50730.fa. [DOI] [PubMed] [Google Scholar]
- 21.Fairbanks VF, Klee GG, Wiseman GA, Hoyer JD, Tefferi A, Petitt RM, Silverstein MN. Measurement of blood volume and red cell mass: Reexamination of Cr-51 and I-125 methods. Blood Cells Molecules Dis. 1996;22:169–186. doi: 10.1006/bcmd.1996.0024. [DOI] [PubMed] [Google Scholar]
- 22.Schneditz D, Roob JM, Oswald M, Pogglitsch H, Moser M, Kenner T. Nature and rate of vascular refilling during hemodialysis and ultrafiltration. Kidney Int. 1992;42:1425–1433. doi: 10.1038/ki.1992.437. [DOI] [PubMed] [Google Scholar]
- 23.Puri S, Park J-K, Modersitzki F, Goldfarb DS. Radioisotope blood volume measurement in hemodialysis patients. Hemodial Int. 2014;18(2):406–414. doi: 10.1111/hdi.12105. [DOI] [PubMed] [Google Scholar]
- 24.Pietribiasi M, Katzarski K, Galach M, Stachowska-Pietka J, Schneditz D, Lindholm B, Waniewski J. Kinetics of plasma refilling during hemodialysis sessions with different initial fluid status. ASAIO J. 2015 doi: 10.1097/MAT.0000000000000206. http://dx.doi.org/10.1097/mat.0000000000000206 Publish Ahead of Print. [DOI] [PubMed]
- 25.Donauer J, Kolblin D, Bek M, Krause A, Bohler J. Ultrafiltration profiling and measurement of relative blood volume as strategies to reduce hemodialysis-related side effects. Am J Kidney Dis. 2000;36(1):115–123. doi: 10.1053/ajkd.2000.8280. [DOI] [PubMed] [Google Scholar]
- 26.Yashiro M, Kamata T, Segawa H, Murakami T, Kadoya Y, Muso E. How does higher ultrafiltration within the conventional clinical range impact the volume status of hemodialysis patients? Blood Purif. 2009;27(3):253–260. doi: 10.1159/000202004. [DOI] [PubMed] [Google Scholar]
- 27.Movilli E, Gaggia P, Zubani R, Camerini C, Vizzardi V, Parrinello G, et al. Association between high ultrafiltration rates and mortality in uraemic patients on regular haemodialysis. A 5-year prospective observational multicentre study. Nephrol Dial Transplant. 2007;22(12):3547–3552. doi: 10.1093/ndt/gfm466. [DOI] [PubMed] [Google Scholar]
- 28.Kron S, Wenkel R, Leimbach T, Aign S, Kron J. Effects of sodium on measuring relative blood volume during hemodialysis differ by techniques. ASAIO J. 2013;59(6):612–616. doi: 10.1097/MAT.0b013e3182a4b45e. [DOI] [PubMed] [Google Scholar]
- 29.Schneditz D, Schilcher G, Ribitsch W, Zierler E, Jantscher A. Sensitivity of hematocrit to osmotic effects induced by changes in dialysate conductivity: Implications for relative blood volume measurement and control. ASAIO J. 2015 doi: 10.1097/MAT.0000000000000056. http://dx.doi.org/10.1097/mat.0000000000000056 Publish Ahead of Print. [DOI] [PubMed]
- 30.Dworkin HJ, Premo M, Dees S. Comparison of red cell and whole blood volume as performed using both Chromium-51-tagged red cells and Iodine-125-tagged albumin and using I-131-tagged albumin and extrapolated red cell volume. Am J Med Sci. 2007;334(1):37–40. doi: 10.1097/MAJ.0b013e3180986276. [DOI] [PubMed] [Google Scholar]
- 31.Balga I, Solenthaler M, Furlan M. Should whole-body red cell mass be measured or calculated? Blood Cells, Molecules, and Diseases. 2000;26(1):25–31. doi: 10.1006/bcmd.2000.0272. [DOI] [PubMed] [Google Scholar]
- 32.Shibagaki Y, Takaichi K. Significant reduction of the large-vessel blood volume by food intake during hemodialysis. Clin Nephrol. 1998;49(1):49–54. [PubMed] [Google Scholar]
- 33.Ookawara S, Suzuki M, Yahagi T, Saitou M, Tabei K. Effect of postural change on blood volume in long-term hemodialysis patients. Nephron. 2001;87:27–34. doi: 10.1159/000045881. [DOI] [PubMed] [Google Scholar]
- 34.Reilly RF. Attending rounds: a patient with intradialytic hypotension. Clin J Am Soc Nephrol. 2014 doi: 10.2215/CJN.09930913. [DOI] [PMC free article] [PubMed] [Google Scholar]
- 35.Schneditz D, Putz-Bankuti C, Ribitsch W, Schilcher G. Correction of plasma concentrations for effects of hemoconcentration or hemodilution. ASAIO J. 2012;58(2):160–162. doi: 10.1097/MAT.0b013e318243660f. [DOI] [PubMed] [Google Scholar]
- 36.Sinha AD, Light RP, Agarwal R. Relative plasma volume monitoring during hemodialysis aids the assessment of dry weight. Hypertension. 2010;55(2):305–311. doi: 10.1161/HYPERTENSIONAHA.109.143974. [DOI] [PMC free article] [PubMed] [Google Scholar]


