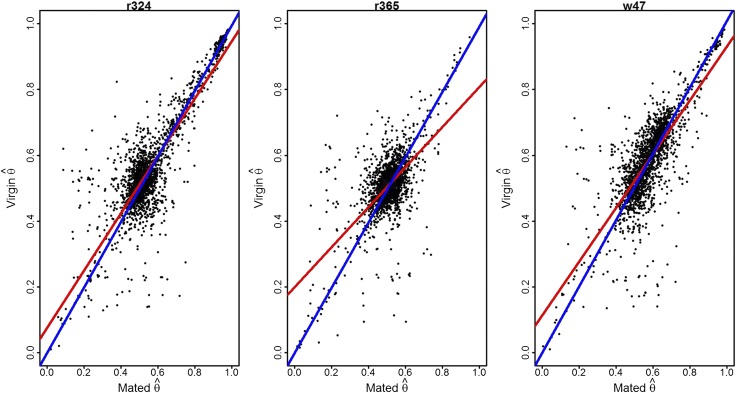
Figure 3.
Estimates of AI in the mated vs. virgin environment. Three lines (r324, r365, and w47) were selected at random. for the mated environment (x-axis) and the virgin environment (y-axis) for all exons was evaluated. Each exon is a point on the graph. Estimates of AI are remarkably similar between mated and virgin environments. The red line in the panels is a regression while the blue line has an intercept of (0, 0).

