Abstract
Two-locus sampling probabilities have played a central role in devising an efficient composite-likelihood method for estimating fine-scale recombination rates. Due to mathematical and computational challenges, these sampling probabilities are typically computed under the unrealistic assumption of a constant population size, and simulation studies have shown that resulting recombination rate estimates can be severely biased in certain cases of historical population size changes. To alleviate this problem, we develop here new methods to compute the sampling probability for variable population size functions that are piecewise constant. Our main theoretical result, implemented in a new software package called LDpop, is a novel formula for the sampling probability that can be evaluated by numerically exponentiating a large but sparse matrix. This formula can handle moderate sample sizes () and demographic size histories with a large number of epochs (). In addition, LDpop implements an approximate formula for the sampling probability that is reasonably accurate and scales to hundreds in sample size (). Finally, LDpop includes an importance sampler for the posterior distribution of two-locus genealogies, based on a new result for the optimal proposal distribution in the variable-size setting. Using our methods, we study how a sharp population bottleneck followed by rapid growth affects the correlation between partially linked sites. Then, through an extensive simulation study, we show that accounting for population size changes under such a demographic model leads to substantial improvements in fine-scale recombination rate estimation.
Keywords: coalescent with recombination, two-locus Moran model, sampling probability, importance sampling
THE coalescent with recombination (Griffiths and Marjoram 1997) provides a basic population genetic model for recombination. For a very small number of loci and a constant population size, the likelihood (or sampling probability) can be computed via a recursion (Golding 1984; Ethier and Griffiths 1990; Hudson 2001) or importance sampling (Fearnhead and Donnelly 2001), allowing for maximum-likelihood and Bayesian estimates of recombination rates (Fearnhead and Donnelly 2001; Hudson 2001; McVean et al. 2002; Fearnhead et al. 2004; Fearnhead and Smith 2005; Fearnhead 2006).
Jenkins and Song (2009, 2010) recently introduced a new framework based on asymptotic series (in inverse powers of the recombination rate ρ) to approximate the two-locus sampling probability under a constant population size and developed an algorithm for finding the expansion to an arbitrary order (Jenkins and Song 2012). They also proved that only a finite number of terms in the expansion are needed to obtain the exact two-locus sampling probability as an analytic function of ρ. Bhaskar and Song (2012) partially extended this approach to an arbitrary number of loci and found closed-form formulas for the first two terms in an asymptotic expansion of the multilocus sampling distribution.
When there are more than a handful of loci, computing the sampling probability becomes intractable. A popular and tractable alternative has been to construct composite likelihoods by multiplying the two-locus likelihoods for pairs of SNPs; this pairwise composite likelihood has been used to estimate fine-scale recombination rates in humans (International HapMap Consortium 2007; 1000 Genomes Project Consortium 2010), Drosophila (Chan et al. 2012), chimpanzees (Auton et al. 2012), microbes (Johnson and Slatkin 2009), dogs (Auton et al. 2013), and more and was used in the discovery of a DNA motif associated with recombination hotspots in some organisms, including humans (Myers et al. 2008), subsequently identified as a binding site of the protein PRDM9 (Baudat et al. 2010; Berg et al. 2010; Myers et al. 2010).
The pairwise composite likelihood was first suggested by Hudson (2001). The software package LDhat (McVean et al. 2004; Auton and McVean 2007) implemented the pairwise composite likelihood and embedded it within a Bayesian MCMC algorithm for inference. Chan et al. (2012) modified this algorithm in their program LDhelmet to efficiently utilize the aforementioned asymptotic formulas for the sampling probability, among other improvements. The program LDhot (Myers et al. 2005; Auton et al. 2014) uses the composite likelihood as a test statistic to detect recombination hotspots, in conjunction with coalescent simulation to determine appropriate null distributions.
Because of mathematical and computational challenges, LDhat, LDhelmet, and LDhot all assume a constant population size model to compute the two-locus sampling probabilities. This is an unrealistic assumption, and it would be desirable to account for known demographic events, such as bottlenecks or population growth. Previous studies (McVean et al. 2002; Smith and Fearnhead 2005; Chan et al. 2012) have shown that incorrectly assuming constant population size can lead these composite-likelihood methods to produce biased estimates. Furthermore, Johnston and Cutler (2012) observed that a sharp bottleneck followed by rapid growth can lead LDhat to infer spurious recombination hotspots if it assumes a constant population size.
Hudson (2001) proposed Monte Carlo computation of two-locus likelihoods by simulating genealogies. While this generalizes to arbitrarily complex demographies, it would be desirable to have a deterministic formula, as naive Monte Carlo computation sometimes has difficulty approximating small probabilities.
In this article, we show how to compute the two-locus sampling probability exactly under variable population size histories that are piecewise constant. Our approach relies on the Moran model (Moran 1958; Ethier and Kurtz 1993; Donnelly and Kurtz 1999), a stochastic process closely related to the coalescent. We have implemented our results in a freely available software package, LDpop, that efficiently produces lookup tables of two-locus likelihoods under variable population size. These lookup tables can then be used by other programs that use composite likelihoods to infer recombination maps.
Our main result is an exact formula, introduced in Theorem 1, that involves exponentiating sparse m × m matrices containing nonzero entries, where under a biallelic model, with n being the sample size. We derive this formula by constructing a Moran-like process in which sample paths can be coupled with the two-locus coalescent and by applying a reversibility argument.
Theorem 1 has a high computational cost, and our implementation in LDpop can practically handle low to moderate sample sizes () on a 24-core compute server. We have thus implemented an approximate formula that is much faster and scales to sample sizes in the hundreds. This formula is computed by exponentiating a sparse matrix with nonzero entries and is based on a previous two-locus Moran process (Ethier and Kurtz 1993), which we have implemented and extended to the case of variable population size. While this formula does not give the exact likelihood, it provides a reasonable approximation and converges to the true value in an appropriate limit.
In addition to these exact and approximate formulas, LDpop also includes a highly efficient importance sampler for the posterior distribution of two-locus genealogies. This can be used to infer the genealogy at a pair of sites and also provides an alternative method for computing two-locus likelihoods. Our importance sampler is based on an optimal proposal distribution that we characterize in Theorem 2. It generalizes previous results for the constant-size case, which have been used to construct importance samplers for both the single-population, two-locus case (Fearnhead and Donnelly 2001; Dialdestoro et al. 2016) and other constant-demography coalescent scenarios (Stephens and Donnelly 2000; De Iorio and Griffiths 2004; Griffiths et al. 2008; Hobolth et al. 2008; Jenkins 2012; Koskela et al. 2015). The key ideas of Theorem 2 should similarly generalize to other contexts of importance sampling a time-inhomogeneous coalescent.
Using a simulation study, we show that using LDpop to account for demography substantially improves the composite-likelihood inference of recombination maps. We also use LDpop to gain a qualitative understanding of linkage disequilibrium by examining the statistic. Finally, we examine how LDpop scales in terms of sample size n and the number of demographic epochs. The exact formula can handle n in the tens, while the approximate formula can handle n in the hundreds. Additionally, we find that the runtime of LDpop is not very sensitive to so LDpop can handle size histories with a large number of pieces.
LDpop is freely available for download at https://github.com/popgenmethods/ldpop.
Background
Here we describe our notational convention and review some key concepts regarding the coalescent with recombination and the two-locus Moran model.
Notation
Let denote the mutation rate per locus per unit time, be the transition probabilities between alleles given a mutation, and be the set of alleles (our formulas can be generalized to but this increases the computational complexity). Let denote the recombination rate per unit time. We consider a single panmictic population, with piecewise-constant effective population sizes. In particular, we assume D pieces, with endpoints where 0 corresponds to the present and corresponds to a time in the past. The piece is assumed to have scaled population size Going backward in time, two lineages coalesce (find a common ancestor) at rate within the interval
We allow the haplotypes to have missing (unobserved) alleles at each locus and use * to denote such alleles. We denote each haplotype as having type a, b, or c, where a haplotypes are observed only at the left locus, b haplotypes are observed only at the right locus, and c haplotypes are observed at both loci. Overloading notation, we sometimes refer to the left locus as the a locus and the right locus as the b locus. We use to denote the configuration of an unordered collection of two-locus haplotypes, with denoting the number of a types with allele i, denoting the number of b types with allele j, and denoting the number of c types with alleles k and
Suppose has haplotypes of type respectively. We define the sampling probability to be the probability of sampling at time t, given that we observed haplotypes of type under the coalescent with recombination (described below).
The ancestral recombination graph and the coalescent with recombination
The ancestral recombination graph (ARG) is the multilocus genealogy relating a sample (Figure 1). The coalescent with recombination (Griffiths 1991) gives the limiting distribution of the ARG under a wide class of population models, including the Wright–Fisher model and the Moran model.
Figure 1.
An ancestral recombination graph (ARG) at two loci, labeled “a” and “b”, each with two alleles ( and ). The notations are illustrated for the configuration between the first coalescence and second recombination event. The symbol denotes a missing allele.
Let be the number of lineages at time t that are ancestral to the observed present-day sample at both loci. Similarly, let and be the number of lineages that are ancestral at only the a or b locus, respectively. Under the coalescent with recombination, is a backward-in-time Markov chain, where each c-type lineage splits (recombines) into one a and one b lineage at rate and each pair of lineages coalesces at rate within the time interval Table 1 gives the transition rates of
Table 1. Backward-in-time transition rates of within time interval under the coalescent with recombination.
| End state | Rate |
|---|---|
After sampling the history of coalescence and recombination events we drop mutations down at rate per locus, with alleles mutating according to and the alleles of the common ancestor assumed to be at the stationary distribution. This gives us a sample path where is the observed sample at the present, and is the collection of ancestral haplotypes at time t. Under this notation, the sampling probability at time t is defined as
| (1) |
Two-locus Moran model
The Moran model is a stochastic process closely related to the coalescent and plays a central role in our results. Here, we review a two-locus Moran model with recombination dynamics from Ethier and Kurtz (1993). We note that there are multiple versions of the two-locus Moran model, and in particular Donnelly and Kurtz (1999) describe a Moran model with different recombination dynamics.
The Moran model with N lineages is a finite population model evolving forward in time. In particular, let denote a collection of N two-locus haplotypes at time t (with no missing alleles). Then is a Markov chain going forward in time that changes due to mutation, recombination, and copying events.
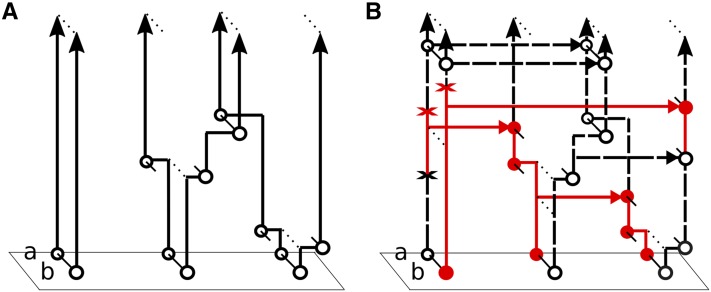
Let denote the transition matrix of within We describe the rates of For the mutation events, each allele mutates at rate according to transition matrix For the copying events, each lineage of copies its haplotype onto each other lineage at rate within the time interval Biologically, this corresponds to one lineage dying out and being replaced by the offspring of another lineage, which occurs more frequently when genetic drift is high (i.e., when the population size is small). Finally, every pair of lineages in swaps genetic material through a crossover recombination at rate A crossover between haplotypes and results in new haplotypes and and the configuration resulting from the crossover is See Figure 2 for illustration.
Figure 2.
A finite two-locus Moran model with particles. Each lineage copies itself onto every other lineage at rate Mutations arise at rate per allele per locus. Recombination follows dynamics from Ethier and Kurtz (1993): every pair of lineages experiences a crossover recombination at rate Here, the second and third lineages swap their b alleles through a crossover. The sampling probability for this model agrees with the coalescent at each locus marginally, but not jointly at both loci (although the discrepancy disappears as ).
Let be the probability of sampling at time t under this Moran model, for a configuration with sample size is given by first sampling from the stationary distribution of then propagating forward in time to t, and then sampling without replacement from So,
| (2) |
where denotes the probability of sampling without replacement from and and are row vectors here.
In general, so disagrees with the coalescent with recombination. However, the likelihood under converges to the correct value, as In fact, even for we find that provides a reasonable approximation for practical purposes (see Fine-scale recombination rate estimation and Accuracy of the approximate likelihood). We refer to (2), i.e., the likelihood under as the “approximate-likelihood formula,” in contrast to the exact formula we present in Theorem 1 below. This approximate formula is included in LDpop as a faster, more scalable alternative to the exact formula of Theorem 1.
Data availability
The authors state that all data necessary for confirming the conclusions presented in the article are represented fully within the article. Scripts to reproduce the simulated data analysis are available from the authors on request.
Theoretical Results
In this section, we describe our theoretical results. Proofs are deferred to the Appendix.
Exact formula for the sampling probability
Our main result is an explicit formula for the sampling probability presented in Theorem 1. We present an outline here; the proof is shown in the Appendix.
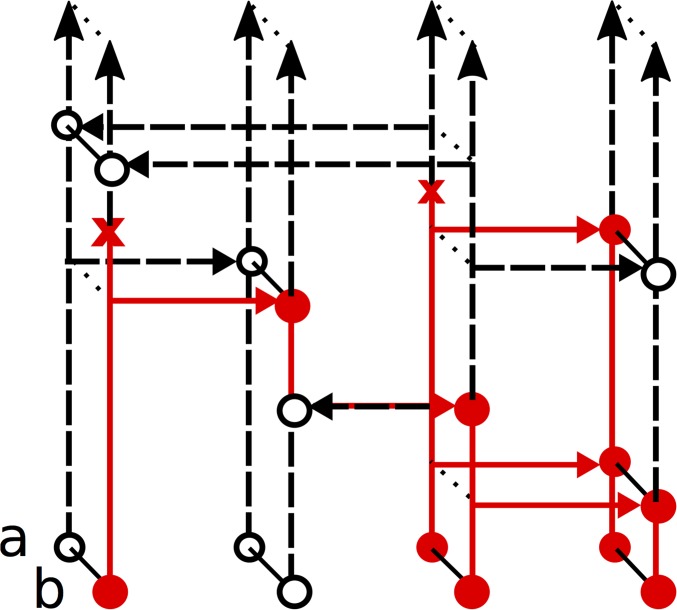
The idea is to construct a forward-in-time Markov process and relate its distribution to the coalescent with recombination. is similar to the Moran model described above, except that allows partially specified a and b types, whereas all lineages in are fully specified c types. Specifically, the state space of is the collection of sample configurations with n specified (nonmissing) alleles at each locus. The state of changes due to copying, mutation, recombination, and “recoalescence” events. Copying and mutation dynamics are similar to but recombination is different: every c type splits into a and b types at rate and every pair of a and b types “recoalesces” back into a c type at rate An illustration is shown in Figure 3B; is described in more detail in the Appendix. Within interval we denote the transition rate matrix of as a square matrix indexed by with entries given in Table 2.
Figure 3.
The process with rates (Table 2) used to prove Theorem 1. This process is similar to (Figure 2), in that n is fixed, and alleles change due to copying and mutation. However, allows partially specified a and b types, with c types recombining into a pair of a and b types, and pairs of a and b types recoalescing into c types. (A) The process of just recombination () and recoalescence () events. (B) The full process including copying, mutation, recombination, and recoalescence events.
Table 2. Nonzero entries of the rate matrix for the interval .
does not itself yield the correct sampling probability. The basic issue is that has c types splitting into a and b types at rate going forward in time, but under the coalescent with recombination, this needs to happen at rate going backward in time. Similarly, pairs of a and b types merge into a single c type at rate going forward in time under but going backward in time under the coalescent with recombination.
However, it is possible to “reverse” the direction of the recombinations () and recoalescences (), to get a new process that does match the two-locus coalescent. In particular, let be the number of c types in illustrated in Figure 3A. Then is a reversible Markov chain, whose rate matrix in is a tridiagonal square matrix indexed by with and Exploiting the reversibility of allows us to relate the distribution of to the coalescent with recombination and obtain the following result:
Theorem 1. Let be the stationary distribution of and let the row vector be indexed by with if has m lineages of type c. Denote the stationary distribution of by the row vector Let and denote component-wise multiplication and division, and recursively define the row vector by
| (3) |
Then, for we have
Note that Theorem 1 gives for This includes all fully specified i.e., with and suffices for the application considered in Fine-scale recombination rate estimation. If necessary, for partially specified can be computed by summing over the fully specified configurations consistent with
For alleles per locus, is an matrix, so naively computing the matrix multiplication in Theorem 1 would cost time. However, is sparse, with nonzero entries, allowing efficient algorithms to compute Theorem 1 (up to numerical precision) in time, where is some finite number of matrix–vector multiplications. See the Appendix for more details.
Importance sampling
In addition to the approximate (Equation 2) and exact (Equation 3) formulas for the sampling probability, LDpop includes an importance sampler for the two-locus ARG This provides a method to sample from the posterior distribution of two-locus ARGs and also provides an alternative method for computing This importance sampler is based on Theorem 2 below, which characterizes the optimal proposal distribution for the two-locus coalescent with recombination under variable population size.
Let the proposal distribution be a probability distribution on whose support contains that of Then we have
and so, if i.i.d., the sum
| (4) |
converges almost surely to as by the law of large numbers. Hence, (4) provides a Monte Carlo approximation to The optimal proposal is the posterior distribution for then (4) is exactly
even for .
The following theorem, which we prove in the Appendix, characterizes the optimal posterior distribution for variable population size:
Theorem 2. The process is a backward-in-time Markov chain with inhomogeneous rates, whose rate matrix at time t is given by
where is a square matrix, indexed by configurations with entries given by Table 3 and equal to
Table 3. Nonzero entries of the matrix of Theorem 2, for .
| (5) |
Intuitively, the matrix in Table 3 is a linear combination of two rate matrices, one for propagating an infinitesimal distance backward in time and another for propagating an infinitesimal distance forward in time. This is because is generated by sampling coalescent and recombination events backward in time, and then is generated by dropping mutations on the ARG and propagating the allele values forward in time.
Theorem 2 generalizes previous results for the optimal proposal distribution in the constant-size case (Stephens and Donnelly 2000; Fearnhead and Donnelly 2001). In that case, the conditional probability of the parent of is Note the constant-size case is time homogeneous, so the dependence on t is dropped, and the waiting times between events in the ARG are not sampled (i.e., only the embedded jump chain of is sampled).
We construct our proposal distribution by approximating the optimal proposal distribution This requires approximating the rate We use the approximation with from the approximate-likelihood Equation 2. To save computation, we compute only along a grid of time points and then linearly interpolate between the points. See the Appendix for more details on our proposal distribution
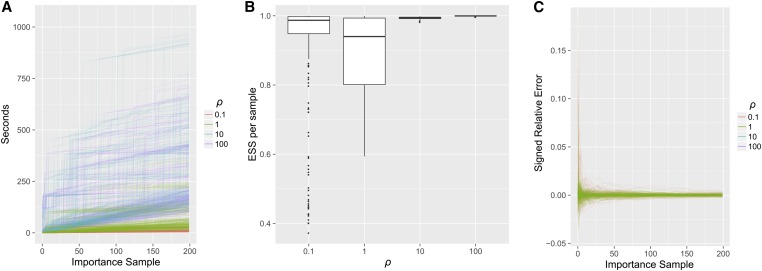
As detailed in Runtime and accuracy of the importance sampler, is a highly efficient proposal distribution, typically yielding effective sample sizes (ESS) between 80% and 100% per sample for the demography and ρ values we considered.
Application
Previous simulation studies (McVean et al. 2002; Smith and Fearnhead 2005; Chan et al. 2012) have shown that if the demographic model is misspecified, composite-likelihood methods (which so far have assumed a constant population size) can produce recombination rate estimates that are biased. Many populations, including those of humans and Drosophila melanogaster, have undergone bottlenecks and expansions in the recent past (Choudhary and Singh 1987; Gutenkunst et al. 2009), and it has been argued (Johnston and Cutler 2012) that such demographies can severely affect recombination rate estimation and can cause the appearance of spurious recombination hotspots.
In this section, we apply our software LDpop to show that accounting for demography improves fine-scale recombination rate estimation. We first examine how a population bottleneck followed by rapid growth affects the correlation between partially linked sites. We then study composite-likelihood estimation of recombination maps under a population bottleneck. We find that accounting for demography with either the exact (Theorem 1)- or approximate (Equation 2)-likelihood formula substantially improves accuracy. Furthermore, this improvement is robust to minor misspecification of the demography due to not knowing the true demography in practice.
Throughout this section, we use an example demography with epochs, consisting of a sharp population bottleneck followed by a rapid expansion. Specifically, the population size history in coalescent-scaled units, is given by
| (6) |
Under this model and the expected time of the common ancestor is We thus compare this demography against a constant-size demography with coalescent-scaled size of as this is the population size that would be estimated using the pairwise heterozygosity (Tajima 1983). We use a coalescent-scaled mutation rate of per base, which is roughly the mutation rate of D. melanogaster (Chan et al. 2012).
While the size history of (6) is fairly simple, with only epochs, we stress that LDpop can in fact handle much more complex size histories. For example, in Runtime and Accuracy of Likelihoods, we show that LDpop can easily handle a demography with with little additional cost in runtime.
Linkage disequilibrium and two-locus likelihoods
One statistic of linkage disequilibrium is
where is the fraction of the sample with haplotype with and In words, is the sample square correlation of a random allele at locus a with a random allele at locus b. We let denote the population square correlation. There has been considerable theoretical interest in understanding moments of and related statistics (Ohta and Kimura 1969; Maruyama 1982; Hudson 1985; McVean 2002; Song and Song 2007). Additionally, approximately follows a distribution when which provides a test for the statistical significance of linkage disequilibrium (Weir 1996, p. 113).
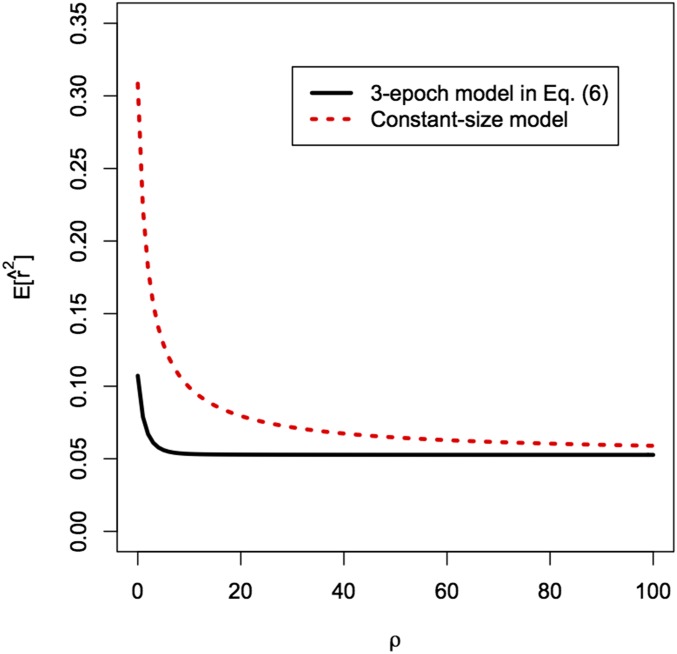
Using LDpop, we can compute the distribution of for piecewise constant models. In Figure 4, we show for a sample size under the three-epoch model (6) and the constant population size model. Under the three-epoch demography, is much lower for small ρ and decays more rapidly as In other words, the constant model requires higher ρ to break down linkage disequilibrium (LD) to the same level, which suggests that incorrectly assuming a constant demography will lead to upward-biased estimates of the recombination rate (as pointed out by an anonymous reviewer). We confirm this below.
Figure 4.
Expected linkage disequilibrium for the three-epoch model in (6) and the constant-size model with as a function of recombination rate ρ for a sample size of Under the three-epoch model, even nearby sites are expected to be quite uncorrelated.
Fine-scale recombination rate estimation
For a sample of n haplotypes observed at L SNPs, let be the two-locus sample observed at SNPs and let be the recombination rate between SNPs a and b. The programs LDhat (McVean et al. 2002, 2004; Auton and McVean 2007), LDhot (Myers et al. 2005; Auton et al. 2014), and LDhelmet (Chan et al. 2012) infer hotspots and recombination maps using the composite likelihood due to Hudson (2001),
| (7) |
where W denotes some window size in which to consider pairs of sites [a finite window size W removes the computational burden and statistical noise from distant, uninformative sites (Fearnhead 2003; Smith and Fearnhead 2005)].
We used LDpop to generate four likelihood tables, which we then used with LDhat and LDhelmet to estimate recombination maps for simulated data. The four tables, denoted by and are defined as follows:
(“Constant”) denotes a likelihood table that assumes a constant population size of
(“Exact”) denotes a likelihood table that assumes the correct three-epoch population size history η defined in (6).
(“Approximate”) denotes a likelihood table with the correct size history η in (6), but using the (much faster) approximate-likelihood Equation 2 with Moran particles.
-
(“Misspecified”) denotes a likelihood table that assumes a misspecified demography defined by
(8) which was estimated from simulated data (Appendix)
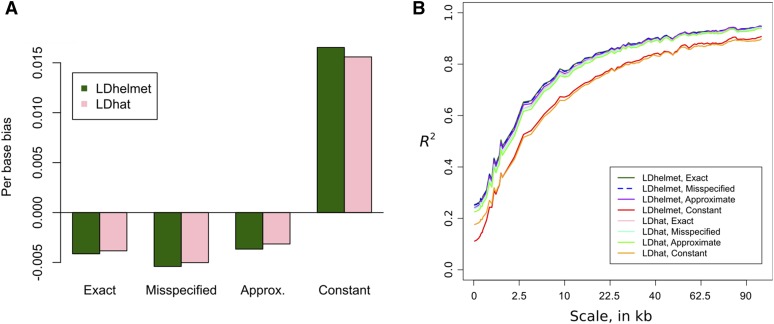
Overall, we found that using the constant table leads to very noisy and biased estimates of (as might be expected from Figure 4). The other tables and all lead to much more accurate estimates. Using (the exact-likelihood table with the true size history) produces slightly more accurate estimates of than using or However, the three nonconstant tables and all produce very similar results that are hard to distinguish from one another.
Figure 5 and Figure 6 show the accuracy of estimated recombination maps on simulated data. We simulated sequences under the three-epoch demography defined in (6), with the true maps taken from previous estimates for the X chromosome of D. melanogaster (Chan et al. 2012). In all, there were 110 independent data sets, with estimated maps of length 500 kb. See the Appendix for further details.
Figure 5.
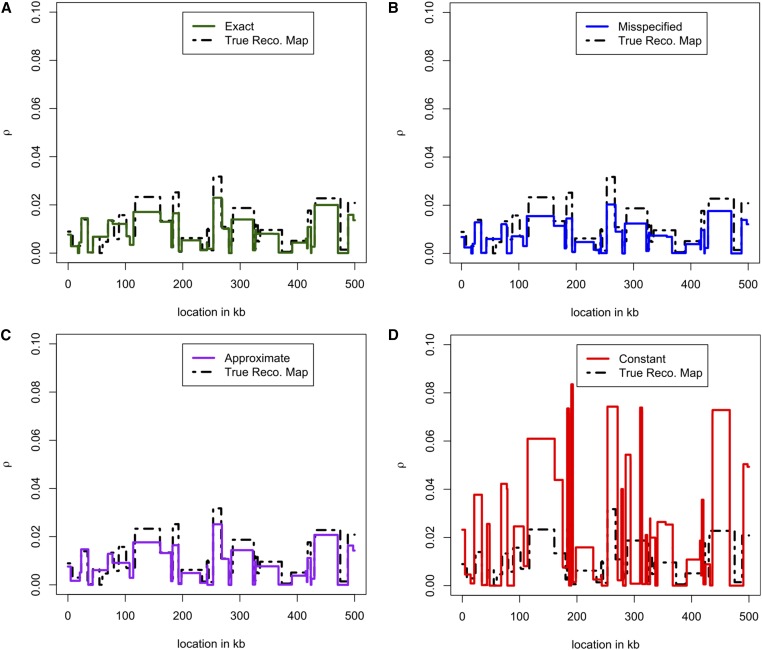
Comparison of recombination maps inferred using different lookup tables. We simulated haplotypes under the three-epoch model (6) and using the recombination map shown as a black dashed line. (A) Inferred map obtained using the exact likelihoods for the true demography. (B) Inferred map obtained using the empirically estimated demography in (8). (C) Inferred map obtained using an approximate lookup table for the true demography. (D) Inferred map obtained assuming a constant population size of Note that is much noisier than the other estimates, while using an inferred demography or an approximate lookup table results in only a very mild reduction in accuracy compared to using the true sampling probabilities. These were produced with LDhelmet; using LDhat led to very similar results.
Figure 6.
Accuracy of the estimated maps over 110 simulations similar to Figure 5. The estimate obtained assuming constant demography is substantially more biased and noisier than the other estimates. (A) The average per-base bias (B) The square Pearson correlation coefficient over different scales. This is distinct from the statistic measuring linkage disequilibrium. To compute for scale s, the middle 500-kb region of each 1-Mb simulation was divided into nonoverlapping windows of size s and we compared the average of to the average of in each window. The x-axis is stretched by
In Figure 5, we plot and for a particular 500-kb region. Qualitatively, the constant-size estimate is less accurate and has wilder fluctuations. Figure 6 shows that over all 110 replicates, the constant-size estimate has high bias and low correlation with the truth, compared to the estimates and that account for variable demography. Following Wegmann et al. (2011), we plot the correlation of with at multiple scales; at all scales, the constant-demography estimate is considerably worse than the other estimates. In general, using an inferred demography or an approximate lookup table results in only a very mild reduction in accuracy compared to using the true sampling probabilities.
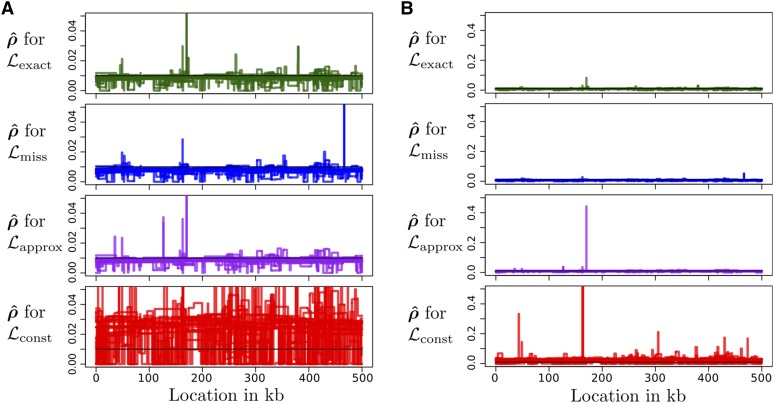
We also considered a constant (flat) map the estimated are shown in Figure 7. Consistent with Johnston and Cutler (2012), we find that the constant-demography estimate can have extreme peaks and is generally very noisy. On the other hand, the estimates that account for demography have less noise and fewer large deviations.
Figure 7.
Inferred recombination maps produced by LDhelmet using four different lookup tables (), when the true recombination rate is constant at /bp. Results for 20 simulated data sets are shown. Each simulation was done under the three-epoch demography defined in (6). Results for LDhat were very similar (not shown). (A) Inferred recombination maps (B) The same plot but zoomed out. For the figure corresponding to the highest peak reaches (not displayed), which is 250 times the true value.
Runtime and Accuracy of Likelihoods
Runtime of the exact and approximate-likelihood formulas
Both the approximate (Equation 2)- and exact-likelihood formulas (Theorem 1) require computing products for some matrix and row vector Naively, this kind of vector–matrix multiplication costs However, in our case is sparse, with nonzero entries, allowing us to compute up to numerical precision in time, where is some finite number of sparse matrix–vector products depending on (Al-Mohy and Higham 2011). In particular, for the approximate formula, whereas for the exact formula. Thus, computing the likelihood table costs and for the approximate (Equation 2) and exact (Theorem 1) formulas, respectively. See the Appendix for a more detailed analysis of the computational complexity and a description of the algorithm for computing Note that depends nontrivially on the sample size n, as well as the parameters ρ, θ, and
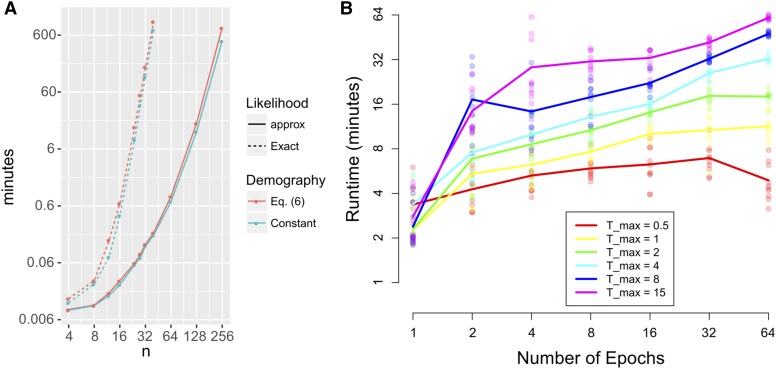
We present running times for LDpop in Figure 8. We used LDpop to generate likelihood tables with using 24 cores on a computer with 256 GB of RAM. On the three-epoch demography (Equation 6), we ran the exact formula up to (17 hr) and the approximate formula up to (13 hr). The constant demography takes nearly the same amount of time as the three-epoch demography, which agrees with our general experience that computing the initial stationary distribution is more expensive than multiplying the matrix exponentials Using faster algorithms to compute should lead to substantial improvements in runtime.
Figure 8.
Runtime of LDpop to compute a likelihood table with Experiments were performed using 24 cores on a computer with 256 GB of RAM. (A) Runtime as a function of sample size, for both the approximate and exact formulas and for two demographies [a constant-size history and the three-epoch model (6)]. (B) Runtime as a function of the number of epochs on for the exact formula with with 10 repetitions with random population sizes. Note that runtime depends more on than and grows sublinearly with (a twofold increase of yields less than a twofold increase in runtime).
Figure 8 also examines how LDpop scales with the number of epochs in the demography. We split into intervals of length each with a random population size with 10 repetitions per setting of and Empirically, LDpop scales sublinearly with and LDpop has no problem handling epochs. We also note that has a greater impact on runtime than this is because the matrix exponentials are essentially computed by solving an ordinary differential equation (ODE) from to 0, as noted in the Appendix; see Computing the action of a sparse matrix exponential.
Accuracy of the approximate likelihood
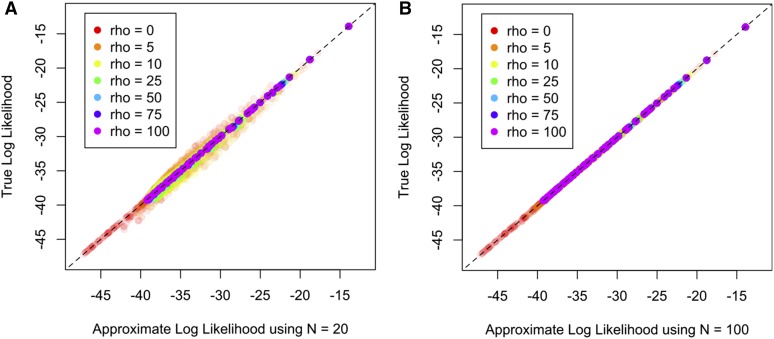
In the Fine-scale recombination rate estimation section, we found that using the approximate likelihood (Equation 2) has little impact on recombination rate estimation, suggesting that it is an accurate approximation to the exact formula in Theorem 1. We examine this in greater detail in Figure 9, for the three-epoch demography (Equation 6), and a lookup table with We compare the approximate against the exact values for and Moran particles in the approximate model. The approximate table with is reasonably accurate, with some mild deviations from the truth. The approximate table with is extremely accurate and visually indistinguishable from the true values.
Figure 9.
The approximate table plotted against the exact table for a lookup table with and under the three-epoch model in (6). (A) Moran particles. (B) Moran particles. Note that the approximate table with is extremely accurate and visually indistinguishable from the true values.
Runtime and accuracy of the importance sampler
We plot the runtime of our importance sampler in Figure 10A. For the previous three-epoch demography (Equation 6), we drew importance samples for each of the 275 configurations with with The runtime of the importance sampler generally increased with ρ; using 20 cores, sampling all 275 configurations took ∼4 min with but about 1 hr with We further analyze the computational complexity of the importance sampler in the Appendix.
Figure 10.
Accuracy and runtime of importance sampling, on the three-epoch demography (6) with and drawing 200 genealogies for each of the 275 fully specified configurations with (A) Runtime for each as a function of the number of importance samples. Higher ρ generally took a longer time. Using 20 cores, the time to sample all 275 configurations took ∼4 min when but 1 hr for (B) The ESS per importance sample, for each configuration (C) The signed relative error of as a function of the number of importance samples. The true values were computed via Theorem 1.
The number K of importance samples required to reach a desired level of accuracy is typically measured with ESS,
where denotes the importance weight of the kth sample (see Equation 4). Note that always, with equality achieved only if the have 0 variance.
Compared to previous coalescent importance samplers, our proposal distribution is highly efficient. We plot the ESS per importance sample (i.e., ) in Figure 10B. Typically for the ESS is close to its optimal value, with In Figure 10C, we compare the log-likelihood estimated from importance sampling to the true value computed with Theorem 1; after importance samples, the signed relative error is well under for all
By contrast, the previous two-locus importance sampler of Fearnhead and Donnelly (2001), which assumes a constant population size, achieves ESS anywhere between and depending on (result not shown). This importance sampler is based on a similar result to that of Theorem 2, with optimal rates However, to approximate previous approaches did not use a Moran model, but followed the approach of Stephens and Donnelly (2000), using an approximate “conditional sampling distribution” (CSD). We initially tried using the CSD of Fearnhead and Donnelly (2001) and later generalizations to variable demography (Sheehan et al. 2013; Steinrücken et al. 2015), but found that importance sampling failed under population bottleneck scenarios, with the ESS repeatedly crashing to lower and lower values. Previous attempts to perform importance sampling under variable demography (Ye et al. 2013) have also encountered low ESS, although in the context of an infinite-sites model (as opposed to a two-locus model). However, Dialdestoro et al. (2016) recently devised an efficient two-locus importance sampler using the CSD approach, in conjunction with advanced importance sampling techniques. Their importance sampler allows archaic samples and is thus time inhomogeneous, but it models only constant population size histories.
Discussion
In this article, we have developed a novel algorithm for computing the exact two-locus sampling probability under arbitrary piecewise-constant demographic histories. These two-locus likelihoods can be used to study the impact of demography on LD and also to improve fine-scale recombination rate estimation. Indeed, using two-locus sampling probabilities computed under the true or an inferred demography, we were able to obtain recombination rate estimates with substantially less noise and fewer spurious peaks that could potentially be mistaken for hotspots.
We have implemented our method in a freely available software package, LDpop. This program also includes an efficient approximation to the true sampling probability that easily scales to hundreds in sample size. In practice, highly accurate approximations to the true sampling probability for sample size n can be obtained quickly by first applying the approximate algorithm with N Moran particles >n and then downsampling to the desired sample size n.
In principle, one could also obtain an accurate approximation to the sampling probability using our importance sampler, which is also implemented in LDpop. We have not optimized this code, however, and we believe that its main utility will be in sampling two-locus ARGs from the posterior distribution. Finally, we note that, in addition to improving the inference of fine-scale recombination rate variation, our two-locus likelihoods can be utilized in other applications such as hotspot hypothesis testing and demographic inference.
Acknowledgments
We thank the reviewers for many helpful comments that improved this manuscript. This research is supported in part by National Institutes of Health (NIH) grant R01-GM108805, NIH training grant T32-HG000047, and a Packard Fellowship for Science and Engineering.
Appendix
Proposal Distribution of Importance Sampler
For our importance sampler, we construct the proposal distribution by approximating the optimal proposal distribution given in Theorem 2. We start by choosing a grid of points and then set to be a backward-in-time Markov chain, whose rates at are the linear interpolation
| (A1) |
with the rates at the grid points given by
with an approximation to the likelihood In particular, we set using the approximate-likelihood formula (2). The approximate likelihoods can be efficiently computed along a grid of points, using the method described below (see Computing the action of a sparse matrix exponential and Complexity of importance sampler).
To sample from we note that for configuration at time t, the time of the next event has cumulative distribution function for Thus, S can be sampled by first sampling and then solving for via the quadratic formula [since is piecewise linear; see (A1)]. Having sampled S, we can then sample the next configuration with probability
Details of Simulation Study
Simulated data
We simulated independent 1-Mb segments with haplotypes under the three-epoch demography in (6). To do so, we generated trees using the program MaCS (Chen et al. 2009) and then generated mutations according to a quadraallelic mutational model. For the variable recombination maps used in Figure 5 and Figure 6, we divided the recombination map of the X chromosome of D. melanogaster from Raleigh, North Carolina inferred by Chan et al. (2012) into 22 nonoverlapping 1-Mb windows and simulated five replicates, for a total of 110 Mb of simulated data. For the constant map used in Figure 7, we generated 20 data sets with per base.
Estimation of misspecified demography
To estimate the misspecified demography of (8), we pooled all biallelic SNPs from the 110 simulated segments of the variable recombination map and then used the folded site frequency spectrum (SFS) of the simulated SNPs to estimate Specifically, we fitted by maximizing a composite likelihood, viewing each SNP as an independent draw from a multinomial distribution proportional to the expected SFS. We computed the expected SFS with the software package momi (Kamm et al. 2016) and fixed the most ancient population size to 1.0 due to scaling and identifiability issues.
Recombination map estimation
After removing all nonbiallelic SNPs, we ran both LDhat and LDhelmet on the resulting data, using a block penalty of 50 as recommended by Chan et al. (2012) for Drosophila-like data (the block penalty is a tuning parameter that is multiplied by the number of change points in the estimated map and added to the log composite likelihood; thus a high block penalty discourages overfitting). We took the posterior median inferred at each position to be the estimated map We used only the centermost 500 kb of each estimate to avoid the issue of edge effects.
Computational Complexity
Computing the action of a sparse matrix exponential
Both Theorem 1 and the approximate formula (2) rely on “the action of the matrix exponential” (Al-Mohy and Higham 2011). Let be a matrix and a row vector. We need to compute expressions of the form Naively, this kind of vector–matrix multiplication costs However, in our case will be sparse, with k nonzero entries, allowing us to more efficiently compute
In particular, we use the algorithm of Al-Mohy and Higham (2011), as implemented in the Python package scipy. For define the truncated Taylor series approximation of Then, we have
Now let so is a row vector. Then
with and evaluated in vector–matrix multiplications, each costing by the sparsity of Approximating thus costs time. Both and s are chosen automatically to bound
with defined by and the matrix norm given by To avoid numerical instability, m is also bounded by Al-Mohy and Higham (2011) provide some analysis for the size of but this analysis is rather involved. Very roughly, is proportional to (for arbitrary matrix norm ), so computing takes twice as long as computing and computing is roughly proportional to t. This is because is essentially computed by numerically integrating the ODE for
We note that and thus this algorithm approximates along a grid of points If is needed at additional points, then extra grid points can be added at those times.
Complexity of the exact-likelihood formula (Theorem 1)
We consider the computational complexity of computing via Theorem 1. Note that the formula (3) simultaneously computes for all configurations
As usual, we assume two alleles as is assumed by LDhat and the applications considered in this article. We start by considering the dimensions of the sampling probability vectors and rate matrices for intervals The set of haplotypes is so Thus, there are possible configurations with In particular, there are ways to specify and then and are determined. Thus, is a row vector of dimension and is a square matrix of dimension but is sparse, with only nonzero entries.
By using the aforementioned algorithm for computing the action of a sparse matrix exponential, we can compute from in time, where is the number of vector–matrix multiplications to compute the action of We note that the stationary distribution can be computed in steps: is the rate matrix of a simple random walk with states, so and
Similarly, the initial value can be computed via sparse vector–matrix multiplications, using the technique of power iteration. For and arbitrary positive vector with we have as In particular, we set the number of iterations, so that where is the element-wise of As noted in Runtime of the exact- and approximate-likelihood formulas, in practice we found for i.e., computing the initial stationary distribution was more expensive than multiplying the matrix exponentials
To summarize, computing for all configurations of size n costs with We caution that depends on
The memory cost of Theorem 1 is since has nonzero entries.
Comparison with Golding’s equations
Under constant population size, Golding (1984) proposed a method to compute by solving a linear system of equations where is the vector of sampling probabilities indexed by the configurations with at most n alleles at each locus. Hudson (2001) solves this linear system, costing where (as above) is some finite number of sparse matrix–vector multiplications.
For the case of constant population size, Theorem 1 reduces to solving a sparse system which is similar in spirit to solving Golding’s equations The runtime of Theorem 1 at first seems superior to the runtime of Golding’s equations, but in fact the number of matrix multiplications is not comparable between the two methods. Most importantly, Hudson (2001) exploits the structure of the equations to decompose them into smaller subsystems of equations, which may lead to smaller Algorithmic details also lead to important differences: we use power iteration, whereas Hudson (2001) uses a conjugate gradient method, with less stringent convergence criteria (stopping when the relative error for each subsystem of equations is ).
Preliminary tests suggest that the C code of Hudson (2001) and a similar implementation by Chan et al. (2012) are faster than our current method for solving We are planning future updates to LDpop that will speed up the initial stationary distribution either by changing the algorithmic details of our solver or by using Golding’s equations to compute instead.
Complexity of approximate-likelihood formula
The method of computing the approximate-likelihood formula (2) is similar to computing Theorem 1, in that we can compute an initial stationary distribution by power iteration and then propagate it forward in time by applying the action of the sparse matrix exponential However, instead of states, there are total states: there are four possible fully specified haplotypes and thus the requirement that the number of lineages sums to N yields possible states for the Moran model Thus, computing the approximate-likelihood formula (2) costs time and memory space.
Complexity of importance sampler
Here we examine the computational complexity of our importance sampler.
To construct the proposal distribution described in Proposal Distribution of Importance Sampler, we must compute approximate likelihoods defined by (2) along a grid of points We start by computing the Moran likelihoods using the action of the sparse matrix exponential. As discussed above, the method of Al-Mohy and Higham (2011) yields as a by-product of computing at essentially no extra cost. Thus, computing the terms costs (absorbing the minor cost of an additional J extra grid points into ).
We then compute by subsampling from as in (2) and thus set since is the maximum number of individuals in (because each of the original n lineages can recombine into two lineages). However, it is inefficient to compute by subsampling for every value of separately. Instead, it is better to use a dynamic program where the sum is over all configurations obtained by adding an additional sample to
This costs time and space, since there are J grid points and possible configurations of Then, assuming a reasonably efficient proposal, the expected cost to draw K importance samples is since the expected number of coalescence, mutation, and recombination events before reaching the marginal common ancestor at each locus is (Griffiths 1991). This approach thus takes expected time to compute for all possible In practice, we precomputed only for the fully specified (without missing alleles), but computed and cached as needed for partially specified (with missing alleles). The theoretical running time to compute the full lookup table is still but in practice, many values of are highly unlikely and never encountered at each
Proofs
For a stochastic process we denote its partial sample paths with the following notation: and
Proof of Theorem 1
We start by constructing a forward-in-time Markov jump process with state space changes due to four types of events: mutation, copying, recoalescence, and “recombination”:
Individual alleles mutate at rate according to transition matrix
Lineages copy their alleles onto each other, with the rate depending on the lineage type. Each pair of a types experiences a copying event at rate with the direction of copying chosen with probability The rates are the same for every pair of b and every pair of c types. Pairs of and types also experience copying at rate however, the direction of copying is always from the c type to the a or b type and happens only at one allele (left for a, right for b).
a types do not copy onto b types, and vice versa. Instead, they merge (recoalesce) into a single c type at rate per pair. Note this is similar to the coalescent, but here the recoalescence happens forward in time rather than backward in time.
Each c type splits into a and b types at rate Again, this is similar to the coalescent; however, here the recombination happens forward in time, while in the coalescent with recombination it happens at rate going backward in time.
Then has forward-in-time rate matrix in with given in Table 2.
Now let denote the number of c types in (so the numbers of a and b types are each ). Note that is unaffected by mutation and copying events, and so is conditionally independent of given for Thus is a Markov jump process with rate matrix in where is a tridiagonal square matrix indexed by with and
We can therefore sample in two steps, as illustrated in Figure 3:
First, sample the recoalescence and recombination events. In other words, sample using its rate matrices
-
Next, sample from For can be obtained from and by superimposing two Poisson point processes, conditionally independent given
a point process of directed edges between lineages (the copying events), with rate for edges and rate for edges, and (b) a point process of mutations hitting the lineages, at rate per locus per lineage.
To see that this superpositioning of point processes yields the correct distribution note that mutation and copying events do not affect the rates of recombination and recoalescence events and that the four types of jump events that make up the Markov jump process occur at the desired rates given by
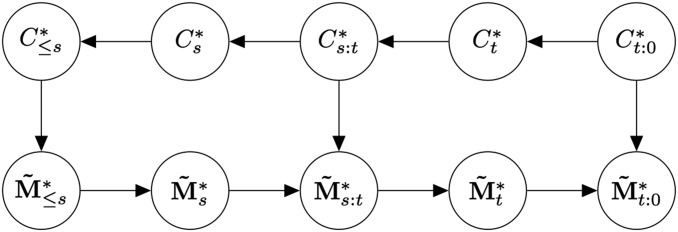
Now define to be the backward-in-time Markov chain with rates in (whereas has the same rates but going forward in time). Let be the stochastic process with conditional law Thus can be sampled in the same two steps as except the first step (coalescences and recombinations) is backward in time. We illustrate the conditional independence structure of and via a directed graphical model (Koller and Friedman 2009) in Figure A1. [A graphical model is a graph whose vertices represent random variables, with the property that if all paths between and pass through W, then there is conditional independence ].
We next show that for with
| (A2) |
We use a similar argument as in Durrett (2008, theorem 1.30, p. 47), tracing the genealogy of backward in time (Figure 3B). Under recombination events occur backward in time at rate per c-type lineage, as in the coalescent. Likewise, coalescence between an a and a b type occurs at the usual rate Next, note that copying events between ancestral lineages induce coalescences within the ARG; these are encountered as a Poisson point process at rate per ancestral pair not of type Thus, the embedded ARG is distributed as the coalescent with recombination. Finally, conditioning on the full history of recombination, copying, and coalescence events, we can drop down mutations as a Poisson point process with rate per locus per lineage, and so the ARG with mutations follows the coalescent with recombination and mutation. Note that the alleles at the common ancestors of each locus follow the stationary distribution: the common ancestors are fixed under the conditioning (of recombination, copying, and coalescence events), and if is the conditional distribution of an ancestral allele at time then for sending yields the stationary distribution.
Having established (A2), we next observe
| (A3) |
Note that in the second equality, we use the conditional independence of and given which follows from the graphical model of Figure A1 by setting and
Next, note that is the transition matrix of a simple random walk with bounded state space and no absorbing states and thus is reversible. Thus, with the stationary distribution of
| (A4) |
Recall that we defined So plugging (A4) into (A3) yields
which proves half of the desired result; i.e., where To show the other half, that where is the stationary distribution of we simply note that for all
where the second equality follows by reversibility of which implies and thus
Proof of Theorem 2
We first check that for and so is a backward-in-time Markov chain.
Recall that we generate as a backward-in-time Markov chain and then generate by dropping down mutations forward in time. The conditional independence structure of is thus described by the directed graphical model (Koller and Friedman 2009) in Figure A2.
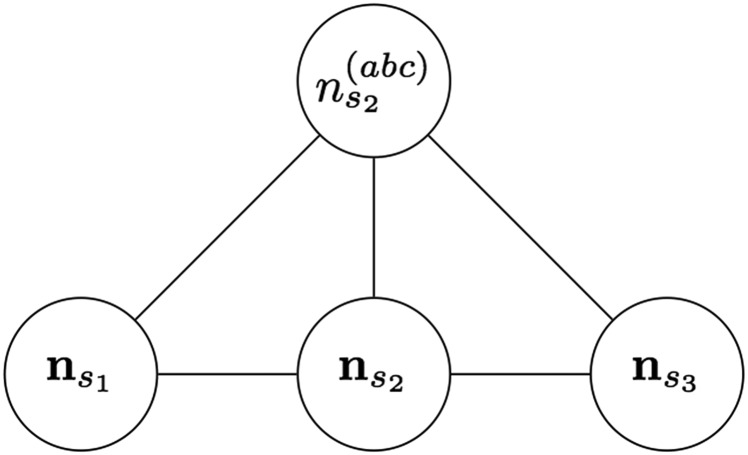
Doing moralization and variable elimination (Koller and Friedman 2009) on Figure A2 results in the undirected graphical model in Figure A3. The graphical model of Figure A3 then implies
where the second equality follows because is a deterministic function of Thus, is a backward-in-time Markov chain.
We next compute the backward-in-time rates for the Markov chain at time t. Starting from the definition of
where the penultimate equality follows from the product rule and the definition of in (5).
The specific entries of listed in Table 3 can be obtained by applying the product rule to (5) and noting that and are, respectively, the backward-in-time rates of (as listed in Table 1) and the forward-in-time rates for dropping mutations on
Figure A1.
Probabilistic graphical model for the processes and with Random variables are represented as vertices, and the edges encode conditional independence relationships. Specifically, if all paths between and pass through W, then there is conditional independence
Figure A2.
Probabilistic graphical model for the coalescent with recombination and mutation, with
Figure A3.
Undirected graphical model, after moralization and variable elimination on Figure A2. We add edges to form cliques on the left and right sides of and then eliminate all the variables except the ones pictured here.
Footnotes
Communicating editor: J. D. Wall
Literature Cited
- Al-Mohy A. H., Higham N. J., 2011. Computing the action of the matrix exponential, with an application to exponential integrators. SIAM J. Sci. Comput. 33(2): 488–511. [Google Scholar]
- Auton A., McVean G., 2007. Recombination rate estimation in the presence of hotspots. Genome Res. 17: 1219–1227. [DOI] [PMC free article] [PubMed] [Google Scholar]
- Auton A., Fledel-Alon A., Pfeifer S., Venn O., Ségurel L., et al. , 2012. A fine-scale chimpanzee genetic map from population sequencing. Science 336: 193–198. [DOI] [PMC free article] [PubMed] [Google Scholar]
- Auton A., Li Y. R., Kidd J., Oliveira K., Nadel J., et al. , 2013. Genetic recombination is targeted towards gene promoter regions in dogs. PLoS Genet. 9: e1003984. [DOI] [PMC free article] [PubMed] [Google Scholar]
- Auton, A., S. Myers, and G. McVean, 2014 Identifying recombination hotspots using population genetic data. arXiv preprint. Available at: http://arxiv.org/abs/1403.4264.
- Baudat F., Buard J., Grey C., Fledel-Alon A., Ober C., et al. , 2010. PRDM9 is a major determinant of meiotic recombination hotspots in humans and mice. Science 327: 836–840. [DOI] [PMC free article] [PubMed] [Google Scholar]
- Berg I. L., Neumann R., Lam K. G., Sarbajna S., Odenthal-Hesse L., et al. , 2010. PRDM9 variation strongly influences recombination hot-spot activity and meiotic instability in humans. Nat. Genet. 42: 859–863. [DOI] [PMC free article] [PubMed] [Google Scholar]
- Bhaskar A., Song Y. S., 2012. Closed-form asymptotic sampling distributions under the coalescent with recombination for an arbitrary number of loci. Adv. Appl. Probab. 44: 391–407. [DOI] [PMC free article] [PubMed] [Google Scholar]
- Chan A. H., Jenkins P. A., Song Y. S., 2012. Genome-wide fine-scale recombination rate variation in Drosophila melanogaster. PLoS Genet. 8: e1003090. [DOI] [PMC free article] [PubMed] [Google Scholar]
- Chen G. K., Marjoram P., Wall J. D., 2009. Fast and flexible simulation of DNA sequence data. Genome Res. 19: 136–142. [DOI] [PMC free article] [PubMed] [Google Scholar]
- Choudhary M., Singh R., 1987. Historical effective size and the level of genetic diversity in Drosophila melanogaster and Drosophila pseudoobscura. Biochem. Genet. 25: 41–51. [DOI] [PubMed] [Google Scholar]
- De Iorio M., Griffiths R. C., 2004. Importance sampling on coalescent histories. I. Adv. Appl. Probab. 36: 417–433. [Google Scholar]
- Dialdestoro K., Sibbesen J. A., Maretty L., Raghwani J., Gall A., et al. , 2016. Coalescent inference using serially sampled, high-throughput sequencing data from intra-host HIV infection. Genetics 203:@@@ [DOI] [PMC free article] [PubMed] [Google Scholar]
- Donnelly P., Kurtz T. G., 1999. Genealogical processes for Fleming-Viot models with selection and recombination. Ann. Appl. Probab. 9: 1091–1148. [Google Scholar]
- Durrett R., 2008. Probability Models for DNA Sequence Evolution, Ed. 2 Springer-Verlag, New York. [Google Scholar]
- Ethier S. N., Griffiths R. C., 1990. On the two-locus sampling distribution. J. Math. Biol. 29: 131–159. [Google Scholar]
- Ethier S. N., Kurtz T. G., 1993. Fleming-Viot processes in population genetics. SIAM J. Contr. Optim. 31: 345–386. [Google Scholar]
- Fearnhead P., 2003. Consistency of estimators of the population-scaled recombination rate. Theor. Popul. Biol. 64: 67–79. [DOI] [PubMed] [Google Scholar]
- Fearnhead P., 2006. SequenceLDhot: detecting recombination hotspots. Bioinformatics 22: 3061–3066. [DOI] [PubMed] [Google Scholar]
- Fearnhead P., Donnelly P., 2001. Estimating recombination rates from population genetic data. Genetics 159: 1299–1318. [DOI] [PMC free article] [PubMed] [Google Scholar]
- Fearnhead P., Smith N. G. C., 2005. A novel method with improved power to detect recombination hotspots from polymorphism data reveals multiple hotspots in human genes. Am. J. Hum. Genet. 77: 781–794. [DOI] [PMC free article] [PubMed] [Google Scholar]
- Fearnhead P., Harding R. M., Schneider J. A., Myers S., Donnelly P., 2004. Application of coalescent methods to reveal fine-scale rate variation and recombination hotspots. Genetics 167: 2067–2081. [DOI] [PMC free article] [PubMed] [Google Scholar]
- Golding G. B., 1984. The sampling distribution of linkage disequilibrium. Genetics 108: 257–274. [DOI] [PMC free article] [PubMed] [Google Scholar]
- Griffiths, R., 1991 The two-locus ancestral graph, pp. 100-117 in Selected Proceedings of the Sheffield Symposium on Applied Probability, (IMS Lecture Notes–Monograph Series, Vol. 18, edited by I. V. Basawa and R. L. Taylor. Institute of Mathematical Statistics, Hayward, California. [Google Scholar]
- Griffiths R. C., Marjoram P., 1997. An ancestral recombination graph, pp. 257–270 in Progress in Population Genetics and Human Evolution, Vol. 87, edited by Donnelly P., Tavaré S. Springer-Verlag, Berlin. [Google Scholar]
- Griffiths R. C., Jenkins P. A., Song Y. S., 2008. Importance sampling and the two-locus model with subdivided population structure. Adv. Appl. Probab. 40: 473–500. [DOI] [PMC free article] [PubMed] [Google Scholar]
- Gutenkunst R. N., Hernandez R. D., Williamson S. H., Bustamante C. D., 2009. Inferring the joint demographic history of multiple populations from multidimensional SNP frequency data. PLoS Genet. 5: e1000695. [DOI] [PMC free article] [PubMed] [Google Scholar]
- Hobolth A., Uyenoyama M., Wiuf C., 2008. Importance sampling for the infinite sites model. Stat. Appl. Genet. Mol. Biol. 7: 32. [DOI] [PMC free article] [PubMed] [Google Scholar]
- Hudson R., 2001. Two-locus sampling distributions and their application. Genetics 159: 1805–1817. [DOI] [PMC free article] [PubMed] [Google Scholar]
- Hudson R. R., 1985. Sampling distribution of linkage disequilibrium under an infinite allele model without selection. Genetics 109: 611–631. [DOI] [PMC free article] [PubMed] [Google Scholar]
- International HapMap Consortium , 2007. A second generation human haplotype map of over 3.1 million SNPs. Nature 449: 851–861. [DOI] [PMC free article] [PubMed] [Google Scholar]
- Jenkins P., 2012. Stopping-time resampling and population genetic inference under coalescent models. Stat. Appl. Genet. Mol. Biol. 11: 1–20. [DOI] [PMC free article] [PubMed] [Google Scholar]
- Jenkins P. A., Song Y. S., 2009. Closed-form two-locus sampling distributions: accuracy and universality. Genetics 183: 1087–1103. [DOI] [PMC free article] [PubMed] [Google Scholar]
- Jenkins P. A., Song Y. S., 2010. An asymptotic sampling formula for the coalescent with recombination. Ann. Appl. Probab. 20: 1005–1028. [DOI] [PMC free article] [PubMed] [Google Scholar]
- Jenkins P. A., Song Y. S., 2012. Padé approximants and exact two-locus sampling distributions. Ann. Appl. Probab. 22: 576–607. [DOI] [PMC free article] [PubMed] [Google Scholar]
- Johnson P., Slatkin M., 2009. Inference of microbial recombination rates from metagenomic data. PLoS Genet. 5: e1000674. [DOI] [PMC free article] [PubMed] [Google Scholar]
- Johnston H. R., Cutler D. J., 2012. Population demographic history can cause the appearance of recombination hotspots. Am. J. Hum. Genet. 90: 774–783. [DOI] [PMC free article] [PubMed] [Google Scholar]
- Kamm J. A., Terhorst J., Song Y. S., 2016. Efficient computation of the joint sample frequency spectra for multiple populations. J. Comput. Graph. Stat. DOI: 10.1080/10618600.2016.1159212. [DOI] [PMC free article] [PubMed] [Google Scholar]
- Koller, D., and N. Friedman, 2009 Probabilistic Graphical Models: Principles and Techniques. MIT Press, Cambridge, MA. [Google Scholar]
- Koskela J., Jenkins P. A., Spano D., 2015. Computational inference beyond Kingman’s coalescent. J. Appl. Probab. 52: 519–537. [Google Scholar]
- Maruyama T., 1982. Stochastic integrals and their application to population genetics, pp. 151–166 in Molecular Evolution, Protein Polymorphism and their Neutral Theory, edited by Kimura M. Springer-Verlag, Berlin. [Google Scholar]
- McVean G., Awadalla P., Fearnhead P., 2002. A coalescent-based method for detecting and estimating recombination from gene sequences. Genetics 160: 1231–1241. [DOI] [PMC free article] [PubMed] [Google Scholar]
- McVean G., Myers S., Hunt S., Deloukas P., Bentley D., et al. , 2004. The fine-scale structure of recombination rate variation in the human genome. Science 304: 581–584. [DOI] [PubMed] [Google Scholar]
- McVean G. A. T., 2002. A genealogical interpretation of linkage disequilibrium. Genetics 162: 987–991. [DOI] [PMC free article] [PubMed] [Google Scholar]
- Moran P., 1958. Random processes in genetics. Math. Proc. Camb. Philos. Soc. 54: 60–71. [Google Scholar]
- Myers S., Bottolo L., Freeman C., McVean G., Donnelly P., 2005. A fine-scale map of recombination rates and hotspots across the human genome. Science 310: 321–324. [DOI] [PubMed] [Google Scholar]
- Myers S., Freeman C., Auton A., Donnelly P., McVean G., 2008. A common sequence motif associated with recombination hot spots and genome instability in humans. Nat. Genet. 40: 1124–1129. [DOI] [PubMed] [Google Scholar]
- Myers S., Bowden R., Tumian A., Bontrop R., Freeman C., et al. , 2010. Drive against hotspot motifs in primates implicates the PRDM9 gene in meiotic recombination. Science 327: 876–879. [DOI] [PMC free article] [PubMed] [Google Scholar]
- Ohta T., Kimura M., 1969. Linkage disequilibrium due to random genetic drift. Genet. Res. 13: 47–55. [Google Scholar]
- 1000 Genomes Project Consortium , 2010. A map of human genome variation from population-scale sequencing. Nature 467: 1061–1073. [DOI] [PMC free article] [PubMed] [Google Scholar]
- Sheehan S., Harris K., Song Y. S., 2013. Estimating variable effective population sizes from multiple genomes: a sequentially Markov conditional sampling distribution approach. Genetics 194: 647–662. [DOI] [PMC free article] [PubMed] [Google Scholar]
- Smith N. G. C., Fearnhead P., 2005. A comparison of three estimators of the population-scaled recombination rate: accuracy and robustness. Genetics 171: 2051–2062. [DOI] [PMC free article] [PubMed] [Google Scholar]
- Song Y. S., Song J. S., 2007. Analytic computation of the expectation of the linkage disequilibrium coefficient Theor. Popul. Biol. 71: 49–60. [DOI] [PubMed] [Google Scholar]
- Steinrücken, M., J. A. Kamm, and Y. S. Song, 2015 Inference of complex population histories using whole-genome sequences from multiple populations. bioRxiv preprint. Available at: http://dx.doi.org/10.1101/026591. 10.1101/026591 [DOI] [PMC free article] [PubMed]
- Stephens M., Donnelly P., 2000. Inference in molecular population genetics. J. R. Stat. Soc. B 62: 605–655. [Google Scholar]
- Tajima F., 1983. Evolutionary relationship of DNA sequences in finite populations. Genetics 105: 437–460. [DOI] [PMC free article] [PubMed] [Google Scholar]
- Wegmann D., Kessner D. E., Veeramah K. R., Mathias R. A., Nicolae D. L., et al. , 2011. Recombination rates in admixed individuals identified by ancestry-based inference. Nat. Genet. 43: 847–853. [DOI] [PMC free article] [PubMed] [Google Scholar]
- Weir B., 1996. Genetic Data Analysis II: Methods for Discrete Population Genetic Data. Sinauer Associates, Sunderland, MA. [Google Scholar]
- Ye, M., S. Nielsen, M. Nicholson, Y. Teh, P. Jenkins et al., 2013 Importance sampling under the coalescent with times and variable population. Technical Report, Department of Statistics, University of Oxford.
Associated Data
This section collects any data citations, data availability statements, or supplementary materials included in this article.
Data Availability Statement
The authors state that all data necessary for confirming the conclusions presented in the article are represented fully within the article. Scripts to reproduce the simulated data analysis are available from the authors on request.


