

Abstract
Allostery is a ubiquitous biological regulatory process in which distant binding sites within a protein or enzyme are functionally and thermodynamically coupled. Allosteric interactions play essential roles in many enzymological mechanisms, often facilitating formation of enzyme-substrate complexes and/or product release. Thus, elucidating the forces that drive allostery is critical to understanding the complex transformations of biomolecules. Currently, a number of models exist to describe allosteric behavior, taking into account energetics as well as conformational rearrangements and fluctuations. In the following review, we discuss the use of solution NMR techniques designed to probe allosteric mechanisms in enzymes. NMR spectroscopy is unequaled in its ability to detect structural and dynamical changes in biomolecules, and the case studies presented herein demonstrate the range of insights to be gained from this valuable method. We also provide a detailed technical discussion of several specialized NMR experiments that are ideally suited for the study of enzymatic allostery.
1. Introduction
Enzyme allostery is the biological phenomena that manifests when binding of a small molecule, protein, nucleic acid, H+, metal ion, or covalent post-translational modification alters the catalytic activity, by either an alteration in kcat, Km or both. The molecular mechanisms of allostery have been studied for decades, and the recognition of their importance to biological function continues to grow.1 In enzymology, allostery tightly regulates enzyme (de)activation, and therefore catalytic turnover.1 However, many of the underlying aspects of allosteric control are still poorly understood. Several models, some phenomenological2,3 and others microscopic,4-6 have described allosteric behavior in enzymes, taking into account conformational rearrangements, protein dynamics, and energetics. Still, the major challenge in the study of allostery remains the linkage between accepted paradigms and a wide variety of biological systems that are only partially explained by these principles. Although the search for a common thread among allosteric enzymes is still ongoing, a foundation for understanding allostery exists due to several major discoveries.
1.1 Hemoglobin as the Original Allosteric Protein
Though not an enzyme, studies of allostery in Hemoglobin (Hb) are illustrative of enzyme-substrate complexes in cases where the concentration of the enzyme- substrate (ES) complex is directly related to enzymatic activity. In such instances measures of enzyme reaction velocity exhibit the same cooperative saturation profiles as protein-ligand binding, such as O2 binding to Hb. As a result, cooperative binding of oxygen by Hb has become the classical model for allosteric regulation.7 However, through the 1950’s and early 60’s, Hb was a mysterious system that researchers were unable to reconcile with models of multimeric proteins. The earliest structural work carried out by Max Perutz revealed four well-separated heme moieties within the Hb tetramer, leading to speculation that cooperativity was driven by conformational changes associated with O2 binding, and not by the proximity of the heme groups to one another (Figure 1).8
Figure 1.
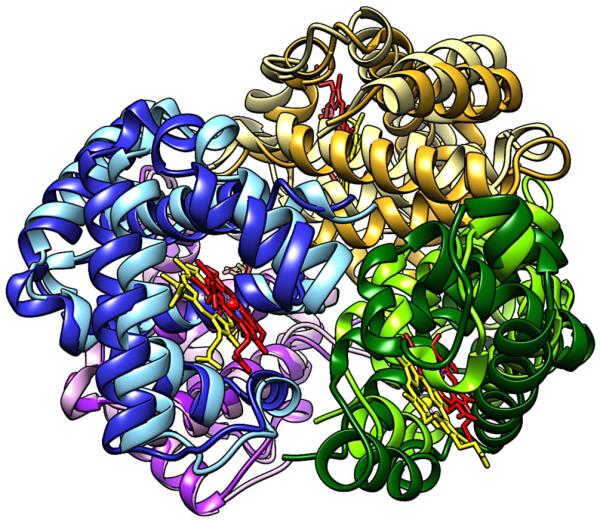
Structural comparison of deoxy- and O2-bound Hb. Subunits of deoxy-Hb are shown in darker shades and their corresponding heme moieties are colored yellow. Subunits of O2-bound Hb are shown in lighter shades with red heme groups. A change in the position of the subunits and heme groups is observed as the dimers rotate in the O2-bound structure.
Based on his structural analysis, Perutz hypothesized that salt bridges were the regulators of Hb allostery, causing changes in the quaternary structure equilibrium upon O2 binding.9 This original model was the basis for explaining binding cooperativity within Hb and helped shape the opinion that conformational effects in proteins, especially multisubunit systems, were a common occurrence. The structure and solution behavior of Hb influenced the earliest models of allostery,2 which were based on symmetrical multimeric proteins undergoing conformational changes between so-called tense (T) and relaxed (R) states or conformations. In the case of Hb, one of these states (the R-state) also bound O2 more tightly. Investigations into concerted conformational changes in the symmetrical hemoglobin tetramer provided what have become classical explanations for the kinetic and dynamic behavior of multimeric proteins.
Historically, two related paradigms of this original allosteric mechanism have endured, the Monod-Wyman-Changeaux (MWC) and Koshland-Nemethy-Filmer (KNF) models. The MWC (or concerted symmetry) model assumes all subunits of an oligomeric protein undergo simultaneous conformational changes upon ligand binding and adopt symmetrical conformations at all times.2 In contrast, the KNF or sequential model asserts that protein subunits undergo independent conformational changes when ligated, which then modulates the strength of the intersubunit interactions.3 Although both models rely on two conformational states, one of which becomes preferred upon ligand binding, substrate affinities are affected through alteration of the subunit interfaces (thus affecting the binding sites) in the KNF model, where MWC allostery modulates affinities through the [T]:[R] equilibrium. Nonetheless, both MWC and KNF paradigms continue to be useful in predicting experimental results, as observation of more than two distinct protein conformational states is often experimentally difficult. The concerted symmetry model, formulated by Monod et al,2 postulated that the T-state had low affinity for ligand, and binding was preferred only in the higher affinity R-state. In this model, subunit symmetry is maintained – either all subunits exist in the R- or T-state where ligand binding simply shifts the position of the pre-existing equilibrium between T and R. An expression to describe cooperative ligand binding under the assumptions of this model is given by Equation (1):
| (1) |
in which Ns is the average number of substrate bound per molecule of enzyme, KS = [RS]/[R][S] is the equilibrium constant of S binding to the R-state and Ktc describes the equilibria accounting for the conformational change in the subunits.
The other primary cooperative binding model to describe Hb/O2 interactions was put forth by Koshland and coworkers and did not require the conservation of subunit symmetry, but initially invoked ligand-induced conformational changes in the protein to a state with altered ligand affinity. Although, Koshland later noted that whether a protein conformation with altered affinity pre-existed or was induced by ligation did not matter so far as the model was concerned (see equation 46 and the discussion in Reference 3). This sequential model was more general but also more complex than the symmetry model. The sequential model, which explicitly considered the energetics of subunit interactions, required different expressions for each theoretical arrangement of protein subunits. For example, a tetramer configuration could have ‘linear’, ‘square’, or ‘tetrahedral’ models, which did not necessarily reflect the physical arrangement of the protein subunits, but rather the energetics of cross-subunit interactions and how they differ when adjacent subunits were in the T and R conformations (A and B in Koshland’s nomenclature). The allosteric ligand binding expression for protein subunits of ‘square’ arrangement follows in Equation (2):
| (2) |
In Equation (2), Kt = [R]/[T], KTR = [TR][T]/[TT][R], KRR = [RR][T][T]/[TT][R][R], where T and R reflect the two allosteric states. For consistency we have used similar nomenclature between equations (1) and (2). In referencing Koshland’s original work, note that enzyme conformation A = T(ense), and B = R(elaxed), the low and high affinity states respectively. Thus, to convert to the nomenclature in Koshland’s work3 one would change KTR = KAB, and KRR = KBB. KTR and KRR represent the interactions between subunits of different conformational states. KTT (KAA) is given a value of 1 as a reference state. In Monod’s concerted symmetry model described by equation (1), Ktc accounts for the equilibria described by Kt, KAB, and KBB that are required in the KNF model. Another difference from Monod et al’s equation (1) is the factor of 4, which Koshland indicates is the relation between Ns and , the saturation function representing the total fraction of sites occupied by S.
1.2. Developing Allosteric Models
The study of allostery has grown exponentially since the initial reports of Perutz,7,9 followed by Monod, Koshland, et al,2,3,10,11 with equivalent increases in the variety and complexity of allosteric mechanisms described in the literature. The central biochemical challenge remains the creation of a quantitative model of this phenomenon such that allosteric mechanisms can be universally described and compared across different proteins. The highly evolved selectivity of enzyme families coupled with variations in their size and oligomeric state only adds to the complexity of this problem. The MWC and KNF models represent the extremes of a continuum in which the R-state population in the apo (ligand free) enzyme or protein exists in measurable or undetectable quantities, respectively. Therefore it is perhaps not surprising that both models can adequately describe O2 binding to Hb with indistinguishable fits of the data (Figure 2).
Figure 2.
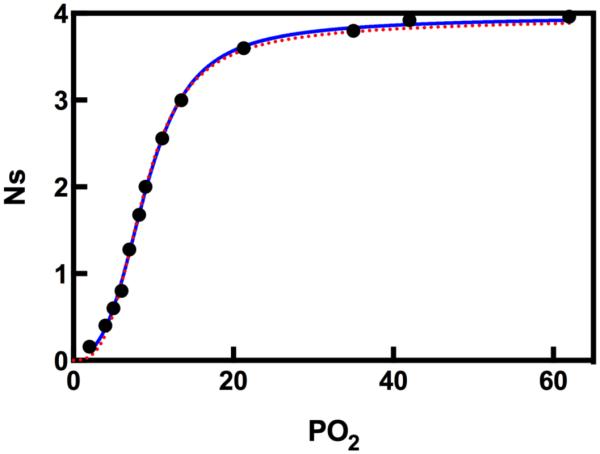
Comparison of MWC ( ) and KNF (—) models in describing O2 binding to Hb. The data points are taken from Monod, Wyman, Changeaux.2 The curves are non-linear least squares fits with Equations (1) and (2).
Numerous reports describe KNF- and/or MWC-type coupling between allosteric sites,12-15 but as Hilser points out in a 2012 review,16 neither the MWC nor the KNF model truly explain how allostery works from a structural or mechanistic perspective.
A number of recent reports on allosteric proteins have, to some extent, diverged from classical paradigms,17-20 instead relying on changes in bonding between apo and liganded structures obtained by X-ray crystallography to explain allosteric behavior, popularizing a purely structural view of allostery.21 While it is well known that many proteins undergo significant structural changes with ligation,12,22-24 it is still debatable as to whether structure perturbation is a unifying concept within allostery.16,25 Hilser and coworkers, while summarizing potential pitfalls to purely structural allosteric analyses, point out several examples where allostery occurs in the absence of conformational changes25,26 or is modulated by mutations that have no structural effect.27,28 Taking Hilser’s analysis into account, the initial work of Perutz on the hemoglobin tetramer ironically remains one of the best examples of structure-based prediction of allosteric behavior. Although the story of Hb suggested the structure(s) of any allosteric protein should provide sufficient insight into its mechanism, solution-based experimental data implicate a combination of determining factors. Despite its limitations, the structural view of allostery has also been a major contributor to the mechanisms that we will discuss in the coming pages.
In an effort to move toward a unifying concept of allostery, Hilser and coworkers recently introduced the Ensemble Allosteric Model (EAM), which treats allostery as an energy landscape with probabilistic ensembles of protein conformations.6,16 The EAM views allosteric coupling as a free energy (G, or ΔG) balance, and probes the propagation of free energy changes within small subsections of a protein. Unlike KNF or MWC allostery, the EAM describes structural coupling between protein subunits thermodynamically, where only the sign and magnitude of ΔG are relevant. Thus, the EAM is capable of characterizing different protein systems using the same set of thermodynamic principles. However, the purely thermodynamic EAM is not without pitfalls, as it dispenses with the idea of communicative pathways between allosteric and active sites, even though experimental characterization necessitates such a linkage.
The EAM separates itself from structural models of allostery by describing free energy changes as a function of an ensemble population, rather than a rigid transition (i.e. T-to-R), making it applicable to any allosteric protein undergoing a conformational change. In the simplest case of a two-domain protein (i.e. one regulatory, one catalytic), each domain is free to sample all possible conformations, each having a Gibbs free energy value, G. Although any conformation is inherently possible, the EAM simplifies to one low activity (i.e. T) and one high activity (R) state with four dominant intermediate states, i. The favorability of any conformational microstate is governed by the energy of the T-to-R transition (ΔGC, i) and interaction energy of the subunits (ΔGInt, i), giving a total energy described by ΔGi = ΔGC,i + ΔGInt, i.16 A partition function describes the ensemble and determines the probability of a particular energetic state. The EAM partition function is then supplemented with parameters such as coupling response (CR), providing a measure of feedback for single protein subunits undergoing ligation. CR analysis incorporates principles of structure-based models for allosteric networks and ultimately becomes a metric for determining thermodynamically favorable protein architectures.23,29,30
Although well-accepted allosteric paradigms continue to rationalize experimental results, researchers have also begun turning their attention to the role of intrinsic protein dynamics as another descriptor of allosteric regulation.31-33 A connection between protein dynamics and allostery has been recognized for some time, but important questions about the evolutionary nature of dynamics in allosteric regulation have yet to be answered. In their 2007 account, Bahar and coworkers relay several key points related to the intrinsic ability of enzymes to undergo conformational changes required for function, particularly in the absence of substrates or effectors.34 One of the most striking points raised by Bahar relates to proteins sampling an ensemble of conformational states at equilibrium, even in their apo state.34 The paradigms of allostery typically consider the apo-enzyme non-functional, often requiring a significant conformational change upon effector binding. However, if several of the conformational substates in the equilibrium ensemble are close in energy to the global (folded) minimum, only small energy barriers prevent the formation of a functional structure. Thus, an intrinsic ability of (apo) enzymes to fold into native-like conformations would make the interconversion to an active structure more facile.
The commonality among allosteric enzymes is the ability to access functional conformers to communicate between the active and allosteric sites, and the development of community networks that mediate subunit crosstalk through protein motions has emerged as a hot topic in the study of allostery.35-37 Dynamic contributions to allostery force us to reexamine the meaning of classical principles such as “induced fit,” as even today it is unclear if a substrate induces a necessary change in enzyme structure, or if the ability to adopt this fold is simply an intrinsic property of the protein. That is, does effector binding ever drive an enzyme into a stable structure it was not already evolved to form? From an energetic perspective, the free energy difference between an allosteric enzyme in R:T ratio of 9 (0.9: 0.1) versus one with a ratio of 199 (0.995:0.005) is only 1.8 kilocalories. Thus, it is possible for an allosteric ligand to provide a significant shift in R:T equilibrium with minimal binding free energy.
The major allosteric mechanisms involve concerted (MWC) or sequential (KNF) conformational changes of protein subunits upon ligation,2,3 and recently, models involving statistical thermodynamics and equilibrium ensembles have become popular descriptors of allostery.6,16 Additional work in the field of enzyme dynamics has provided a wealth of experimental and theoretical data suggesting that conformational motions in the absence of ligand can access more active structures.31,33,34 The role of these motions in regulating enzymatic catalysis has been highlighted in recent years,38,39 and the degree of ligand activation required for enzyme function continues to be reexamined to account for dynamic ensembles. Currently, reports of high degrees of conformational sampling in allosteric enzymes cannot fully reconcile the principles of the MWC or KNF models,16,33,40-42 making the most likely descriptor of allostery a combination of dynamic, kinetic, and thermodynamic forces competing to create the most energetically favorable outcome. Amongst various classes of allosteric enzymes, the driving force free energy differences rely on varying degrees of enthalpy and entropy changes, and the contributions of kinetics or dynamics to this energetic balance are weighted differently in each biological system.
1.3. Scope of the Review
This review will detail key discoveries in allosteric enzymology and provide examples of the models described above as they relate to our current understanding of well-vetted systems. We hope to showcase powerful experimental techniques for elucidating allosteric mechanisms, particularly NMR spectroscopy. Experimental NMR methods have evolved to a point where atomic resolution of large, multisubunit enzymes is achievable, pushing our understanding of allostery farther than ever. Current allosteric paradigms, coupled with thermodynamic principles and investigations of protein dynamics, provide all the tools required for a complete understanding of allostery. However, the degree to which these concepts are applied to various enzymes is still highly variable, as the examples in this review will show. Moreover, the diversity of the results suggests that nature employs a wide variety of mechanisms in enabling allostery.
2. NMR Spectroscopy in the Study of Allostery
Conformational rearrangements are critically important to biological catalytic processes, as many biomolecules rely on these motions to achieve their active form. Dynamics are particularly relevant to the allosteric regulation of enzymes and are usually triggered through binding of an effector molecule or endogenous ligand. Most notably, crystallographic methods have established the structural view of allostery and have been invaluable to our understanding of atomic level interactions accompanying ligand binding. In some cases, ligand-induced conformational changes are a rate-limiting step in enzyme catalysis, making the characterization of enzyme dynamics and the timescale for the allosteric change crucial for understanding the catalytic mechanism. If the energies of the inactive (apo) and active (holo) conformational states of an enzyme are comparable in solution, they likely exist in measurable equilibrium concentrations. NMR spectroscopy is an excellent technique for measuring skewed equilibrium reactions, as the minor species has a notable effect on the properties of the major NMR observable. Therefore, to address more detailed questions regarding the role of protein motions in allostery or whether the enzyme under study possesses the innate ability to sample these relevant conformations requires the use of solution NMR spectroscopy, which is unsurpassed in its ability to detect minor (~0.5%) conformations in equilibrium with more energetically stable conformations, as well as being robust in quantifying timescales of molecular motions ranging from picosecond (ps) to seconds (s). Moreover, recent reports on the energetic contributions of solution ensembles to allostery suggest NMR spectroscopy can, in some ways, provide a more comprehensive view.43
The earliest work on the hemoglobin tetramer spawned the structural model of allostery and laid the groundwork for the concerted and sequential models.44 In later years, allostery was reexamined with rigorous thermodynamics under the assertion that binding site communication contains enthalpic and entropic components resulting from conformational fluctuations.45,46 Dynamic contributions to protein allostery are now well established,47,48 as are techniques designed to explore them. The development of NMR methods for the study of protein dynamics has been previously discussed,49-52 and the use of NMR to probe timescales relevant to biology will be further elaborated in this review. Most well-studied dynamic biological processes, such as enzyme-catalyzed reactions, occur on the microsecond (μs) to millisecond (ms) timescale, but the available suite of NMR experiments can probe an even wider range of motional regimes, providing access to weakly populated conformational states50-54 relevant to molecular recognition55,56 and catalysis,57,58 as well as fast equilibrium dynamics that contribute to the configurational entropy of the system.59-61
Although NMR has provided a wealth of insight into allosterically regulated proteins, only a small group of examples can be discussed here in reasonable detail. Since this review is focused on allosteric enzymes, relevant NMR studies of non-enzymatic systems will be summarized briefly. Numerous examples of protein allostery in which dynamics appear to contribute continue to surface in studies of binding domains and protein-receptor interactions, which are more difficult to define by classical paradigms. NMR experiments62-64 coupled with molecular dynamics (MD) simulations65,66 have shown that PDZ binding domains undergo significant changes in dynamics due to ligation at distant sites.67 Similarly, NMR relaxation experiments of side chain methyl groups and backbone amides of the dual binding site phosphotyrosine binding domain (PTB) of the insulin receptor substrate-1 (IRS-1), which contains binding sites for the insulin receptor and intermembrane phospholipids, have shown that conformational motions serve as the coupling mechanism for the PTB sites.68 Furthermore, the NMR chemical shift perturbation and nuclear Overhauser effect (NOE) experiments of Weiss and coworkers on the R6 insulin hexamer reveal its allosteric regulation to involve dynamic “gatekeeper” residues to control binding and promote structural stability.69
Kalodimos and coworkers have recently reported the NMR structure of the allosteric catabolite activator protein (CAP), a dimeric transcriptional activator that responds to changes in concentrations of cyclic adenosine monophosphate (cAMP).70 The structure of apo-CAP, solved with a combination of paramagnetic relaxation enhancement (PRE) and heteronuclear correlation experiments, was shown to contain a binding domain incapable of docking in the major groove of DNA due to a 60° rotation from the cAMP-bound structure. NMR experiments revealed a partially unstructured coiled coil at the dimer interface of apo CAP, which undergoes significant motions of the ps – ns timescale.70,71 Kalodimos and coworkers culminated their NMR studies of CAP by mapping the cAMP-induced allosteric transition, including a reorientation of the DNA-binding domain and a coil-to-helix transition at the dimer interface brought on by favorable hydrogen bonding interactions with the adenine base of cAMP. These NMR studies also identify distinct sets of interactions present in apo- and cAMP-bound CAP, highlighting important residues involved in the allosteric transition.70,71 Kalodimos has also recently reviewed the use of NMR for the study of dynamic and energetic contributions to protein regulation mechanisms.72 Additional reports of dynamic allostery have been found in the NMR studies of membrane-bound proteins73 and kinases.74,75
The contributions of Kay and coworkers to the development and application of novel NMR dynamics experiments to the study of protein complexes includes the allosterically regulated HsIV bacterial protease, which functions similarly to the 20S proteasome core particle.76 Through chemical shift perturbations, Shi and Kay observed a 75 Å propagation of conformational fluctuations, and methyl-selective TROSY relaxation experiments identified a dynamic pathway within the complex. Point mutations along this pathway modulate the dynamic behavior, and shift Kcat/Km up to 10-fold in either direction,76 suggesting that side chain motions are critical to the function and regulation of this protease. Other NMR studies on the enzyme tryptophan synthase have identified long-range allosteric pathways and have mechanistically investigated these pathways by mutations that disrupt critical interactions.77,78
A more recent series of reports from Giedroc and coworkers have examined allostery in Zn(II) and Cu(I) proteins involved in transcriptional regulation. NMR studies of the apo and Cu(I)-bound forms of the metalloregulatory protein CsoR detail the structural rearrangements involved in its DNA binding, which are allosterically controlled by Cu(I).79 The same group has also identified metal-mediated allosteric pathways in a series of Zn(II) sensor proteins using NMR and complementary techniques.79,80 These previous examples highlight the role that solution NMR spectroscopy can play in the characterization of protein allostery. Below, we describe the details of the various NMR experiments for the study of the structure and dynamics of enzyme allostery. Following this discussion, we focus on several enzyme examples and illustrate the contributions NMR spectroscopy has made toward the characterization of their allosteric mechanism.
2.1. NMR Theory
Solution NMR spectroscopy can be performed under conditions (i.e. solvent, pH, temperature) approximating physiological levels and incorporation of spin-1/2 nuclei into proteins is non-perturbative and has become relatively straightforward. Further, NMR spectroscopy is nondestructive, and the experimental library for the study of protein structure and dynamics is continually expanding. Biomolecular NMR has typically been restricted to proteins smaller than 50 kDa, but novel TROSY81 methods and methyl isotopic labeling techniques82,83 now facilitate the study of much larger proteins and enzymes by preserving signal-to-noise and deconvoluting crowded spectra. Most notably, selective 13C labeling of side chain methyl groups, particularly those of Ile, Leu, and Val (ILV), make it possible to observe a smaller number of resonances to avoid the complications from spectral overlap.82,83 Further, Ile, Leu, and Val residues have exemplary relaxation properties resulting in narrow resonance line widths.
Because allostery occurs between distant ligand binding sites, allosteric enzymes often consist of multiple protein subunits and are generally quite large (>50 kDa). Selective labeling strategies are extremely important for these systems, and recent examinations of larger multisubunit proteins have shown them to be increasingly amenable to solution NMR characterization.76,84 In the study of enzyme allostery, NMR provides information about local and global structure, as well as conformational dynamics over the ps – s time regimes. Furthermore, isotopic labeling (i.e. 15N, 13C-ILV) of single subunits within an enzyme complex provides insight into local sites of allosteric communication.76,85-87 The variety of experiments designed to probe protein dynamics, and allostery by extension, have the potential to provide a complete picture of the processes governing enzyme function.88 Several of the most critical functions of biomolecules occur over the μs – ms time regime (Figure 3) and the suite of NMR experiments designed to probe the dynamics of these processes are called relaxation dispersion. Relaxation dispersion NMR has been used to examine internal protein motions,89-94 protein folding,95-97 ligand binding events,98,99 and enzymatic mechanisms.100-107 The collection and interpretation of NMR relaxation data that provide insight into protein conformational motions are derived and discussed in detail in the following sections.
Figure 3.

Schematic depiction (upper) of the timescale for various protein motions and the corresponding NMR experiments (lower) that are valuable for their characterization.
2.1.1. Conformational Exchange
NMR spectroscopy is able to detect the interconversion of nuclei between two (or more) distinct chemical environments, a dynamic process called chemical or conformational exchange. The identity of the spin labels determine the type(s) of dynamics that are observed, with 15N nuclei typically corresponding to backbone amides and 13C nuclei probing backbone or side chain motions. Chemical exchange motions are present in a wide variety of enzymes, but these measurements are particularly relevant to the study of allostery, where two unique conformational environments can represent active (R) and inactive (T) forms of the enzyme. Chemical exchange occurs in three basic time regimes; slow, intermediate, and fast, depending on whether the rate of exchange (kex) is slower than, similar to, or faster than the chemical shift difference (Δω) between the two conformers. Conformational exchange motions disrupt the nuclear Larmor precession about the magnetic field axis, causing broadening of the resonance. Exchange broadening indicates an increase in the transverse relaxation rate (R2), and measurement of R2 is possible by monitoring the decay of a given resonance during Carr-Purcell-Meiboom-Gill (CPMG) or spin-echo ([ 0.5τcp − 180° − 0.5τcp]n) NMR experiments, where τcp is the delay time between 180° radio frequency (RF) refocusing pulses, and n is the number of repetitions of the echo. These and other relevant experiments are described in detail in the coming sections. The remainder of this review will discuss the investigation of allosteric enzymes by several NMR methods, first by establishing theoretical underpinnings and then extending them to selected examples.
2.1.2. Chemical Shift Perturbation
The most basic NMR method for monitoring changes in an allosteric system is through perturbation of chemical shifts. NMR-active nuclei are highly sensitive to their local environment, making changes in the structure or dynamics of a given nucleus easily detectable through monitoring of the chemical shift. The simplest case is a conformational change within an enzyme subunit, where an expression can be written for a nucleus interconverting between two different conformational states, given by Equation (3). This situation is applicable to an allosteric enzyme converting between T and R forms, and that nomenclature is used below.
| (3) |
Here, the observed chemical shift (δobs) is a population weighted average of the T- and R-states, where pR/T are the equilibrium populations of each conformational state and δR/T are their respective NMR chemical shifts. This expression is valid only when there is intermediate or fast exchange between the two conformations such that kex ≥ Δω = |δR − δT|. Under these conditions, molecular motions 'average' the two chemical shifts into a single resonance that is observed at the population weighted chemical shift value (Figure 4). If the system is in slow exchange, where kex > Δω, two resonances are observed and the equilibrium populations are proportional to the peak volumes. Thus, changes in chemical shift in any allosteric system can be representative of the equilibrium shift between conformations. A particularly clever and powerful chemical shift analysis of allosteric proteins was put forth by Melacini and coworkers. This method analyzes the covariance of chemical shift changes to yield additional insight into the allosteric signal propagation.108 This procedure has been utilized with much success in the regulatory subunit of Protein Kinase A and in EPAC (the exchange protein directly activated by cAMP).109,110
Figure 4.
General depiction of chemical shift perturbation by ligand saturation for a two state equilibrium. The resonance shifts as the apo protein (red) is fully saturated (purple). Figure adapted from Ref. 88 with permission from Elsevier.
2.1.3. Motions on Fast Timescales
Advanced NMR techniques are powerful for the study of atomic-resolution protein conformational dynamics over a large range of time scales (ps – s).104,111-113 Motions on the ps – ns timescale, which are faster than the rotational diffusion of a protein, reflect equilibrium fluctuations in the bond vectors of individual atoms, and modulate the chemical shift anisotropy and dipolar interactions between the nuclei. The type of nucleus and frequency of the molecular motions govern the rate of establishment of Boltzmann equilibrium.114-120A thorough review of the theoretical treatment of NMR spin-relaxation is given by Palmer and coworkers.50,121,122 Here, we present a general overview of the spin-relaxation formalism. The mathematical expressions below are useful for describing a heteronuclear spin-1/2 pair such as the amide proton-nitrogen (1H-15N) located in the polypeptide main chain. The longitudinal (Sz) and transverse (Sx/y) non-equilibrium magnetization of the 15N heteronucleus relax (R1, R2) to their Boltzmann equilibrium values as described by Abragam (Equations (4) and (5)),123
| (4) |
| (5) |
with ωI and ωS representing the Larmor frequencies of the I (1H) and S (15N) nuclei and c = (2/15)Δσ2ωS2, where and Δσ is the chemical shift anisotropy of the S nucleus. Rex is the excess contribution to R2 that arises from conformational exchange motions that occur with μs – ms frequency and is in many cases equal to zero. The dipolar coupling constant d is described by Equation (6),
| (6) |
where μo is the permeability of free space, ħ is Planck’s constant divided by 2π, γI and γS are the gyromagnetic ratios of nuclei I and S, and 〈rIS〉 is the average internuclear bond length between I and S. The spectral density function, J(ω), is written as the cosine transform of the autocorrelation function of the I-S bond vector as previously described.123
| (7) |
In the case of fast stochastic intramolecular motion that is uncorrelated with (overall) rotational diffusion, the autocorrelation function is described by the product of the autocorrelation functions of overall (CO) and internal bond vector (CI) motions.124
| (8) |
The simplest example, a spherical macromolecule, would experience isotropic rotation, with Co decaying in single exponential fashion, given by Equation (9);
| (9) |
where τc is the rotational correlation time of the macromolecule. The associated spectral density function is then expressed as shown in Equation (10).
| (10) |
Considering Equations (7) - (10), the spectral density function that describes overall and internal bond vector fluctuations becomes
| (11) |
and . Here, τe is the effective correlation time for internal motions and S2 is a generalized order parameter ranging from zero to one, where lower values indicate increased flexibility. Thus, the value of S2 is relatable to the configurational entropy of the individual bond vectors in a macromolecule.125-127
The configurational entropy associated with bond vectors for sidechain residues can also be addressed by NMR spectroscopy. For large allosteric enzymes, a particularly useful experiment characterizes fast sidechain motions through measurement of the 1H-1H dipolar cross-correlated relaxation rate constant, η for methyl groups (δ, δ, and γ respectively) in the hydrophobic amino acids Ile, Leu, and Val. Fast motions characterized by η, are described in Equation (12),
| (12) |
where rHH is the distance between methyl protons, γH is the proton gyromagnetic ratio, and τc is the rotational correlation time of the protein. P2 (cos(x)) is the second Legendre polynomial in which θaxis,HH is the angle between the 3-fold symmetry axis of the methyl group and the vector between two methyl protons (this angle is assumed to be 90°). The generalized order parameter S2 is similar to that derived previously and describes the amplitude of the equilibrium fluctuations of the methyl symmetry axis. and are the relaxation rates for the single quantum 1H coherences describing fast and slow relaxation transitions, respectively. The degree of methyl group motion is related to η, which is measured empirically through a comparison of peak intensities from two HMQC-based NMR pulse sequences differing by a 90° 1H pulse. The intensities of the individual methyl peaks are expressed using the relationships in Equations (13) and (14). In the first experiment, the methyl peak intensity (Ia) is written as
| (13) |
where T is the relaxation time during which 1H transverse relaxation returns to equilibrium and are relaxation rates for fast and slow processes as described above. In the second experiment, which excludes the extra 90° 1H pulse, the intensity (Ib) is described by
| (14) |
and the ratio of Ia and Ib gives the 1H-1H dipolar cross-correlated relaxation rate shown in Equation (15).128
| (15) |
Equation (15) holds true for isolated methyl groups, however, when additional protons from the polypeptide are in close proximity to the methyl group(s) of interest, the ratio of Ia and Ib becomes
| (16) |
and an additional parameter, δ, is needed to account for the contribution of remote 1H dipolar interactions (Equation (17)).
| (17) |
1H dipolar effects are significantly minimized through deuteration of remote protons, which is common practice in NMR studies of large biomolecules. In the coming section, slower timescale motions, which are frequently associated with larger amplitude conformational changes and are often directly implicated in allosteric transitions, will be discussed.
2.1.4 Motions on Slower Timescales
Biologically relevant conformational motions often involve crossing more significant energy barriers and include transitions such as those between inactive and active enzymatic states. Thus, motions of this type usually occur more slowly (μs - ms) and modulate the isotropic chemical shift of the atoms involved, assuming the moving atoms experience unique magnetic environments (i.e. sites A and B, where and kex = k1 + k−1). Fluctuations in the magnetic field due to motional exchange broaden the resonances and increase the transverse relaxation rate constant, R2, by an amount Rex in which Equation (4) is rewritten as;
| (18) |
R20 is the “slow motion-free” transverse relaxation rate that incorporates motions at frequencies near the Larmor frequency, and in the fast exchange limit Rex is given by Equation (19) where Δω is the chemical shift difference (in angular frequency units) between sites A and B, pA/B are the equilibrium populations of the assumed two conformations, and kex is the microscopic exchange rate constant of the dynamic process.
| (19) |
Characterization of equilibrium conformational exchange on this slower timescale is achieved by the relaxation-compensated Carr-Purcell-Meiboom-Gill (rcCPMG)90,129 and/or off-resonance rotating frame relaxation (R1ρ) experiments.89,130 These measurements are designated as relaxation dispersion analyses because the relaxation rates vary with the applied radio-frequency field. rcCPMG and R1ρ pulse sequences are useful for quantifying the rate of conformational exchange (kex), the equilibrium populations of each conformer, and the chemical shift differences between conformers (Δω). The measured value of Rex depends on τcp, the repetition rate of the 180° pulse in the rcCPMG experiment,131-133 or ωe, the effective field strength in the R1ρ experiment.130 These CPMG experiments can measure the exchange contributions to single (SQ),90,129 double,134 zero,134 or multiple quantum (MQ)135 coherences. Below we describe the SQ and MQ experiments as they are more frequently used in the study of allosteric enzymes.
The basis of the single-quantum rcCPMG experiment is given by Equation (20) where the measured transverse relaxation rate (R2(1/τcp)) varies as the 180º pulse spacing (τcp) is altered,131-133
| (20) |
in which and are the intrinsic transverse relaxation rates of the two sites independent of chemical exchange.
The expression described by equation (20) is useful when conformational motion is in slow to intermediate exchange (kex ≤ Δω). Equation (20) simplifies to the relationship below under fast exchange conditions (kex > Δω). In this fast limit, conformational exchange processes characterized by the rcCPMG experiment are described by Equation (21).136
| (21) |
where φex = pApB Δω2. Robust characterization of the exchange parameters necessitates acquisition of experimental NMR data at two or more static magnetic fields.137-139
rcCPMG NMR was initially applied to biomolecules for the study of backbone amide groups,90 but there have been several adaptations to other spin-1/2 labeled functional groups.135,140 One of the most useful CPMG-type experiments for characterizing conformational motions in allosteric enzymes, which are often large multimeric proteins, is multiple quantum (MQ) relaxation dispersion focused on the methyl groups of Ile, Leu, Val, and Ala residues,135,140,141 which greatly alleviate spectral crowding. The analytical expression for the dependence of R2 on conformational motions in MQ CPMG experiments is given in Equations (22) and (23) and differ from the relationship governing single-quantum CPMG experiments for amide pairs although the general features of R2 vs. 1/τcp data look similar between the two.
| (22) |
in which the individual components of Equation (22) are:
| (23) |
If sufficiently high-quality data are obtained, the MQ dispersion experiment has the additional benefit of providing ΔωH and ΔωC, which could yield additional structural information on the lowly populated conformation. The relaxation experiments described above illustrate the power of NMR spectroscopy in providing detailed descriptions of molecular motions over a large range of timescales. These experiments report on the kinetics of the conformational motion, provide the equilibrium populations of the interconverting conformations and elucidate structural information about spectroscopically invisible conformations through Δω values. Incorporation of TROSY enhancement into any of these experiments provides increased signal-to-noise and spectral resolution, facilitating studies of very large proteins (≥ 100 kDa).142 Often, enzyme motions occur much faster than can be quantified by CPMG dispersion experiments. In such cases, off-resonance R1ρ experiments can be performed to characterize the details of motions up to ~105 s−1.89 In the off-resonance R1ρ experiment (Equation (24))143
| (24) |
The effective magnetic fields for sites A and B are expressed as and . The frequency offsets from the RF carrier of the site A, site B, and population-averaged resonances are represented as ωA, ωB, and ωiso, respectively. The RF field strength is denoted as ω1 with tilt angle θ = arctan(ω1/ωiso). In the limit of fast conformational exchange, data analysis obtained from the R1ρ experiment, utilizes Equation (25), in which
| (25) |
where Rex is:
| (26) |
For fast motions outside of the fast-exchange limit and for general n-site exchange processes other expressions are necessary for data analysis and theoretical intepretations.144-146 For larger macromolecules TROSY variations of the NMR pulse sequences are available.147,148
2.1.5 Residual Dipolar Coupling Analysis
Structural information can also be gleaned from interactions between the magnetic dipoles of nearby nuclei. Typically, the information content of these interactions is averaged to zero by the rotational tumbling of the macromolecule in isotropic solution.149 However, dipolar couplings are restored at high magnetic fields through the addition of an aligning medium to the solution containing the macromolecule of interest.149 This partial alignment of the macromolecule reintroduces some of the dipolar interactions, hence the term residual dipolar coupling (RDC). The small amount of net alignment needed for RDC measurement can be achieved in several ways, including the introduction of bicelles,150,151 filamentous phage,152,153 paramagnetic protein tags,154 or in cases where the macromolecule has a large intrinsic magnetic susceptibility by high static magnetic field itself.155
The RDC values measured by NMR contain information on the orientation of the vector connecting the two spin-1/2 nuclei in question. The bond vector orientation information from a measured RDC provides structural parameters described by Equation (27),
| (27) |
where is the measured RDC between nuclei i and j, and γi/j are their gyromagnetic ratios, respectively. The effective internuclear distance between i and j is given by r. 〈P2(cosθ(t))〉 is the time-averaged second rank Legendre polynomial, where the angle between the magnetic field direction and the vector connecting nuclei i and j is denoted as θ. Under these constraints, measurement of for a large number of spin pairs (i.e. amide N-H groups) in a protein reports on their orientation relative to the magnetic field (B0) and by extension, their orientation relative to each other. is usually measured as a contribution to the scalar coupling constant, defined as , where Jij is measured first in isotropic solution ( = 0) and again in aligning media ( ≠ 0). Differences between these measurements provide the RDC and subsequently insight into protein conformational changes as a result of processes such as ligand binding.156 Excellent reviews exist detailing the preparation of aligning media,157 NMR measurement of RDC,158 and incorporation of RDC in structure calculations.159
In the next section, we examine several example enzymes with particular emphasis on the role solution phase NMR spectroscopy has played in illuminating aspects of allostery.
3. Aspartate Transcarbamoylase
3.1. Structure and Function
Aspartate transcarbamoylase (ATCase) catalyzes the formation of N-carbamoyl-L-aspartate (CA) from carbamoyl phosphate (CP) and L-aspartate (Figure 5), which is the first step in pyrimidine biosynthesis. The reaction proceeds through a tetrahedral intermediate and can be inhibited by the tight-binding bisubstrate analog, N-(phosphonoacetyl)-L-aspartate (PALA) that mimics the reaction intermediate structure. Discovered in the 1960’s, ATCase was found to control the rate of pyrimidine biosynthesis via feedback inhibition.160 This initial discovery also identified several ligand binding sites distinct from the active site, and determined that thermodynamic interactions between the sites could be uncoupled.160,161
Figure 5.
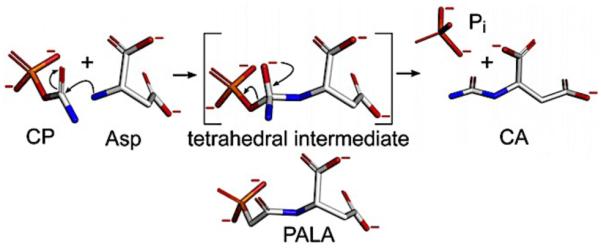
The reaction catalyzed by ATCase where carbamoyl phosphate and L-Asp are converted to N-carbamoyl-L-Asp via a proposed tetrahedral intermediate. The bisubstrate effector PALA is believed to mimic the tetrahedral intermediate and, depending on conditions, activate or inhibit ATCase. At low [Asp] and high [CP], PALA activates ATCase. However, as [PALA] increases, it occupies most of the sites where the catalytic intermediate is hydrolyzed, inhibiting activity. Figure taken from Ref. 162 with permission from Elsevier.
X-ray crystallography studies identified 2- and 3-fold symmetry axes within the enzyme, giving a dodecameric Ct6Rg6 structure containing two catalytic (Ct) trimers and three regulatory (Rg, to distinguish from ‘R’ conformational state) dimers.163-165 Like hemoglobin, its allosteric behavior conforms to the MWC model, with the apo enzyme favoring the inactive T-state nearly 250:1 based on kinetic studies.166 The catalytic and regulatory domains are further divided into four subdomains. The two catalytic subdomains contain the CP and Asp substrate binding sites, while the regulatory chains contain the allosteric sites, where the nucleotide effectors CTP, ATP, and UTP bind, and the Zn domain, containing a structural Zn2+-Cys4 site.
3.2. ATCase Allostery: Dynamic Structural Changes
The activity of ATCase is modulated by the allosteric effector nucleotides ATP, CTP, and UTP, which alter the T-to-R structural transition in the enzyme. Each subunit within ATCase undergoes motions brought on by the T-to-R transition, causing significant changes to the quaternary structure (Figure 6). Noteworthy structural changes include an 11 Å expansion of the enzyme along the 3-fold axis, 6° rotations of the regulatory dimers around their 2-fold axes and 7.5° rotations of the catalytic trimers around the 3-fold axis.167
Figure 6.
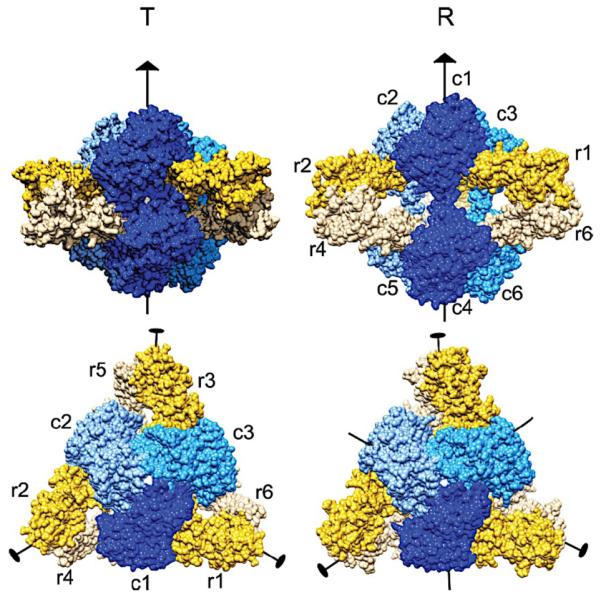
Comparison of quaternary structures of ATCase in T- and R-state viewed above (upper) and along (lower) the 3-fold symmetry axis. Catalytic chains are shown in blue and regulatory chains are shown in yellow. Figure taken from Ref. 162 with permission from Elsevier.
Changes in the structure as a result of binding to the bisubstrate analogue PALA, which approximates the natural substrate transition state, and is a potent inhibitor of ATCase are also illustrated in Figure 7.162 PALA binding is coupled to intrachain motions of the catalytic domains, namely the 50’s, 80’s, and 240’s loops (Figure 7) that facilitate formation of the high-affinity, high-activity R-state of ATCase.162 Thus, a combination of local and global dynamics is essential for substrate and nucleotide binding, as well as the allosteric transition of ATCase.
Figure 7.

Structural changes in the apo ATCase backbone (Cα) associated with PALA binding. The structure depicts two adjacent catalytic domains, highlighting the 50’s, 80’s, and 240’s loops of one domain, and the adjacent 80’s (c2) loop. Loop positions in the apo enzyme are shown by the blue highlight and loop positions in the ATCase-PALA complex are shown by the red highlight. The color gradient was generated by linear calculations of 40 structures between two known X-ray structures 1ZA1168 and 1D09.169 Spheres show the bound PALA molecule. Figure taken from Ref. 162 with permission from Elsevier.
3.2.1. ATCase Allostery: Changes at the Binding Sites
The active site is most exposed in the inactive T-state, with a volume of nearly 1900 Å3.162 Binding of the CP substrate induces only minor quaternary structure changes, but perturbs the orientation of the 50’s and 80’s loops enough to reduce the active site volume to 950 Å3. Binding of the second substrate, Asp, or the bisubstrate analogue PALA further contract the active site (540 Å3) due to motions in the 240’s loop.
The effector sites, located within the allosteric domain of the regulatory chain, contain key residues Ile12, Asp19, Lys60, and Tyr89 that form ionic pairs with the bound nucleotides, while Ala11, Val17, and Ile86 experience hydrophobic interactions with the nucleotide. Nucleotide binding also causes conformational motions as a result of interfacial changes between regulatory dimers, which propagate to the interfaces of the regulatory and catalytic domains.170
Allosteric effectors and the bisubstrate analogue PALA have significant thermodynamic effects on the native dodecamer as well as the isolated subunits. Differential scanning calorimetric (DSC) measurements on the Ct6Rg6 enzyme exhibit two separate unfolding events (Tm1 = 72.5 °C, ΔH = 146 ± 10 kcal/mol; Tm2 = 82 °C, ΔH = 543 ± 18 kcal/mol), which differ from parameters obtained for the isolated Rg2 (Tm = 55 °C, ΔH = 65 ± 1 kcal/mol) and Ct3 (Tm = 80 °C, ΔH = 395 ± 10 kcal/mol) subunits.171,172 These differences reflect the energetic consequences of intersubunit interactions, as well as changes in the secondary and tertiary structure of the subunits within the dodecamer, as shown by circular dichroism (CD) spectroscopy.173 Binding of PALA to the catalytic domain of native ATCase stabilizes both unfolding events, suggesting the effect is propagated to the regulatory subunits. The activator ATP and inhibitor CTP cause similar stability shifts in the unfolding events of Ct6Rg6 and the isolated subunits, indicating they have a localized effect on the subunits with the dodecamer.
3.2.2. Modulating the Allosteric Effect
Several accounts have been published that detail the modulation of activity and allosteric control of ATCase through cross-linking, mutation, or domain alteration. These studies have proven useful in estimating the degree to which each structural component of ATCase contributes to its regulation. Chan and coworkers have shown that ATCase can be locked in the active R-state by cross-linking with tartaryl diazide, producing a fully functional enzyme displaying no cooperativity, a high affinity for Asp, and no response to allosteric effector.174 A similar result was reported by Kantrowitz though the creation of a disulfide bridge between two symmetric, engineered Ala241Cys residues.175 This unique ATCase variant displays full activity with no effector response, and has been characterized crystallographically.176,177 The disulfide construct suggests that regulatory subunits are not essential for cooperativity in the active sites. In fact, removal of the regulatory subunits entirely enhances activity over WT holo-ATCase, which is hypothesized to originate from increased flexibility of the remaining portions of the enzyme. A Glu50Ala ATCase variant has the opposite effect, retaining ATP activation and CTP inhibition properties with a 15-fold loss in activity. Glu50 has been identified as a key residue that links the CP and Asp domains of the catalytic chain via H-bonds to Arg234 and Arg167.177,178
ATCase is well described by the MWC model, and favors the T-state 250:1 in the apo form. The T-state is only marginally more stable (~3 kcal/mol) than the R-state, but the activation barrier for the transition is estimated to be significantly higher. Decades of experimental work have investigated the changes in the [T]:[R] ratio in the presence substrates and effectors, but initial solution small angle X-ray scattering (SAXS) experiments, which contain obvious differences in the profiles of T- and R-ATCase, show little evidence of a clear change in [T]:[R] upon addition of CTP or ATP. Thus, early SAXS results suggested that CTP and ATP affect activity by altering affinities for the substrate in the active sites.162 However, a 2007 report by Kantrowitz and Vachette describes an Asp236Ala variant and the first evidence for a true dynamic equilibrium between the T- and R-states.179 Asp236 resides in the catalytic domain, and mutation to Ala is said to weaken the catalytic/regulatory interface, destabilizing the T-state and shifting the equilibrium ratio with the R-state closer to 1. Addition of Mg2+-ATP or CTP can further alter the equilibrium, and SAXS data on this variant show a reversible T ←→. R interchange, indicating a dynamic equilibrium.179 Advances in X-ray and laser techniques have now made characterization of fast ATCase kinetics readily achievable. Time-resolved SAXS is capable of monitoring the T-to-R transition over short durations (i.e. 50 ms), tracking the buildup and decay of the R-state,180 and provides an estimate of the T-to-R activation barrier of ~ 15 kcal/mol.
Many of the key residues involved in domain interactions and stabilization of each allosteric state have been identified through a combination of crystallographic and mutagenesis experiments. Interactions related to the stabilization of T- and R-ATCase are summarized in Figure 8.
Figure 8.

Schematic of the interactions identified to be important in stabilizing each allosteric state of ATCase, or the transition between the two states, by site-directed mutagenesis. (A) T-state ATCase and (B) R-state ATCase. Figure taken from Ref. 162 with permission from Elsevier.
For example, Glu50 of the catalytic CP domain (blue in Figure 8) forms an intradomain salt bridge with Arg105 in the T-state. This electrostatic interaction is broken and two new interactions are formed with Arg167 and Arg234 of the adjacent catalytic Asp domain in the R-state. These new contacts are due to a reorientation of the 50’s and 240’s loops during the T-to-R transition and closure of the CP and Asp domains as described by Kantrowitz.181 Interdomain contacts brought on by loop motions are especially important in the R-state, where they stabilize the closed form of the enzyme and position Arg105 and Arg167 to interact with substrates in the catalytic binding pocket.
3.2.3. Synergistic Inhibition of ATCase
While one equivalent of CTP is known to inhibit ATCase,162 a greater degree of inhibition is achieved with the additional presence of UTP. The UTP nucleotide requires one equivalent of CTP be bound in order to affect activity, which is often called “synergistic inhibition.” Little mechanistic insight into CTP-UTP synergy had been available until a recent series of X-ray crystal structures detailing UTP binding showed CTP and UTP positioned at nearby but non-overlapping sites. The two nucleotides are oriented with their triphosphates parallel to each other and are linked by a Mg2+ ion that bridges several regulatory site ligands (Figure 9).182,183 The presence of Mg2+ is required for synergistic inhibition in kinetic studies.183 While the allosteric activator ATP and inhibitor CTP compete for the same binding sites, UTP appears to bind in a distinct cleft where it preferentially interacts with CTP.184 Kantrowitz and coworkers hypothesize that Mg2+ works to stabilize nucleotide binding by minimizing repulsion of the phosphate oxygens.
Figure 9.
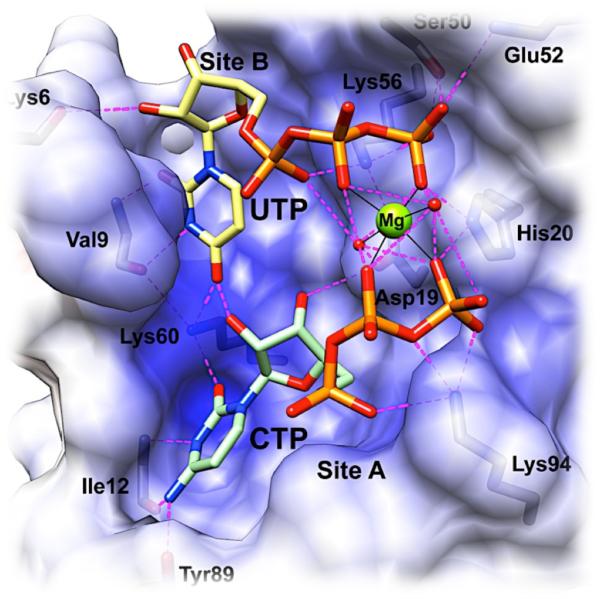
X-ray crystal structure of ATCase in complex with Mg2+ and inhibitors CTP and UTP solved by Kantrowitz and coworkers.183 Positive electrostatic potential (shown in blue) is mapped onto the solvent accessible surface of a single regulatory chain. Residues involved in inhibitor binding in the regulatory site are labeled, and two exogenous water molecules are shown in the Mg2+ coordination sphere. Reprinted with permission from Reference 183. Copyright 2012 American Chemical Society
Nearly 30 years earlier, Lipscomb foreshadowed the structural findings of Kantrowitz and coworkers, having tested Mg2+, Mn2+, Al3+, and Ca2+ for the ability to promote synergistic inhibition of ATCase, with only Mg2+ and Mn2+ showing any appreciable effect.184 The 2012 Mg2+-bridged ATCase structure reported by Kantrowitz confirms years of hypotheses on the role of essential metal ions in ATCase allostery. Kleppe and Spaeren have also shown that Mg2+ alters the ATP response of ATCase and kinetic measurements show Mg2+-ATP stimulates ATCase activity almost 2-fold.185 The high concentration of Mg2+ in cells (~ 2.5 mM in E. coli), creates a high likelihood that ATCase effector nucleotides exist as Mg2+ complexes, perhaps facilitating a bridging Mg2+ physiologically.
Beyond the structural and kinetic studies of ATCase, several solution NMR investigations have provided substantial insight into the precise allosteric mechanism of the enzyme, and are discussed below. These studies center on perturbations of the solution structure of ATCase in the presence of substrate and effector molecules.
3.3. NMR Studies of ATCase
Substrate binding by ATCase is believed to adhere to MWC allostery,186 but considerable debate remains regarding interactions with its allosteric effectors, CTP and ATP, and the mechanism by which they influence the T-R equilibrium. Two competing descriptions of activator and inhibitor binding suggest that CTP/ATP either preferentially bind T/R ATCase, respectively,187 or modulate the relative substrate affinities of T/R ATCase without changing the equilibrium of the two states.188 Analytical ultracentrifugation experiments support the former (MWC),187,189 while SAXS data support the latter picture.190 The recent NMR investigations of Kay and Schachman have clarified the debate on the effects of substrates and effector nucleotides on the T-R equilibrium of ATCase, providing compelling evidence that MWC allostery governs substrate and effector binding.85,86
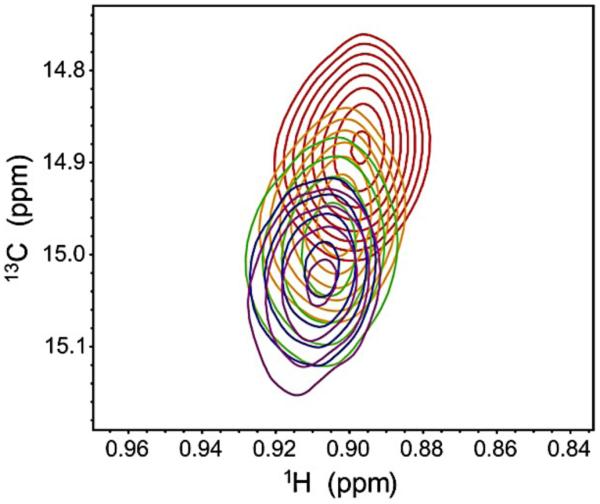
Solution NMR experiments have been conducted on ATCase for over 40 years, initially monitoring chemical shift perturbations upon substrate and effector binding.191,192 Others have reported 1H, 13C, 19F data explaining ligand binding and associated conformational changes, but these one-dimensional NMR spectra were substantially broadened and overlapped.192-196 New methyl-TROSY results communicated by Kay and Schachman incorporate selective labeling of Ile residues, significantly improving the quality of existing NMR data on ATCase. These data contain well-resolved spectra with high signal-to-noise acquired over short experiment times, demonstrating the power of methyl groups as biomolecular NMR probes (Figure 10). Selective labeling of the catalytic and regulatory chains further mitigates spectral overlap.
Figure 10.
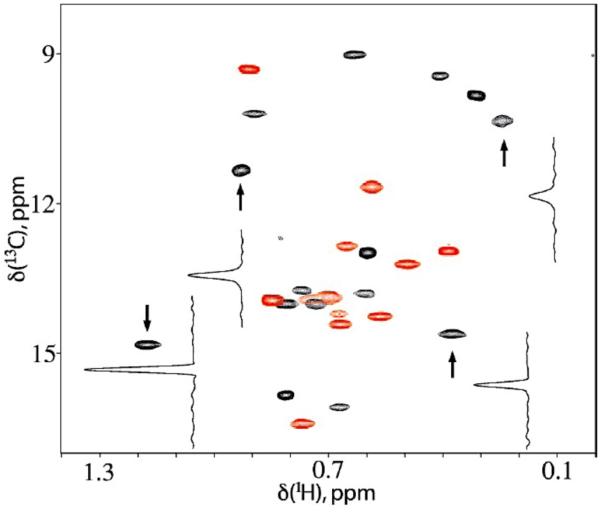
1H-13C methyl-TROSY correlation spectrum of 2H, δ113CH3-Ile ATCase. Peaks from the regulatory (R) chain are colored red, and those from the catalytic (C) chain are colored black. Spectrum was collected at 800 MHz on 0.6 mM ATCase with a 40-minute acquisition time. Figure reprinted from Ref. 85 with permission. Copyright (2007) National Academy of Sciences, USA.
A single resonance for each of the 27 Ile residues suggests each subunit (i.e. Rg vs. Rg and Ct vs. Ct) in ATCase is structurally identical, or any conformational exchange is fast on the NMR timescale and averaged to a single resonance. A quantitative analysis of ATCase allostery is derived from examining changes in the high quality NMR spectrum (Figure 10) as a function of ligand, shown in Figure 11. Titrations of apo ATCase with the substrate carbamoyl phosphate (CP) or its non-hydrolyzable analogue phosphonoacetamide (PAM) show new peaks building into the apo spectrum (T-state), consistent with a second conformational state, presumably the R conformation.
Figure 11.
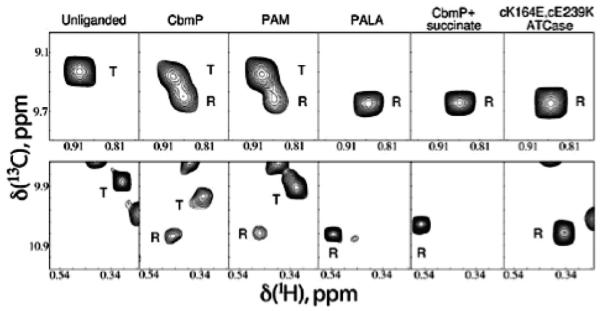
Effects of substrate and substrate analogue binding on the NMR spectrum of apo ATCase. Each panel displays portions of the δ113CH3-Ile spectrum showing an Ile resonance from the regulatory chain (upper row) and catalytic chain (lower row). Column 1, apo ATCase; column 2, ATCase with 15 equivalents per monomer of CP; column 3, ATCase with 58 equivalents of PAM; column 4, ATCase with 1.5 equivalents of PALA; column 5, ATCase with 30 equivalents of CP and 75 equivalents of succinate; column 6, apo cK164E/cE239K ATCase, a mutant favoring the R conformation.197 Figure reprinted from Ref. 85 with permission. Copyright (2007) National Academy of Sciences, USA.
Comparing the observed spectral changes in columns 2 and 3 of Figure 11 to conditions that are known to stabilize the R-state (columns 4 and 5) confirms a T-to-R shift, suggesting CP and PAM shift the equilibrium toward and interact with the R-state, consistent with the MWC model.
A great advantage to NMR spectroscopy is the ability to monitor both conformational states of ATCase independently through Ile chemical shifts, where the intensity ratio of the T and R resonances can be used to quantify the equilibrium concentrations of each species. If the T-to-R transition is slow enough to produce separate NMR signals, perturbations to the T and R chemical shifts upon ligand binding yield apparent dissociation constants, KD,R and KD,T. The reported dissociation constants for the PAM analogue are KD,T = 3.8 ± 0.3 mM and KD,R = 1.8 ± 0.1 mM.85
Figure 11 shows that both T and R conformers are present in the CP and PAM-saturated complexes. Since the interactions of ATCase with substrate are very well studied, Kay and Schachman focus on changes in the [T]/[R] equilibrium caused by allosteric effector (ATP and CTP) binding in the regulatory domains, which have not been well characterized. The effects of saturating concentrations of effector on the NMR spectrum of PAM-saturated ATCase are shown in Figure 12.
Figure 12.

Effects of allosteric effector nucleotides on the [T]/[R] equilibrium of PAM-bound ATCase. Panels display three different regions of the 2H, δ113CH3-Ile spectrum of ATCase saturated with 58 equivalents of PAM. Saturating concentrations of MgATP (46 equivalents) or MgCTP (32 equivalents) were added in columns 2 and 3, respectively. Figure adapted from Ref. 85 with permission. Copyright (2007) National Academy of Sciences, USA.
CTP and ATP binding alter the equilibrium between the T- and R-states (shown by peak intensities), respectively, supporting the MWC allosteric model. However, in light of several conflicting studies from other researchers,190,198 Kay and Schachman propose an alternative hypothesis where ATP (or CTP) may not affect the [T]/[R] equilibrium, but rather promote conformational motions in one of the allosteric states. Contributions from these motions could increase the substrate affinity of the R-state, causing the shift of the equilibrium only upon substrate binding. However, conformational motions would be detectable in the NMR chemical shifts, and most of the signals shift by 0.2 ppm or fewer, suggesting minor, if any, conformational changes within distinct states.85
Investigations by Schachman and coworkers over several decades have generated a large body of evidence supporting MWC allostery as the best descriptor of nucleotide effects on ATCase.187,199,200 However, the work of Herve and coworkers, among others, indicates that nucleotides alter the structure of the ATCase subunits, modulating their affinity for aspartate. Thus, changes in the T-R equilibrium are secondary to those in Asp affinity, more suggestive of KNF allostery.188,201 This “direct effect model” challenges the MWC mechanism and is supported by kinetic studies, namely those of Hsuanya and Wedler.202 Although an initial series of NMR experiments demonstrated that nucleotide binding to the regulatory chain(s) of ATCase follows the MWC model of allostery,85,86 coexistence between MWC (Rg chains) and an ensemble description of allostery (Ct chains) is plausible, and would better explain the collective experimental observations. In fact, Kay points out that there is no reason to preclude mixed models in most allosteric systems. Thus, to more fully characterize the allosteric transformations of ATCase and build upon their earlier results, Kay and Schachman apply methyl-TROSY NMR to δ1-13CH3 Ile; 13CH3, 12CD3 Leu and Val (ILV) labeled ATCase to examine perturbations in the resonances of the catalytic chains in the presence of effector nucleotides.86
Examinations of the catalytic chains are less straightforward than those involving the regulatory chains, as the nucleotide effectors ATP and CTP also have a weak affinity for substrate binding sites of the Ct chains. Potential complications from nucleotide binding in both subunits of ATCase were circumvented with the non-hydrolyzable substrate analogue PAM, which occupies the Ct chain binding sites, and is known to have little effect on the structure of ATCase (Figure 13). The results discussed below pertain primarily to the catalytic double mutant K164E/E239K, which has an equilibrium heavily favoring the R conformer and displays NMR spectra that overlap well with the WT ATCase-PALA complex (which also heavily favors R). An R-state dominant species simplifies the NMR spectrum significantly, as only R cross peaks are observed. By comparison, the PAM-bound WT ATCase spectrum displays peaks corresponding to the T and R forms (Figure 13).
Figure 13.

Nucleotide effects on the Ile, Leu, and Val methyl chemical shifts of catalytic chains of R-state ATCase. (A) Cartoon structure of ATCase in the R-state (PDB 8AT1) showing the bound CTP nucleotide in blue spheres and bound substrates PAM and malonate in black and green spheres, respectively. Positions of Ile, Leu, and Val methyl groups within the catalytic chain are shown as yellow spheres. (B) Overlay of HMQC NMR spectra of PAM-saturated cK164E/cE239K ATCase before (black) and after (red) addition of 20 mM Na2ATP. (C) Before (black) and after (blue) addition of 20 mM Na2CTP. (D) Before (black) and after (green) addition of 252 mM sodium malonate. (E) Before (black) and after (red) addition of 20 mM MgATP. Subunit labeling for panels b-d shows unlabeled regulatory chain, Ileδ1-[13CH3], Leu, Val-[13CH3, 12CD3]-labeled catalytic chain and for panel e Ileδ1-[13CH3], Leu, Val-[13CH3, 12CD3]-labeled regulatory chain and unlabeled catalytic chain. Figure reprinted from Reference 86 with permission from Elsevier.
The 1H-13C ILV NMR spectra of Lys164Glu/Glu239Lys PAM-bound ATCase in the presence of nucleotide effectors are shown in Figure 13.
The panels in Figure 13B-D depict Lys164Glu/Glu239Lys PAM-saturated ATCase overlaid with the same complex in the presence of saturating amounts of MgATP, Na2CTP, and sodium malonate. Shifts in the resonances of the colored spectra in Figure 13B-C are minimal, suggesting little or no nucleotide-induced Ct chain structural changes. The spectrum in Figure 13D, depicting malonate binding in the substrate pocket (Figure 13A), is a control measure of significant chemical shift perturbations following a binding event. Among the Ile, Leu, and Val residues within the Ct chain, only Leu267 is in immediate proximity to the substrate binding sites, and all others are more than 10 Å away, pointing to a long-range, substrate-driven structural effect throughout the Ct chain. Figure 13E demonstrates that MgATP perturbs the NMR spectrum of the Rg chain significantly, confirming that structural changes in ATCase subunits are visible by NMR, and that they do not occur in the Ct chain in the presence of nucleotides.
Collectively, recent methyl-TROSY NMR investigations of the ATCase Rg and Ct chains demonstrate that substrate and nucleotide binding adhere to MWC allostery. Both T- and R-conformers are present in solution in substrate-bound ATCase, and alteration of the [T]:[R] equilibrium in the presence of nucleotides is evident based on NMR peak intensity ratios. In the presence of a non-hydrolyzable substrate molecule, Kay and Schachman also find no nucleotide-induced structural effect on the Ct chains, suggesting that nucleotides regulate ATCase allostery solely through alteration of the equilibrium ensemble.
4. Imidazole Glycerol Phosphate Synthase
Imidazole glycerol phosphate synthase (IGPS) is a 51 kDa heterodimeric enzyme that functions in the histidine and purine biosynthetic pathways. The enzyme contains two catalytic subunits, HisH (23 kDa), which produces ammonia and glutamate via hydrolysis of glutamine, and HisF (28 kDa), which catalyzes the cyclization and cleavage utilizing the ammonia and the substrate N’-((5’-phosphoribulosyl)formimino)-5-aminoimidazole-4-carboxamide-ribonucleotide (PRFAR) to generate 5-aminoimidazole-4-carboxamide ribotide (AICAR) and imidazole glycerol phosphate (IGP) (Figure 14).
Figure 14.
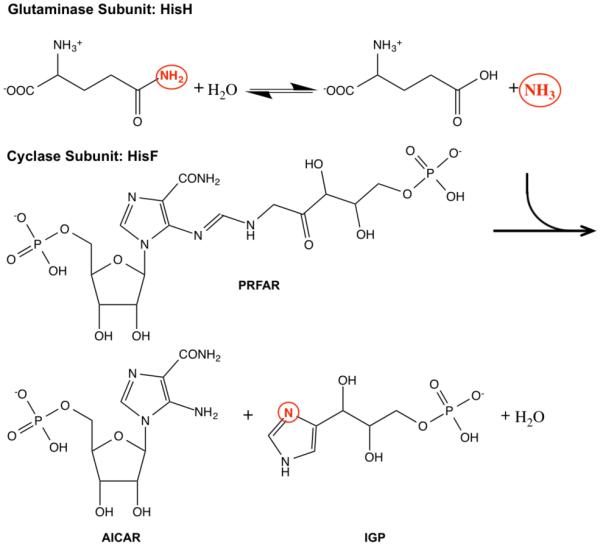
Reactions catalyzed by the IGPS heterodimer. Ammonia generated from glutamine hydrolysis in HisH travels to the HisF subunit where it is incorporated into IGP, a breakdown product of PRFAR.
4.1. Structure and Function
The first kinetic and structural characterizations of IGPS were reported over a decade ago, and since that time IGPS has been studied for its fundamental enzymatic properties,203,204 as a potential bacterial drug target,205 and for its mechanism of allosteric regulation.206 The HisF and HisH subunits are associated in a tight, non-covalent complex and in isolation, HisF and HisH have little appreciable activity. Moreover, the unliganded IGPS heterodimer also possesses negligible glutaminase activity. However, ammonia production in the HisH subunit is stimulated by the binding of PRFAR to the HisF subunit nearly 25 Å away (Figure 15A). Henceforth, we refer to the HisH/HisF heterodimer as IGPS to avoid confusion when discussing the individual, isolated subunits. Thus, PRFAR, the natural substrate of the HisF-catalyzed reaction, is also an allosteric effector of IGPS. Interestingly, the two products of the HisF reaction, AICAR and IGP, also stimulate glutaminase activity, though to a much lesser degree in which the affect of each activator (PRFAR, IGP, and AICAR) on enzymatic efficiency relative to the efficiency absent any ligand is ((kcat/KM)activator/(kcat/KM)basal)) PRFAR >> IGP > AICAR; 4900 >> 110 > 26). Despite well-characterized kinetics in the presence of substrates and activators, the allosteric mechanism is rather poorly understood. IGPS possesses liminal activity without PRFAR and a central question regarding allostery in this enzyme remains the mechanism of PRFAR activation of catalytic activity from a distance of 25Å.
Figure 15.

(A) X-ray crystal structure of the IGPS heterodimer (PDB 1GPW) with the HisH subunit shown in blue and the HisF subunit shown in grey. The catalytic Cys, His, and Glu triad residues of HisH are shown as green sticks, the Gln substrate analogue acivicin is shown in orange, and the allosteric effector PRFAR is shown in purple. (B) Bottom view of the HisF subunit showing the ammonia tunnel through the center of the protein. Passage of NH3 is believed to be gated at the HisH/HisF interface by conserved charged residues fArg5, fGlu46, fLys99, and fGlu167, shown as purple sticks.
Protein homology to known tunneling enzymes suggests that the newly generated NH3 enters the interface between HisH and HisF and then travels through a tunnel in the HisF (βα)8 barrel to the PRFAR binding site. Sequestration of NH3 from the aqueous environment by tunneling through the protein interior is also desirable to prevent formation of NH4+, which would be less nucleophilic for reaction with PRFAR than would NH3. Intersubunit communication and substrate tunneling are common features of glutamine amidotransferases,207,208 and have been well-characterized in PRPP amidotransferase209-211 and carbamoyl phosphate synthase.212-214 The hydrophobic ammonia tunnel and charged residue ‘gate’ are conserved in structures of yeast205 and bacterial215,216 IGPS, suggesting the enzyme functions similarly across species. Likewise, X-ray crystal structures of apo and complexed IGPS have identified potential pathways for ammonia transfer between the subunits, which is essential for synchronized glutaminase and cyclase activities. Wilmanns, along with Davisson, Smith, and coworkers first identified the putative NH3 tunnel through the central (βα)8 barrel of HisF (Figure 15B), suggesting its passage is regulated by a network of charged residues at the HisF interface that form salt bridges with hTyr1381 and hLys181.215,217 The gating mechanism may be regulated by a breathing motion in HisF as the barrel alternates between an ‘open’ and ‘closed’ conformation depending on the presence of bound ligand (Figure 16). Nonetheless, how PRFAR binding facilitates this process is not well understood.
Figure 16.
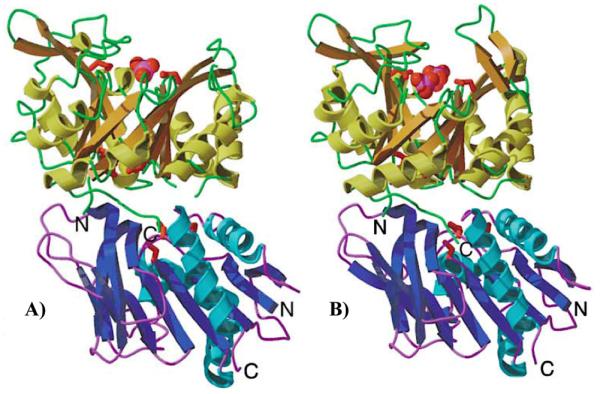
Structure of the IGPS enzyme complex showing (βα)8 barrel of HisF in the open (A) and closed (B) conformations with one and two phosphate ions bound, respectively. The effector binding site was inferred from positions of bound phosphate ions in these structures, which mark the locations of the phosphate end groups of PRFAR. HisF is shown in yellow ribbons, and HisH in blue ribbons. Figure reprinted from Ref. 215 with permission from Elsevier.
4.2. NMR Investigations of IGPS Allostery
IGPS, like other allosteric enzymes, contains thermodynamically linked active sites, and the widely accepted principles of allostery can be applied to its study. To this point, several solution NMR investigations by Loria and coworkers highlight a major role for the participation of protein motions in IGPS regulation, and allostery in general. Molecular dynamics simulations have supported these findings and dynamic pathways within IGPS have been identified.37 Studies on the structure and function of IGPS by Davisson and coworkers opened the door for characterization of its allosteric mechanism. Davisson first reported the linkage of glutaminase and cyclase activity of the enzyme made possible through the central ammonia tunnel and showed that the cyclase domain substrate, PRFAR, is also an allosteric activator of the enzyme, as are its breakdown products IGP and AICAR.218 The varying degrees of catalytic activation by PRFAR, IGP, and AICAR suggested a possible avenue toward understanding allosteric communication in IGPS.
4.2.1 IGP Binding
Fifteen years after the discovery of IGPS, the first NMR investigation by Lipchock and Loria probed millisecond conformational exchange processes in the HisF monomer and in HisF in complex with HisH to form the IGPS heterodimer in an attempt to gain insight into the allosteric mechanism.219 The effects of allosteric ligand binding on the glutaminase activity of IGPS have previously been examined,204 however, the structural and dynamic effects of ligand binding on the protein subunits have not been extensively characterized, and the role of molecular motions in the coupling of the distant active sites has not been determined.
HisF is folded and stable in monomeric form in the absence of HisH. Chemical shift changes (Δδ) in the HisF monomer upon titration with IGP indicated that 25 residues show significant Δδ and a global fit of these data produce an apparent dissociation constant of 2.8 ± 0.3 mM for IGP. The same experiment applied to HisF in the IGPS heterodimer yields a global fit of 19 shifted residues with a Kd of 0.5 ± 0.1 mM for IGP. Thus, formation of the heterodimer enhances IGP affinity to HisF by five-fold. Amino acid residues exhibiting significant chemical shift changes in the HisF monomer are not localized to the IGP binding site, but spread throughout the cyclase domain and into β-sheets 1-4, 7, and 8, which comprise the ammonia tunnel at the center of HisF. Residues within flexible Loop 1, thought to undergo conformational changes with ligand binding, also display substantial chemical shift perturbations.
Analysis of amide chemical shift changes is hindered by significant line broadening in the 1H-15N HSQC spectrum of the HisF monomer following binding of IGP (and PRFAR, vide infra) with as many as 55 residues observed in the spectrum of apo, monomeric HisF broadened beyond detection. NMR line broadening is a telltale sign of millisecond protein motion, commonly referred to as exchange broadening. However, based on previous resonance assignments,220 the amino acid resonances most altered by broadening form a connecting pathway from the cyclase site of HisF to the HisF/HisH interface. Several of the perturbed chemical shifts in the HisF monomer and IGPS heterodimer were found to be key residues at the interface of the enzyme (Figure 17), including fArg5, which is proposed to be involved in gating the ammonia transport tunnel.205,206,215 Similarly, titration of IGP into the IGPS heterodimer broadens 38 residues, including those in Loops 1 and 7, as well as some of the β-strands of the ammonia tunnel (Figure 17c).
Figure 17.

Interaction of IGP with HisF-IGPS shown by (A) 1H/15N combination chemical shift changes in HisF upon saturation with IGP determined by , (B) chemical shift changes with standard deviations of 1-4 from the average are mapped onto the HisF structure in a gradient of light to dark red spheres. Black spheres represent exchange-broadened residues. In (C) selected examples of IGP binding-induced exchange broadening is shown for residues 12, 20, 178, and 204. Resonances from the apo enzyme are shown in red (positive peaks) and green (negative peaks). Resonances from the IGP form are shown in blue (lower). Figure reprinted from Reference 219 with kind permission of Springer Science and Business Media.
Consistent with ligand-induced exchange broadening, binding of IGP also reveals changes in the millisecond dynamics of the HisF backbone based on increases in 15N-R2 values. Transverse relaxation rates () were measured for monomeric HisF and HisF-IGPS in the presence and absence of IGP. Values of R2 elevated above the trimmed mean are indicative of μs – ms motions (Figure 18).
Figure 18.

Residue specific values. Data are shown for (A) HisF, (B) HisF + IGP, (C) HisF-IGPS, and (D) HisF-IGPS + IGP. IGP was saturating (10 × Kd) in panels B and D. The horizontal red line indicates the 10% trimmed mean of the data points. Amino acid residues with significantly elevated values are indicated. Figure reprinted from Reference 219 with kind permission of Springer Science and Business Media
Although elevated R2 values can indicate enhanced μs – ms motions, a more robust test for these types of motions compares differences in R2 values (ΔR2) measured at short and long spin echo delays in a CPMG experiment. Large ΔR2 values identify residues involved in conformational exchange,90 and apo HisF contains five residues with elevated ΔR2 from this analysis; Thr21, Lys37, Lys99, Ala200, and Phe229. Of particular interest are Thr21, which resides on Loop 1 and is involved in ligand-induced conformational changes, and Lys99, which is part of a conserved salt bridge at the entrance of the ammonia channel near the HisF/HisH interface.
Detailed analysis of the kinetic, structural, and thermodynamic parameters that describe the molecular motions can be obtained through CPMG relaxation dispersion experiments (Section 2.1). CPMG relaxation dispersion experiments on the IGP-bound HisF monomer show 18 residues exhibiting dispersion profiles, and Figure 19 displays representative dispersion curves for each residue experiencing millisecond conformational exchange, with exchange contributions (Rex) ranging from 3 – 20 s−1. These experiments conclusively demonstrate that IGP binding stimulates an increase in motions within the HisF monomer, particularly in Loop 1 and the heterodimer interface.
Figure 19.

CPMG dispersion curves for IGP-bound HisF. TROSY-based CPMG dispersion curves were determined for 18 residues in apo HisF. Equation (21) was fit to each relaxation series to determine Rex = (pA pB Δω2 / kex), for each residue. The residue specific value of Rex is shown above each graph. Figure reprinted from Reference 219 with kind permission of Springer Science and Business Media.
The exchange contribution to R2 due to conformational exchange motions, , was determined for each residue undergoing dispersion. Measurement of residue-specific Rex values presents opportunities for additional insight into conformational motions. In this case illustrated by Figure 19, if conformational motions in the presence of bound IGP occur between an IGP-bound structure and one that resembles the apo enzyme then the dynamic chemical shift difference, Δω should be equal to the chemical shift difference between the apo and IGP-bound enzyme (Δδ). For these residues a plot of Rex vs. (2πΔδ)2 should be linear with slope equal to pApB/kex if that group of residues experiences the same conformational motion, i.e. they have the same exchange kinetics and equilibrium populations. Lipchock and Loria plotted (2πΔδ)2 versus Rex where Δδ is the 15N chemical shift difference between apo HisF and IGP-bound HisF for the residues undergoing dispersion. For a select group of residues this plot gives a linear slope, indicative of a singular global process for these amino acid residues. These findings provide strong evidence that Rex represents a concerted two-state conformational change, presumably between the apo state and IGP-bound state. These dynamic processes provide insight into the ability of HisF to relay effector binding to the HisF/HisH interface, and perhaps stimulate activation of the glutaminase subunit. Overall, the binding of IGP to HisF activates glutaminase activity (~ 100-fold increase) and results in increased conformational exchange in the HisF monomer and IGPS.219 However, several lines of evidence suggest that the allosteric activation in IGPS involves little to no conformational change but rather an enhancement of molecular motions. First, the observed chemical shift changes are quite small, on the order of a few tens to hundreds of parts per billion. Chemical shifts are exquisitely sensitive to changes in structure and these small ligand-induced shifts predict very minor structural alterations. Second, fluorescence-quenching experiments87 show no differences between apo, IGP, or PRFAR bound IGPS suggesting identical tryptophan environments in all structures. Thus, the experimental data suggest that enhanced motions are the primary mode of allosteric information transfer. To further understand the details of the propagation of ligand-dependent motions to the glutaminase active site, Loria and coworkers examined the dynamics of several other ligand-bound IGPS complexes.
4.2.2. PRFAR Binding
In the discussion that follows all data refer to the IGPS heterodimer in which HisF has been isotopically labeled with spin-1/2 nuclei and HisH has been perdeuterated. To circumvent the problems of exchange-broadened amide resonances that occur in IGPS bound to an allosteric effector ligand, NMR experiments were performed on 13C methyl ILV-labeled enzyme due to the favorable relaxation properties of isolated methyl groups. Experiments were performed on apo, binary acivicin (a covalently bound Gln analogue) and PRFAR bound complexes and the ternary acivicin and PRFAR complex. 1H-13C MQ CPMG relaxation dispersion experiments on binary and ternary complexes of IGPS show a varying degrees of dynamics observed in the dispersion data of Ile, Leu, and Val residues.
ILV labeled (HisF) apo IGPS shows the fewest residues (17) with positive dispersion profiles (Figure 20). Interestingly, all flexible residues appear to be localized to one half of HisF (opposite Loop 1) forming a clustered network. Fits of the individual curves produce values of kex ranging from 110 – 440 s−1.87
Figure 20.

(A) Representative MQ dispersion curves for HisF residues showing positive dispersion. (B) All residues exhibiting dispersion are mapped onto the HisF structure in the IGPS complex, with HisH colored blue, HisF colored grey, and individual atoms with dispersion shown in bright orange. Figure reprinted from Reference 87 with permission from Elsevier.
Covalent modification of catalytic Cys84 with the Gln analogue acivicin221 to mimic the binary Gln complex, results in the same number of residues showing dispersion, nearly all of which match those observed in the apo enzyme. Dynamic residues unique to the binary acivicin complex only lengthen the network of residues across from Loop 1, eventually spreading to the HisF/HisH interface. Conformational exchange rates similar to the apo enzyme were reported, with kex ranging from 100 – 490 s−1. Thus, neither apo IGPS nor IGPS with an occupied glutaminase active site show a significant number of flexible residues. Similar conclusions were reached from NMR relaxation experiments focusing on 15N-amide and 13C-alanine labeled samples.
The formation of a binary complex between apo IGPS and its allosteric effector PRFAR leads to substantial changes in the millisecond motions of the enzyme. As noted previously with monomeric HisF, over 60 residues in the 1H-15N HSQC HisF-IGPS spectrum are broadened beyond detection, consistent with the onset of intermediate exchange dynamics upon ligand binding (Figure 21). These exchange-broadened residues form a network connecting the PRFAR cyclase site to the HisF/HisH interface along one half of the protein. Several of the dynamic residues (Arg5, Ile42, Gly121, Glu159, Thr195, Phe210, Arg230, Ile232, Asp233, Arg249) span the HisF/HisH interface, which is over 10 Å away from the PRFAR binding site. Isothermal titration calorimetry (ITC) experiments show PRFAR binding to be entropically favored in the presence (TΔS = 17.8 kcal/mol) and absence (TΔS = 14.5 kcal/mol) of acivicin, consistent with increased conformational flexibility.
Figure 21.

Chemical shift perturbations upon PRFAR binding to 15N-labeled HisF-IGPS. (A) Overlay of 1H-15N TROSY spectrum of apo (orange) and PRFAR-bound (blue) IGPS. (B) 1H/15N composite chemical shift changes in HisF upon saturation with PRFAR determined by . Resonances broadened beyond detection are indicate intermediate exchange and are denoted with negative chemical shift values. (C) Chemical shift changes from 0.1 – 0.35 ppm are mapped onto the HisF structure as a gradient from pink to red spheres. Exchange broadened residues are shown as black spheres, and PRFAR is shown in blue sticks. Figure partially adapted from Reference 87 with permission from Elsevier.
Multiple-quantum CPMG experiments monitoring methyl groups in an ILV labeled PRFAR binary complex also reveal nearly 40 residues undergoing millisecond motions, with many having larger dispersion amplitudes than those in apo IGPS. Motions in IGPS become more “global” in the binary PRFAR complex, spanning the HisF subunit. However, dynamic side chains are almost always located on β-sheet structures, primarily those comprising the ammonia channel near the center of the HisF monomer. Conformational exchange rates are also significantly elevated, with kex values ranging from 100 – 3600 s−1. Thus, whereas PRFAR binding does not result in large chemical shift changes or different fluorescent changes compared to apo or Gln bound IGPS, it does cause widespread increases in millisecond sidechain motions.
Formation of the PRFAR/acivicin ternary complex results in fewer overall millisecond motions when compared to the PRFAR binary complex. However, there are still more than double the number ILV residues undergoing conformational exchange (38) than are detected in the apo or binary acivicin complex. Perhaps more importantly, dynamic residues in the ternary complex can be fit to a global model of motions with a single exchange rate constant (kex = 225 ± 30 s−1). Of the 38 dynamic residues, 22 exhibit dispersion in binary PRFAR IGPS, and 6 show dynamic behavior in all complexes. Dispersion curves for several residues undergoing conformational exchange in all IGPS complexes are shown in Figure 22. The dispersion profiles, and therefore the conformational exchange parameters are dependent on the chemical nature of the bound ligand.
Figure 22.
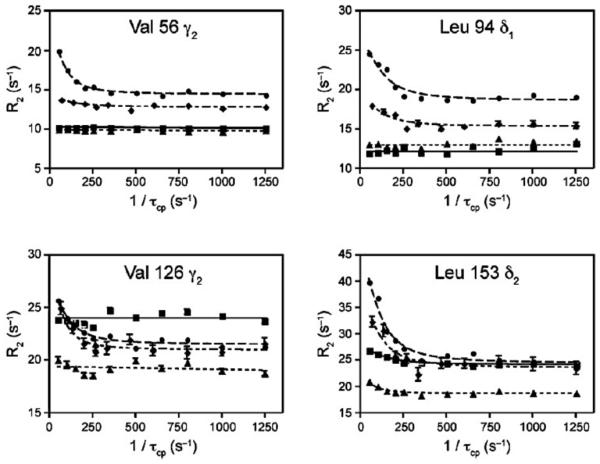
Comparison of dispersion profiles for apo (squares), binary-acivicin (triangles), binary-PRFAR (circles), and ternary HisF-IGPS (diamonds). Figure reproduced from Reference 87 with permission from Elsevier.
In total, eight residues unique to the ternary complex undergo millisecond conformational exchange. Changes in dynamics, coupled to formation of both binary and ternary IGPS complexes are summarized visually in Figure 23.
Figure 23.

(A) Venn diagram summarizing relationships between dynamic residues determined from 13C-ILV relaxation dispersion experiments and the enzyme complex in which they occur for apo (black), binary acivicin (green), binary PRFAR (blue), and ternary PRFAR (red). Residues common to all four complexes are shown in the center with larger font. (B) Ile, Leu, and Val methyl groups exhibiting dispersion in the binary and ternary PRFAR complexes mapped onto the structure of IGPS. Residues with dispersion in only the PRFAR binary complex are shown as blue spheres, only in the PRFAR ternary complex are shown as red spheres, and those common to both are shown as magenta spheres. Figure reproduced from Reference 87 with permission from Elsevier.
As pointed out by Reinhart, the ternary complex and its distinguishing features from the apo and binary complexes is of critical importance in the study of allostery.222,223 Therefore, it was interesting to note the unique dynamics that exist in the IGPS-PRFAR-acivicin ternary complex. Lipchock et al, in addition to studying ms motions, examined the nonadditive (or “synergistic”) chemical shift differences due to ligand binding.87 Synergistic effects of ligand binding are measured as chemical shift difference between complexed forms of IGPS and that of the apo form i.e. ΔΔδ = ΔδTern – ΔδAciv – ΔδPRFAR, where Δδx = δx – δapo. A non-zero value of ΔΔδ indicates synergy or additional changes in the ternary complex that are not accounted for in the summation of chemical shifts for the individual binary complexes. This experiment is a chemical shift analogy to double-mutant cycles or synergistic ligand binding experiments. Ten residues (Val12, Val48, Leu50, Val126, Leu153, Ile168, Leu222, Val226, Leu234, Leu237) display such synergistic effects (Figure 24).
Figure 24.

(A) Synergistic chemical shift changes due to ligand binding plotted as 13C ΔΔδ between the two binary forms of HisF-IGPS and the ternary complex. (B) Residues with a nonadditive value of ΔΔδ ≥ 1.5 σ from the mean are mapped onto the HisF structure in IGPS and shown as magenta spheres. Figure reproduced from Reference 87 with permission from Elsevier.
Much like the relaxation dispersion data, these residues highlight a path by which the HisH and HisF subunits could be coupled, with a network of residues spanning the Loop 1 side of the HisF monomer to the heterodimer interface. Six of the ten synergistic residues show dispersion, suggesting a connection between synergistic chemical shift changes and sites of millisecond motions. Further, each of the synergistic residues identified in the ternary complex are located at or near functionally essential sites within the protein.87
It is well known that the products of PRFAR cleavage reaction, IGP and AICAR, are also activators of IGPS, albeit at a significantly reduced level.218,204 IGP is a stronger activator than AICAR, implying the imidazole portion of PRFAR is more important for the allosteric regulation of IGPS. Interestingly, the results of Lipchock and Loria show that Ile, Leu, and Val residues experiencing PRFAR-induced conformational motions are clustered toward the IGP portion of PRFAR, consistent with this hypothesis.
Fast motions (ps – ns) probed by 1H-1H dipolar cross-correlated relaxation provide an intramethyl relaxation rate, η, reflecting configurational entropy of the methyl groups within IGPS. The η parameter is proportional to the S2 order parameter and provides a measure of methyl group rigidity. Values of η for the Ile, Leu, and Val residues of HisF-IGPS compared across the apo, binary acivicin, binary PRFAR, and ternary complexes reveal minimal global changes, indicating that ps – ns motions do not appear to vary with bound ligand to the extent that ms motions do. Moreover, the data suggest that changes in configurational entropy due to changes in ps – ns motions are not a primary driver of the large entropy of PRFAR binding.87 However, several individual ILV residues show changes in η among the complexes, pointing to small alterations in the ps – ns motions in local regions of IGPS.
4.2.3. Transmission of the Allosteric Signal
Thus far, Loria and coworkers have shown that allosteric effector binding to the HisF subunit of IGPS causes minimal structural changes, but greatly stimulates millisecond motions throughout the enzyme. The synchronization of ammonia production with the cleavage and cyclization of PRFAR nearly 25 Å away appears to be largely dependent on changes in protein motions, in the absence of notable large-amplitude structural alterations. Of particular importance is the reorientation of the Pro49-Gly50-Val51-Gly52 loop (PGVG, Figure 25) in the HisH subunit, which is necessary to stabilize the negative charge of the oxyanion hole in the tetrahedral reaction intermediate.209,216,224
Figure 25.
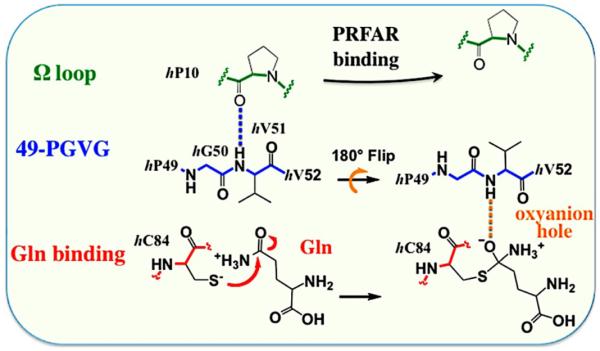
Schematic representation of conformational changes required for stabilization of the oxyanion hole formed during hydrolysis of glutamine. Adapted from Reference 37. Copyright (2012) National Academy of Sciences.
Although the PGVG loop requires a 180° rotation to stabilize the oxyanion, crystallographic B-factors do not indicate significant disorder, suggesting effector binding influences the propensity for loop motion. Further, there are no large secondary or tertiary structural changes in crystallographic reports of apo or binary-PRFAR IGPS complexes.205,206,215,216
NMR experiments have tracked dynamic changes within this loop during formation of the ternary complex hoping to understand the propagation of millisecond dynamics from the PRFAR binding site to the HisF/HisH interface to motions in the PGVG loop. The 1H-15N HSQC NMR spectrum of HisH labeled apo IGPS displays a sharp resonance for loop residue Gly50, which broadens beyond detection with increasing concentrations of PRFAR (Figure 26), suggesting PRFAR-induced conformational motions span the interface of the heterodimer into the HisH active site and the PGVG oxyanion loop. This observation is also bolstered by molecular dynamics simulations that show enhanced motions in the PGVG loop in PRFAR-bound, but not apo, IGPS.37
Figure 26.

(A) Cartoon representation of the oxyanion hole formed by the PGVG loop (cyan) with the catalytic Cys84 residue. Activation of HisH is predicted to require flipping of the amide bond, presenting the amide proton of Val51 to stabilize the oxyanion reaction intermediate. (B) Resonance broadening of Gly50 in 1H-15N HSQC spectrum of HisH-IGPS upon titration with PRFAR. The Gly50 resonance is broadened beyond detection when saturated with PRFAR; apo (red) 0.038 mM PRFAR (orange), 0.150 mM (yellow), 0.220 mM (green), 0.290 mM (blue), 0.87 mM (purple, 99.8 % saturated). Figure reproduced from Reference 87 with permission from Elsevier.
4.2.4. Summary of NMR Results
CPMG relaxation dispersion experiments highlight millisecond motions as an important component of allostery in IGPS. Ligand effects on ms motions in binary complexes are small for the glutamine analogue acivicin and larger in binary complexes with allosteric effectors (PRFAR > IGP). However, there appears to be a synergistic relationship between dynamic residues in the ternary complex with acivicin and PRFAR. Motions exclusive to the ternary complex reveal a continuous network of residues linking the allosteric cyclase site to the HisF/HisH interface, presumably as a way to control HisH activation. Similarly, Loop 1 residues within HisF, which change conformation upon ligand binding, show little chemical shift changes, but do broaden beyond detection, indicating a change in the timescale of their motion. Even without significant chemical shift changes, several Loop 1 residues still exhibit dispersion in the binary acivicin (Val18Cγ2), binary PRFAR (Val18Cγ1) and ternary complexes (Val17Cγ2, Val18Cγ1).
NMR data collected on both subunits of the IGPS heterodimer offer some insight into the allosteric mechanism of the enzyme. The data suggest a rigid apo HisH monomer with an improperly formed oxyanion hole becomes catalytically active upon PRFAR binding to HisF due to the stimulation of ms motions, most importantly in the PGVG loop.87 It is suggested that these motions aid in breaking a critical hydrogen bond between hP10 and hG50 that otherwise hold the oxyanion loop in a state that is nonconducive for catalysis (Figure 25). This is supported by X-ray crystal structures of yeast IGPS-PRFAR complexes, which report significantly elevated B-factors in the PGVG loop region.206 Also, the crystal structure of apo HisH from T. maritima does not show an elevated B-factor, consistent with the observation that in the absence of bound PRFAR, the Gln site in HisH has negligible catalytic activity.225 Thus, if HisH remains inactive without PRFAR-induced millisecond motions, it does not follow a “pre-existing equilibrium”-type allosteric model. However, the possibility remains that IGPS catalysis involves conformational changes that have yet to be detected by modern solution NMR methods and requires further investigation.
5. Aminoglycoside N-(6’)-Acetyltransferase Ii
5.1. Structure and Function
The antibiotic resistance of bacteria has been, and continues to be, a growing worldwide problem.226-228 Several well-known bacterial strains, such as vancomycin-resistant Enterococci (VRE) and methicillin resistant S. aureus (MRSA) are refractory to antibiotic treatment. Bacteria circumvent the effects of standard aminoglycoside-based antibiotics through chemical modifications that alter the affinity of the drug for ribosomal RNA (rRNA),229,230 where their task is to inhibit translation. The bacterial enzymes responsible for modifying aminoglycoside-based drugs, and therefore conferring antibiotic resistance, fall into three classes that either N-acetylate, O-phosphorylate, or O-adenylate their targets.229,230 To this point, limited structural information exists on these enzymes, but at least one X-ray crystal structure from each class has been solved.231-234 One of these enzymes, aminoglycoside 6’-N-acetyltransferase-Ii (AAC(6’)-Ii), has been particularly well-studied due to its homology with numerous members of the GCN5-related N-acetyltransferase (GNAT) superfamily, as well as its similarity to some histone acetyltransferases.234,235
Two structures of AAC(6’)-Ii have been determined, including one in the presence of its required cofactor, acetyl coenzyme A (AcCoA, Figure 27).
Figure 27.

X-ray crystal structure of A) dimeric and B) monomeric (after 90° rotation from A) AAC(6’)-Ii (PDB 1N71) bound to AcCoA. The N-terminal arm of monomer 1, composed of residues 1-103, is shown in grey, and the C-terminal arm containing residues 104-182 is shown in blue. The N-terminal and C-terminal arms of monomer 2 are colored green and red, respectively. AcCoA is shown in pink sticks in both structures and the flexible hinge connecting the two domains of the monomer (B) is shown in red.
The AAC(6-)-Ii monomer is a pseudo-symmetric V-shaped enzyme composed of two domains, called the N- and C-terminal arms. Each arm contains a central antiparallel β-sheet flanked by α-helices, creating a deep binding cleft through the center of the protein. Interestingly, gel filtration chromatography suggests that in solution AAC(6’)-Ii is dimeric,236 consistent with NMR experiments that will be discussed in the coming sections.
The AcCoA cofactor is wedged in the central cavity, interacting with both arms of the enzyme (Figure 28). The majority of the nine hydrogen bond contacts formed between AcCoA and AAC(6’)-Ii are with the N-terminal arm, mostly involving the amide backbone of the protein (only two amino acid side chains are involved in hydrogen bonding with AcCoA). The ε-amino group of Lys149 forms a salt bridge with the 3’-phosphate of AcCoA and a water-mediated hydrogen bond with the AcCoA adenine ring, while the hydroxyl group of Thr89 interacts with the α-phosphate moiety. The AcCoA molecule also forms numerous van der Waal’s contacts with the enzyme, particularly along the N-terminal arm. Most notably, hydrophobic patches of residues (Thr24, Trp25, Leu76, Val78, Pro143, Phe146) enclose the pantothenic acid and β-mercaptoethylamine substituents of AcCoA. The elongated orientation of AcCoA within the enzyme cavity is proposed to act as a “β-strand extension” to the N-terminal arm, which is accommodated by the flexible hinge joining the two domains.
Figure 28.
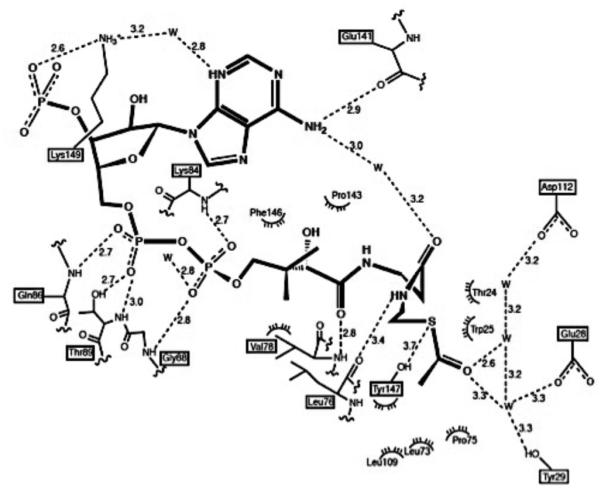
Summary of interactions between AcCoA and the AAC(6’)-Ii enzyme. Residues from the N-terminal arm (1-103, clustered at the bottom of the figure) and C-terminal arm (104-182, upper four labeled residues) interact with AcCoA (dark lines), with dashed lines indicating hydrogen bonds and semicircles indicating hydrophobic contacts. Hydrogen bond distances are given in Angstroms, as determined in Ref. 235. Figure reprinted from Reference 235 with permission Elsevier.
In the absence of an aminoglycoside substrate, the position of the AcCoA sulfur atom (the site of acetylation) can be used to infer the proper binding location of the drug.235 The AcCoA sulfur moiety rests between the arms in a cleft composed of Trp25, Glu27, Glu28, Asp112, and Leu114. Wright, Berghuis and coworkers, reporters of an initial structure of AAC(6’)-Ii, take note of the exceptionally small substrate access area at the acetylation site and suggest only the 6’ (or 3’, in AAC(3’)-Ii) amino group actually enters the cleft.235 The earliest NMR studies of AAC(6’)-Ii, which will not be discussed in detail, examined the binding conformation of aminoglycosides complexed with AAC(6’)-Ii.237 However, these results were less clear regarding the binding location of the 6’ amino group.
5.1.1. Structural Flexibility and Cooperativity
More recent crystallographic studies have captured the dimeric structure of AAC(6’)-Ii, corroborating solution-state findings. Berghuis and coworkers have reported two different structures of dimeric AAC(6’)-Ii, observing significant positional flexibility in the C-terminal lobe, which modulates the “openness” of the binding cleft above the hinge.238 The conformational differences observed within the dimeric crystal structures may be related to the catalytic mechanism. These crystallographic results, coupled with solution proteolysis experiments, suggest AAC(6’)-Ii is in a more compact, closed conformation when AcCoA and substrate are bound, findings similar to those of other GNAT enzymes, which are all less susceptible to proteolytic degradation in the presence of AcCoA.234
Binding of AcCoA to the AAC(6’)-Ii dimer enhances the enzyme's affinity for aminoglycoside substrates, an example of heterotropic positive cooperativity. Kinetic studies by Wright and coworkers first identified this trend,239 and the dimeric AAC(6’)-Ii structure of Burk et al published in the same year shows well-separated ligand binding sites, pointing to a dynamic origin of regulation.13 Plasticity in the C-terminal arm, especially near interfacial residues 128-135, may be a regulator of cooperativity through alteration of interactions with the helices at the interface of the adjacent monomer, perturbing the structure. Conformational changes of this type suggest the originator of the communication relay could be the α4-helix of the C-terminal arm, which is not conserved among the GNAT superfamily.240
5.1.2. Thermodynamics of Ligand Interactions
The kinetic parameters for the acetylation of numerous aminoglycosides have been determined for members of the GNAT superfamily, including AAC(6’)-Ii.236,239 The kinetic mechanism put forth by Wright and coworkers involves initial binding of AcCoA, followed by aminoglycoside binding and subsequent nucleophilic attack of its 6’ amino group at the thioester of AcCoA, generating a proposed tetrahedral intermediate. Decay of the intermediate ultimately generates the reaction products, a 6’-N-acetylaminoglycoside and CoA. The observed kinetic cooperativity manifests as an enhancement of the turnover rate in the adjacent monomer following CoA binding.
ITC thermograms monitoring binding of various aminoglycosides to AAC(6’)-Ii are fit to models describing both cooperative and independent binding sites with non-equivalent thermodynamics.239,241 The cooperative model is superior for these data, suggesting two identical, thermodynamically coupled binding sites.241 A range of low micromolar Kd values are found for these aminoglycosides, which are similar for each independent binding event. Substrate-dependent enthalpies of the first and second binding events are also comparable, ranging from 30-90 kcal/mol. Addition of CoA to the titration reduces the binding enthalpy by a factor of two; however, the overall free energy remains constant (ΔG1 ~ 9 kcal/mol, ΔG2 ~ 8 kcal/mol). Interestingly, Kd values decrease by an order of magnitude (high nanomolar range) in the presence of CoA, suggestive of a cooperative effect in aminoglycoside binding.
5.1.3. Inhibition
Inhibition of AAC(6’)-Ii with desulfo-CoA, which lacks a thioester moiety, and paromomycin, which lacks a 6’-amino group, provide useful probes of the catalytic mechanism.239,242 The 2003 report of Draker et al describes partial competitive inhibition of AAC(6’)-Ii by desulfo-CoA, expressed as Kis = αKi, where α is the change in Km when the inhibitor is bound to the ES complex. At varied concentrations of AcCoA, Kis is reported to be 6.58 ± 2.18 μM.239 Paromomycin uncompetitively inhibits AAC(6’)-Ii, suggesting it can bind the AAC(6’)-Ii-AcCoA binary complex or the AAC(6’)-Ii-CoA product complex, where paromomycin may prevent the release of CoA.239 A third compound, 6’-N-acetylribostamycin (AcRibo) is a noncompetitive/mixed inhibitor against unmodified aminoglycoside substrates. Inhibition by AcRibo is proposed to originate from binding to the AAC(6’)-Ii-CoA complex.14 Exhaustive detail of the binding and inhibition kinetics of AAC(6’)-Ii are beyond the scope of this review, and are summarized in their entirety in Table 1 of Reference.239
In a separate effort to perturb ligand binding to AAC(6’)-Ii, Berghuis, Auclair and coworkers developed a series of synthetic aminoglycoside-CoA bisubstrate derivatives that proved to be nanomolar competitive inhibitors of the enzyme (Figure 29).242 These bisubstrate analogues mimic the proposed tetrahedral intermediate, resulting in structures with amide-based aminoglycoside-CoA linkages. The compounds detailed in Reference 242 provide insight into the reactions of acetyltransferases based on knowledge of their structures, however, more detailed kinetic and thermodynamic investigations are required to determine the effect of these inhibitors on the cooperative mechanism.
Figure 29.

Representative aminoglycoside-CoA bisubstrate inhibitors of AAC(6’)-Ii synthesized as described in Ref. 242 with (A) varying substituent groups appended to the ring system and (B) varying linker length between the amide-CoA thioester bond. Nanomolar (nM) inhibition constants (Ki) for the compounds 1-3 in (A) are (1) 76 ± 25; (2) 111 ± 28; (3) 119 ± 14. Ki values for compounds 11a-c in (B) are (11a) 43 ± 23; (11b) 161 ± 98; (11c) 7990 ± 2663.
5.2. Joint NMR & ITC Analysis of AAC(6’)-Ii
As the study of allostery has expanded, descriptions of enzymatic systems that do not fit the paradigms of the MWC or KNF models have emphasized probabilistic thermodynamics over subunit coupling effects.6,16,32,243, As noted in Section 1.2, the emergence of the EAM provides alternative origins for enzymatic regulation while remaining true to the general concepts of allostery and is particularly useful for the study of dynamic or disordered proteins.32,244 The EAM treats ligand-induced conformational changes (i.e. T → R) in protein subunits as a dynamic equilibrium between symmetric and asymmetric oligomeric states, where the MWC and KNF models are the extreme limiting cases. The thermodynamic balance of the equilibrium is dependent on the energy gap of the conformational change, as well as changes in the strength of the subunit interactions. More importantly, the EAM presents an extra subset of principles with which to create a mixed model of allostery, which as shown below adequately describes allostery in the AAC enzyme system.
A 2014 report by Mittermaier and coworkers details a combinatorial approach of biophysical techniques, namely NMR and CD spectroscopies and ITC in the development of mixed allosteric models for enzymes.245,246 Interestingly, the authors provide evidence that allosteric transformations of the enzyme aminoglycoside N-(6’)-acetyltransferase Ii (AAC(6’)-Ii) are MWC-type for ligand binding at its dimer interface, and KNF-type for distal ligand binding. These data are also discussed in reference to probabilistic allosteric phenomena described by the EAM.
The homodimeric enzyme AAC(6’)-Ii is responsible for the transfer of acetyl groups from its substrate AcCoA to various aminoglycosides, providing bacterial resistance to these drugs.236 ITC experiments have shown that each substrate binds with different enthalpies, as well as different KITC values. The 1H-15N HSQC NMR spectrum of apo AAC(6’)-Ii is missing ~ 20% of the expected resonances, suggestive of a partially unstructured enzyme. The narrow 1H resonance dispersion is also consistent with that of an unstructured polypeptide (Figure 30A). Further, apo-AAC(6’)-Ii does not appear to sample the ‘holo-like’ (ligand saturated) structure that would be expected for an enzyme with MWC-type allostery, as NMR studies show no ‘holo-like’ resonances in the absence of bound ligand (Figure 30). However, when the allosteric effector paromomycin, a representative aminoglycoside, is titrated into solutions of AAC(6’)-Ii, structural changes resulting from effector binding are evident. Saturation of AAC(6’)-Ii with paromomycin (holo AAC(6’)-Ii) produces a spectrum characteristic of a well-folded protein, shown in Figure 30B, with the appearance of many resonances that are unique to the holo enzyme. No exchange between apo- and holo-like structures was observed in either spectrum, as residues exhibiting the largest chemical shift perturbations between apo- and holo-AAC(6’)-Ii were not selectively broadened.
Figure 30.

1H-15N HSQC NMR spectra of (A) apo-AAC(6’)-Ii and (B) paromomycin-bound AAC(6’)-Ii. (C) X-ray crystal structure of AAC(6’)-Ii bound to a bisubstrate inhibitor where backbone chains of the two subunits are colored grey and yellow, and the aminoglycoside and CoA portions of the ribostamycin-based inhibitor are colored red and blue, respectively. Figure reprinted by permission from Macmillan Publishers Ltd.246
The HSQC spectra of paromomycin- and AcCoA-saturated AAC(6’)-Ii are similar (compare Figure 30B & Figure 31B), suggesting the two structures are also similar. While there are currently no X-ray crystal structures of AAC(6’)-Ii complexed with aminoglycosides, structures of AcCoA, CoA, and several inhibitor-bound binary complexes of AAC(6’)-Ii have been solved.235,238,247
Figure 31.
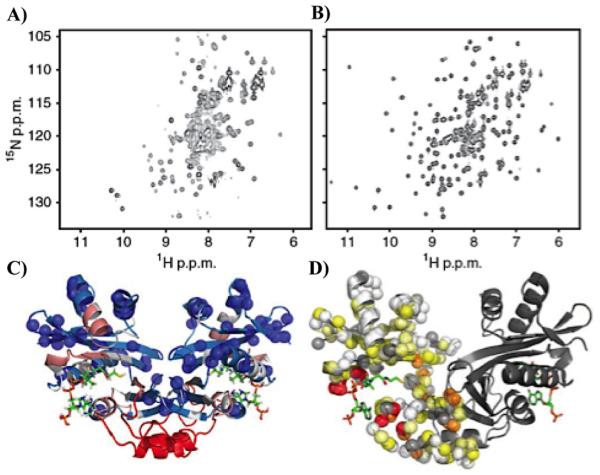
1H-15N HSQC spectra at 800 MHz of (A) apo AAC(6’)-Ii and (B) AAC(6’)-Ii saturated with AcCoA. X-ray crystal structures below display (C) AcCoA-bound AAC(6’)-Ii (PDB 2A4N) with AcCoA shown in green sticks and residues with assigned cross peaks in the HSQC spectrum shown as blue spheres. (D) Apparent chemical shift differences between the apo- and holo-enzyme mapped onto the structure of AAC(6’)-Ii. Amide nitrogen atoms of one subunit are shown as spheres indicating Δδapp < 0.5 ppm (white), 0.5 ≤ Δδapp < 1 (light yellow), 1 ≤ Δδapp < 2 (dark yellow), 2 ≤ Δδapp < 4 (orange), and 4 ≤ Δδapp (red). Spheres indicating unassigned residues are colored grey. Figure reprinted by permission from Macmillan Publishers Ltd.245
One of these inhibitors, comprised of a CoA-like molecule covalently attached to an aminoglycoside, occupies the same binding site as paromomycin and is a useful model molecule to pinpoint key chemical shift perturbations between the paromomycin- and AcCoA-AAC(6’)-Ii complexes. Binding of this bisubstrate inhibitor perturbs several chemical shifts by nearly 3 ppm (Figure 30C, green spheres), and the largest Δδ occur near the substrate binding site, suggesting small differences in the paromomycin- and AcCoA-AAC(6’)-Ii NMR spectra originate from local interactions with the ligands. Resonances with the largest Δδ (~ 3 ppm) are located at the interface of the homodimer, indicating that intersubunit contacts are slightly modified by the two ligands.
Binding of paromomycin to AAC(6’)-Ii is slow on the NMR timescale, and resonances for both apo- and holo-AAC(6’)-Ii are observed with intensities proportional to their respective populations.246 Since AAC(6’)-Ii can bind zero (apo), one (1-bound), or two (2-bound, 1 per subunit) paromomycin ligands, NMR peak intensities are useful for separating signals associated with each ligation state of AAC(6’)-Ii. Attempts to correlate the NMR signals to expected ligand binding parameters based on peak intensities are hindered by spectral overlap and broadening, particularly for the presumed 1-bound state. However, Mittermaier and coworkers employ a joint analysis using ITC and NMR to differentiate thermodynamic contributions of several ligation states to AAC(6’)-Ii allostery. Here, ligand-binding parameters from ITC inform on the expected fractions of apo-, 1-bound, and 2-bound (f0, f1, f2, respectively) paromomycin complexes (Figure 32). The intensities of each well-resolved apo- and holo-AAC(6’)-Ii resonance are then fit with ITC-derived f0, f1, and f2 values and the contribution of the 1-bound state relative to fully apo or holo was adjusted as follows.246 Once normalized to a value of 2, changes in the intensities of the initial apo and final holo resonances are calculated by and where and are the contributions of singly-bound paromomycin to the apo and holo subunit resonances, respectively (Figure 32B).
Figure 32.

Combined ITC-NMR analysis presented by Mittermaier and coworkers describing the allosteric behavior of AAC(6’)-Ii. (A) ITC-determined populations of apo- (red), singly bound- (blue), and doubly-bound (yellow) forms of the paromomycin-AAC(6’)-Ii complex. (B) Representative normalized intensities of the apo- (yellow points, dashed red line) and holo- AAC(6’)-Ii (green points, solid blue line) resonances for Gly136 as a function of ligand concentration. (C) Histogram depiction of relative contributions of the singly-bound enzyme to apo- () and holo-AAC(6’)-Ii (). Intensities from 19 apo peaks and 37 holo peaks from the 1H-15N HSQC spectra were included, and peak intensities were recorded at 15 different concentrations of paromomycin. Figure reprinted by permission from Macmillan Publishers Ltd.246
The changing intensity profiles of the apo and holo resonances are well approximated in the ITC-NMR analysis (Figure 32), giving a calculated normalized value of approximately zero for , indicating no significant contribution from the one-bound state to the intensity of the apo resonance. However, ≈ 2, meaning that singly-bound and doubly-bound AAC(6’)-Ii contribute equally to the intensity of the holo resonance. Based on this analysis, the authors conclude the one-bound form must be structurally similar to the holo enzyme and conformational changes necessary for activity must accompany binding of one equivalent of aminoglycoside. These data suggest that the paromomycin-bound subunit is similar in structure to the adjacent unbound subunit. This type of symmetry is consistent with MWC-type allostery.246 Interestingly, a similar analysis of AcCoA binding reveals that both and ≈1, a scenario interpreted to be more consistent with KNF allostery. Thus, AAC(6’)-Ii exhibits characteristics of KNF and MWC allostery depending on the chemical structure of the ligand.
The mixed allosteric behavior of AAC(6’)-Ii cited by Mittermaier and coworkers necessitates the application of thermodynamic principles to properly describe of the cooperative binding of paromomycin, and their proposed model is very similar to the EAM.16 NMR experiments show that apo- and holo-AAC(6’)-Ii subunits are structurally different, while ITC and CD spectroscopy reveal partial subunit unfolding near physiological temperatures while retaining native quaternary structure. Such a case is proposed to include a combination of native and unfolded subunits within the dimers, with some in the apo and others in the holo form (i.e. AA + AU + UA + UH + HU + HH, where A = apo, H = holo, and U = unfolded subunits).246 NMR experiments also demonstrate that a single equivalent of paromomycin (P) causes both subunits to adopt a holo-like conformation, leading the authors to conclude that the unbound subunit is the source of partial unfolding observed by ITC. Thus, singly-bound enzymatic states become a mixture of folded (H) and unfolded (uH) holo-like dimers (i.e. H-HP + uH-H + uH-HP + HP-H + H-uH + HP-uH). Through careful analysis of NMR and ITC data, Mittermaier designates thermodynamic parameters (K, ΔH, ΔCp) for each species in order to derive their energetic contributions to the observed experimental signals.
The simultaneous shift in subunit conformation upon paromomycin binding to dimeric AAC(6’)-Ii is consistent with the MWC model of allostery. This result directly contrasts the asynchronous conformational transition associated with AcCoA binding, reminiscent of KNF allostery.245 Furthermore, calorimetric data examining the binding of each ligand to AAC(6’)-Ii yields different thermodynamic parameters, most notably differences in the heat capacity change (ΔCp), which often reflects solvent reorganization during protein folding.248 A shift in allosteric behavior between paromomycin and AcCoA may be explained when considering their respective binding pockets within AAC(6’)-Ii, using the ribostamycin-derived bisubstrate inhibitor as a structural analogue (Figure 30C). The aminoglycoside portion of the inhibitor is very close to the dimer interface, directly adjacent to the β-sheets that compose the majority of the junction. The CoA site, however, resides ~ 10 Å away from the interface. Thus, the aminoglycoside (paromomycin) appears more ideally placed to affect both subunits of the AAC(6’)-Ii dimer.
Finally, Mittermaier and coworkers adapt their data to the EAM, establishing a thermodynamic relationship between the bound paromomycin ligand and the dimer interface. In their model, the subunits exist in the binding incompetent (apo, A) or binding competent (holo, H) states, and a shift between conformations is controlled by two thermodynamic parameters. The first, ΔGTrans, is the free energy difference between states A and H, and the second, ΔGInt, is the stabilization energy of the HH dimer interface relative to AH or AA dimers.246 The cooperativity of paromomycin binding relates to these free energies by α, written in Equation (28),
| (28) |
where and a value of α > 1 denotes positive cooperativity, while α < 1 indicates negative cooperativity.
The extent to which the dimers follow KNF or MWC allostery is evaluated based on the symmetry of the subunits in the 1-bound state, described by σ = [HHP]/[AHP] = KTransKInt, where P denotes the bound paromomycin ligand. The magnitudes of the energies stabilizing the dimer would shift the allosteric model between KNF and MWC.246 Moreover, the authors conclude that a change in the AAC(6’)-Ii interface energy of just 3.5 kcal/mol is required to transform the singly-bound state from symmetrical (> 95% HHP) to asymmetrical (AHP). In other words, 3.5 kcal/mol is sufficient to transform AAC(6’)-Ii from MWC to KNF, respectively. Further, the affinities of paromomycin and AcCoA for AAC(6’)-Ii differ by ~ 3.5 kcal/mol, suggesting that the symmetry switch is energetically plausible upon ligand binding.
Studies of the AAC(6’)-Ii transferase enzyme very elegantly highlight ligand-dependent switching between allosteric models. This work differs from previous nested models of allostery2,3,249 in that it treats AAC(6’)-Ii with a statistical thermodynamic approach, demonstrating that paromomycin binding creates a symmetry equilibrium between the dimers, where small changes in the interface energies govern the amount of MWC or KNF influence. Thus, the description of AAC(6’)-Ii is consistent with the EAM.
6. Glucokinase
6.1. Structure and Function
Glucokinase (GCK) catalyzes the phosphorylation of glucose to glucose-6-phosphate, the rate-determining step of glucose metabolism.250 As a result, GCK also controls insulin secretion from pancreatic β-cells,251,252 and over 600 loss-of-function mutations in the enzyme have been associated with diabetes (Figure 33).253 A smaller number of overly active GCK variants are tied to hyperinsulinemia, a condition characterized by increased blood-insulin concentrations.254 The important physiological functions of GCK are of great interest in pharmaceutical applications, particularly in connection with its role in these pathologies. For example, considerable effort has been focused on the development of synthetic allosteric activators for GCK stimulation and treatment of Type-II diabetes.255,256
Figure 33.

Structure of GCK (PDB 1V4S) displaying the distribution of representative GCK mutations in the small domain (cyan, blue circle) and large domain (red, red circle). The dynamic α13-helix is shown in orange, and mutation sites are shown as yellow spheres. Figure reprinted from Reference 257.
In the context of this review, GCK is also well-studied allosteric enzyme and one of the few examples of a system that exhibits allosteric behavior within a monomeric protein scaffold.258,259 A component of GCK regulation is governed by a process called kinetic cooperativity, which is characterized by a sigmoidal dose response to substrate. In this particular case, the enzyme is highly sensitive to perturbations in blood-glucose, and the midpoint of its steady-state response curve is within the physiologically relevant blood-glucose level (~ 5-10 mM).260 The response of GCK toward its glucose substrate has served as a key model system for the study of kinetic cooperativity in other proteins.261,262
The structure of monomeric GCK is subdivided into two domains; the large domain, which binds glucose and ATP, and a smaller domain reported to contain an allosteric effector site.263 The two domains are joined through a flexible hinge, which initiates a large-scale structural rearrangement of the enzyme upon glucose binding. Although GCK is monomeric, its ligand binding sites are spatially separated. X-ray crystal structures solved by Nagata and coworkers have shown a representative allosteric activator to bind at the interface of the small and large domains outside the hinge crevice near the α13-helix.263 In contrast, bound glucose is localized inside the active site cleft of the large domain, suggesting an extended communication pathway is still required for allosteric information transfer in GCK.261,264 Even with a wealth of structural information related to GCK transformations, the functional basis of allosteric activators, kinetic cooperativity, and the allosteric mechanism itself are not yet fully understood.
6.2. NMR Studies of GCK Allostery
In GCK, glucose is not a classic allosteric ligand, but its role in the kinetic cooperativity in GCK warrant discussion as a prelude to how distant pathogenic mutations in GCK alter its enzymatic function. Relationships between ligand-induced conformational dynamics and allostery in GCK have investigated by NMR in a series of recent reports.265-268 Brüschweiler, Miller, and coworkers employ 13C isotopic labeling of Ile and 15N labeling of Trp indole rings or backbone amides to examine dynamic behavior in GCK associated with substrate binding.269 Due to the monomeric nature of GCK, its study further provides a significant contrast to the other multimeric enzyme systems detailed in this review.
Complete isotopic labeling of backbone amide nitrogen atoms in the 52 kDa enzyme yields crowded, low intensity 1H-15N HSQC spectra, as described in 2010.266 The spectrum showed minimal improvements to its quality as a function of temperature or GCK concentration, and a battery of experiments designed to alleviate spectral overlap and broadening were fruitless, suggesting that apo GCK is substantially dynamic on a slower NMR timescale.266 Selective labeling of Ile (13Cδ1) or Trp (15Nε) greatly reduces spectral complexity, as GCK contains only 17 Ile and 3 Trp residues.83,269 This small population of amino acids is also very well dispersed among the two domains of GCK, with the large domain containing 1 Trp and 10 Ile, and the small domain containing 2 Trp and 7 Ile. These residues, especially the three tryptophans, experience significant environmental perturbations upon glucose binding in crystallographic studies.263 The 1H-15N HSQC spectrum of apo 15Nε-Trp-labeled GCK shown in Figure 34A displays a strong resonance near 10 ppm and an extremely weak second peak at 9.5 ppm. The two missing Trp resonances, both from the small domain, have been shown to be highly dynamic in solution, which broadens these peaks beyond detection.267 Mutagenesis studies previously identified the lone visible resonance as Trp167.267
Figure 34.
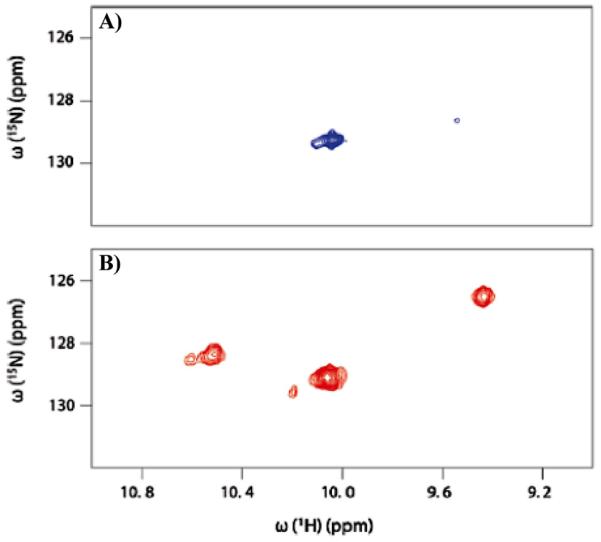
1H-15N HSQC NMR spectra of 15Nε tryptophan side chains in (A) apo GCK and (B) GCK in the presence of 50 mM glucose. Figure reprinted with permission from Reference 266. Copyright 2010 American Chemical Society.
Addition of saturating concentrations of glucose restores the three expected resonances and produces two weaker satellite peaks (Figure 34B), which the authors interpret as evidence that glucose binding stabilizes at least two distinct conformational states of GCK.266 The observation of residual peak intensity at 10.2 and 10.7 ppm (Figure 34B) when bound GCK is bound to glucose, suggests these conformations exist at low population and are sampled on a slower timescale, consistent with previous reports on the mechanism of GCK.270,271
Two current models describing GCK allostery rely on slow conformational exchange dynamics, but differ in the degrees of motional freedom allowed to the enzyme throughout the catalytic cycle.272,273 Crystal structures of apo, glucose-bound binary and catalytically active ternary GCK illustrate substrate-dependent opening and closing of the large and small domains via a flexible hinge, also suggesting conformational dynamics play an important role in establishing a catalytically competent enzyme (Figure 35).263 Glucose binding induces a large structural change in the apo enzyme, with subsequent ATP binding (or the ATP analogue AMP-PNP) causing minimal additional perturbations (Figure 35C). In a subsequent study by the same group, this dynamic mechanism is discussed, as are mechanistic effects of pathology-causing mutations. NMR experiments appear to support these crystallographic results (Figure 35D-F), but despite these efforts, no true consensus on the allosteric mechanism has been reached.263,266,274,275 To overcome this deficiency, solution NMR experiments were performed.
Figure 35.

Structural changes accompanying complex formation in (A) apo (PDB 1V4T), (B) glucose-bound binary (PDB 3IDH), and (C) glucose-AMP-PNP-bound ternary (PDB 3FGU) GCK. The large and small domains of GCK are colored grey and blue, respectively. Cα positions of Ile and Trp residues are shown as red and yellow spheres, respectively. The β-hairpin formed by residues 151-179 is shown as a magenta ribbon, glucose is depicted with green spheres, and AMP-PNP is depicted with orange spheres. Accompanying 1H-13C HMQC NMR spectra of 13Cδ1-labeled Ile residues for (D) apo, (E) glucose-bound binary, and (F) glucose-AMP-PNP-bound ternary GCK are below each structure. Labels for assigned Ile residues from the large domain are colored grey, Ile residues from the small domain are colored blue, and Ile residues from the 151-179 loop are colored magenta. Figure reprinted from Reference 267.
The 1H-13C HMQC spectrum detecting 13Cδ1-labeled Ile methyl groups of apo GCK is similar to that of the fully labeled enzyme in its degree of spectral overlap (Figure 35D). Interestingly, a comparison of the observed chemical shifts in the overlapped region to the average 13Cδ1-1Hδ1 Ile shift positions of all denatured or intrinsically disordered proteins deposited in the Biological Magnetic Resonance Data Bank (BMRB) show good correlation, suggesting the apo enzyme is significantly disordered and undergoing rapid motional averaging in solution. Formation of a binary complex with glucose alleviates spectral overlap and broadening, as five new Ile cross peaks become visible (Figure 35E). Residues associated with the loop region of the small domain (Ile159, Ile163) undergo large chemical shift changes consistent with formation of a stabilized β-hairpin shown crystallographically.263 Ile residues found in the large domain remain generally unaffected by glucose binding, indicating that conformational flexibility in the apo complex originates primarily from the small domain. Minimal changes in either domain are detectable during formation of the ternary complex, consistent with previous reports.
6.2.1. Examinations of Disease-Causing GCK Variants
To further investigate the allosteric mechanism in GCK a number of point mutations that have been linked to alterations in GCK function,276,277 most notably hyperactive variants of the enzyme associated with persistent hyperinsulinemic hypoglycemia of infancy (PHHI) were studied. NMR spectroscopy was utilized on a hyperactive GCK variant lacking the 23 residue C-terminal α-helix 13 (α13), a region that had been previously shown to regulate kinetic cooperativity.278 Thus, study of this mutant enzyme could aid in the overall description of allostery in GCK. The 1H-13C HMQC NMR spectrum of the apo α13 GCK variant is markedly different from that of apo WT GCK. Unlike WT GCK, NMR studies of this variant show resonances from both the large and small domains. In fact, the spectrum of apo α13 GCK most closely resembles those of glucose- or effector-bound WT GCK, suggesting that the small domain loop comprised of residues 151-179 has already formed an ordered β-hairpin. Other hyperactive GCK variants have also been shown to promote varying degrees of structural stabilization in the small domain prior to glucose binding.257,279,280 Comparisons between 1H-15N HSQC NMR spectra of the WT binary complex and apo α13 GCK also revealed identical 15Nε chemical shifts for loop residue Trp167, suggesting similar conformations while pointing to the C-terminal region as a major controller of apo enzyme motions.
The disordered loop in the small domain containing residues 151-179 becomes structured upon glucose binding or elimination of the regulatory α13-helix,278 and changes within this loop are proposed to initiate an allosteric communication pathway.267 A crystal structure containing the stabilized 151-179 β-hairpin and a bound activator molecule (N-thiazol-2-yl-2-amino-4-fluoro-5-(1-methylimidazol-2-y)thiobenzamide)263 highlights hydrophobic residues near the bottom of the activator site (Val452, Ala456) that are within 5 Å of loop residue Ile159 and interact strongly upon formation of the hairpin (Figure 36).
Figure 36.
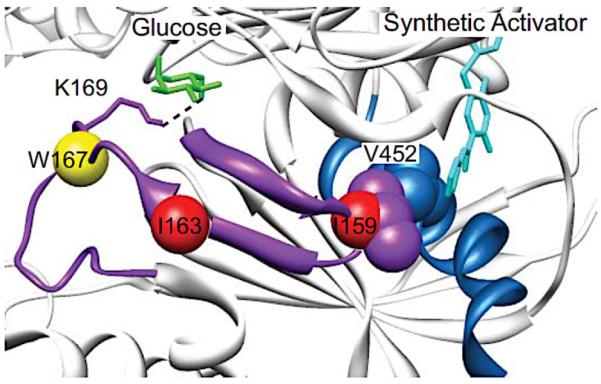
X-ray crystal structure of a GCK-glucose-activator ternary complex illustrating the allosteric communication relay in the enzyme. The 151-179 β-hairpin is shown in magenta, the α13-helix in blue, the allosteric activator molecule in cyan, and glucose in green. The Cα atoms of Ile159, Ile163 and Trp167 are shown as red (Ile) and yellow (Trp) spheres and V452 is shown as blue spheres. Magenta sticks show Lys169, which hydrogen bonds to the O6 atom of glucose. Figure reprinted from Reference 267.
Stabilization is likely relayed to the glucose binding site through Thr168 and Lys169, which hydrogen bond with oxygen atoms of the glucose substrate. NMR data indicative of a glucose-driven disorder-to-order loop transition in the apo WT enzyme and a stabilized hairpin structure in the apo α13 variant are consistent with this mode of allosteric communication between the activator, α13 helix, and 151-179 loop, pointing to a preformed 151-179 hairpin as the origin of hyperactivity. The α13-helix acts to stabilize the apo-like structure while depopulating the conformation that resembles glucose bound GCK. This conformational change is essential for the observed kinetic cooperativity. Likewise, removal of the α13 region facilitates GCK conversion to the substrate-competent conformation and eliminates the kinetic cooperativity in glucose phosphorylation.
The α13 variant and activator-bound WT GCK promote a major structural reorganization of the small domain, including the transition of its disordered active site loop into a β-hairpin. The affinity of apo WT GCK for glucose (~ 5 mM) compared to those of the α13 variant or activator-bound enzymes (50 μM) reveals a substantial energetic barrier associated with the glucose-induced conformational change of the small domain. Brüschweiler, Miller and coworkers speculate that redistribution of this unused binding energy and conformational entropy in more structured GCK variants might also facilitate enhanced catalytic rates.267
X-ray crystal structures have revealed the large conformational change required for GCK activity through snapshots of different ligation states (Figure 35). However, these images are limited in their information content about solution equilibrium ensembles or the timescales of conformational motions. Recently, Miller and Brüschweiler investigated the timescale of small domain motions in glucokinase using CPMG relaxation dispersion NMR experiments.268 Several 13CHD2δ1-Ile methyl groups within apo GCK undergo conformational exchange with a rate of kex = 509 ± 51 s−1, and these motions are quenched in the presence of glucose (Figure 37) suggesting glucose binding preferentially stabilizes the active conformation.
Figure 37.
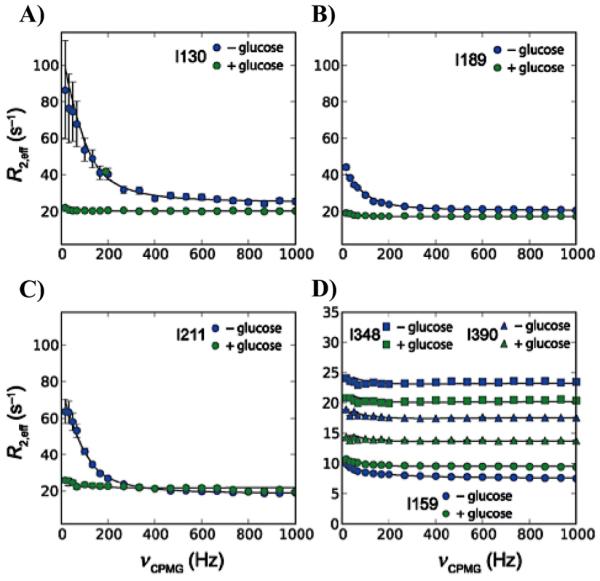
Representative CPMG relaxation dispersion curves following changes in 13CHD2δ1-Ile methyl group dynamics in the absence (blue) and presence (green) of glucose. Panels A-C show dispersion profiles for residues located in the small domain. Panel D shows profiles for I159 of the disordered loop (circles), I348 of the large domain (squares), and I390 of the hinge region (triangles). Data analysis was carried out as described in Ref. 281. Figure was reproduced from Reference 268 with permission from Wiley Publishing.
The results of CPMG dispersion experiments echo those of chemical shift perturbation titrations, with the largest amplitude (Rex) dispersion profiles found in small domain residues Ile126, Ile130 and Ile189. A global fit of these data gives the exchange rate constant kex = kAB + kBA = 509 ± 51 s−1.268 The α13 GCK variant, which does not display the cooperative behavior of WT GCK, is quenched of all millisecond motions in CPMG experiments, a result which solidifies the importance of intramolecular dynamics in the function of the WT enzyme.
The potential for further mutational studies in both domains of GCK present exciting possibilities for elucidating the complexity of its allosteric network. Additional mutation sites along the α13-helix and small domain may produce similar findings to those discussed here, however, several residues within the large domain (K39, E265, E290, R392) represent mutational targets that have a known physiological effect282 and are distant from the substrate and effector binding sites. NMR investigations of these potential large domain variants would be particularly important in determining how widely dispersed the allosteric network of GCK truly is, providing one of the first comparisons to a more traditional multimeric enzyme.
6.2.2. Mechanistic Insight
Brüschweiler and Miller have proposed a solution state model of GCK function based on their NMR investigations.266-268 In this model, the apo enzyme, containing a disordered small domain, exists as an ensemble of conformations exchanging on a timescale close to that of kcat (~ 220 s−1). Binary complex formation drives the largest conformational change of the small domain, along with closing of the entire structure at the hinge, with little additional reorganization accompanying ATP binding.283 Product release then generates a short-lived “ordered” apo enzyme that reverts to the resting state via an order-to-disorder transition on the millisecond timescale, facilitated by intramolecular motions. The sigmoidal glucose response curve of WT GCK necessitates a delay time in the return to a disordered apo state, supporting slower dynamic regulation.284 Kinetic cooperativity governed by slow conformational dynamics have also been observed elsewhere.285,286 Mutations at distant residues allosterically alter the disorderd apo state and thus the kinetic cooperativity and function of GCK.
The most current examinations of monomeric glucokinase by Brüschweiler, Miller, and coworkers support a mechanistic hypothesis in which glucose phosphorylation and release is regulated by conformational dynamics of loop closure in the small domain. The rate of millisecond conformational exchange within the small domain (425 s−1) is comparable to the rate of catalytic turnover (220 s−1) under physiological conditions, and the similarity of these rates is thought to produce the sigmoidal glucose dependence that regulates cooperativity in GCK.268
7. Protein Kinase A – Catalytic Domain
7.1. Structure and Function
The protein kinase superfamily regulates phosphorylation-induced signaling in eukaryotes. These enzymes catalyze the transfer of the γ-phosphate group of a nucleoside triphosphate (i.e. ATP) to a protein substrate via an amino acid hydroxyl group, such as those of Ser, Thr, or Tyr.287 The mechanisms (and dysfunctions) of numerous protein kinases have been, and continue to be, extensively studied for their roles in cancers and cardiovascular diseases.288,289
In one of the first studies of a protein kinase, Krebs and coworkers characterized protein kinase A (PKA),290 and although PKA has now been known for over 40 years, the allosteric mechanism of the enzyme remains under study. In its native state, PKA contains two catalytic (C) and two regulatory (R) subunits, and a conformational change initiated by the effector nucleotide 3’,5’-cyclic adenosine monophosphate (cAMP) results in the release of functional catalytic subunits to phosphorylate protein targets.291 Since the catalytic subunits are active independent of the regulatory domain, a majority of current PKA studies are carried out exclusively on the catalytic domain, known henceforth as PKA-C.
The catalytic subunit of PKA contains a small lobe comprised of β-sheets and a dominantly α-helical large lobe. The nucleotide effector binds in the small lobe, docking near the Gly-positioning loop in the crevice created by the protein hinge. The large lobe houses substrate and regulatory subunit docking sites, primarily located at the bottom portion of the crevice adjacent to the peptide-positioning loop (Figure 38). Several small loops involved in substrate positioning and phosphorylation are arranged near the active site cleft between the two lobes. Pioneering structural studies by Taylor and coworkers provided snapshots of the major conformational states associated with PKA-C allostery using nucleotide analogues, pseudosubstrates, and inhibitors.291-293 Based on these data, Taylor et al revealed a hinge-like conformational change associated with substrate and nucleotide binding (Figure 38), and proposed an extensive allosteric network involved in substrate recognition and conversion.294
Figure 38.

Conformational changes associated with ligand binding in PKA-C. Major conformational states defined by the angle between the large and small lobes of the catalytic subunit, and the reported angles were calculated as an average of those given by X-ray crystal structures of open (PDB 3O7L, 1CMK, 1CTP, 1J3H, 2QVS), intermediate (PDB 1BKX, 1BX6, 1STC, 1JLU, 1RE8, 1REK, 3DND, 3DNE, 3IDB, 3IDC), and closed (PDB 1JBP, 1ATP, 1APM, 1YDS, 1YDR, 1YDT) PKA-C. Figure reprinted from Reference 295 with permission from Elsevier.
The major driving force of PKA-C allostery appears rely, in part on its intrinsic flexibility, as significant conformational changes in PKA-C are observed locally and globally upon nucleotide effector binding, and it has been hypothesized that propagation of the allosteric signal occurs via the hydrophobic core connecting the large and small lobes of PKA-C.294 Since this initial proposal, numerous investigations into PKA-C allostery have surfaced.296-301 The role of protein motions in PKA-C allostery have been investigated in detail by Veglia and coworkers.
7.2. Dynamics and Allostery in PKA-C
Crystallographic snapshots have provided motivation to study the conformational fluctuations associated with PKA-C allostery in solution. Building on crystallographic results, Veglia et al report a series of NMR examinations of PKA-C and provide tremendous insight into the short- and long-range conformational changes associated with PKA-C allostery. Changes in the structure of the PKA-C amide backbone are traced through titrations of the enzyme with ATPγN or the nucleotide analogue 5’-andenylylimido-diphosphate (AMP-PNP) and a standard kinase peptide substrate (‘Kemptide’ Leu-Arg-Arg-Ala-Ser-Leu-Gly). Local and long-range chemical shift perturbations are seen in PKA-C, occurring as far as 20 Å away from the nucleotide binding site in the small lobe termini and peptide positioning loop of the large lobe (Figure 39).295
Figure 39.

Chemical shift perturbations (Δδ) upon binding of (A) AMP-PNP and (B) Kemptide (Leu-Arg-Arg-Ala-Ser-Leu-Gly) to PKA-C. Figure reprinted from Reference 295 with permission from Elsevier.
Furthermore, the presence of nucleotides causes conformational exchange broadening of many of the highly conserved residues within the Gly-rich and DFG loops, which are in close proximity to the active site (Figure 40).302 Other residues in the more distant peptide positioning and activation loops, as well as their flanking α-helices, are also broadened. Interestingly, mutation of key hydrogen-bonding residues near the interface (i.e. within the peptide positioning loop) of the large and small lobes eliminates long-range chemical shift changes, suggesting a disruption of the allosteric network (see Section 7.2.2.).
Figure 40.

Summary of nucleotide-induced exchange broadening in apo PKA-C. Red dashed circles indicate the disappearance of assigned resonances. Figure reprinted from Reference 302 with permission from Elsevier.
Transitions from a nucleotide-bound binary form to ternary complexes with model peptides (Kemptide), physiological substrate peptides (phospholamban, PLN1-20), or inhibitor peptides (protein kinase inhibitor, PKI5-24) show less substantial chemical shift perturbations in all cases, consistent with the greater similarity of the intermediate and closed structures determined by X-ray crystallography (Figure 38).295 These shifts, although small, track well with changes in the Cα atoms observed in X-ray structures. Shifts in numerous resonances follow a linear progression from the apo enzyme to ternary complexes (Figure 41), suggestive of a preexisting conformational ensemble that is modulated in the presence of ligand or inhibitor.
Figure 41.

Linear changes in chemical shift among different forms of PKA-C. As described in Ref. 295, the extremes of shifts are apo (orange) and super-inhibited ternary complex (red), with changes in representative residues dispersed throughout the enzyme in regions near the active and allosteric sites. Figure reprinted from Reference 295 with permission from Elsevier.
Building on their titration results, Veglia and coworkers also investigate the role of fast (ps-ns) and slow (μs-ms) conformational dynamics in PKA-C function (we will focus on μs-ms dynamics for simplicity, although the trends are echoed in the faster time regime).75,295 Using 15N CPMG relaxation dispersion experiments, the contribution of conformational exchange to the backbone relaxation was measured for the apo, AMP-PNP-bound binary, and AMP-PNP/PLN1-20-bound ternary complexes of PKA-C. The apo enzyme shows surprisingly few motions on the μs-ms timescale (Figure 42), with small Rex values measured throughout the backbone. Any motions in the Gly-rich, peptide positioning, and activation loops likely take place in a faster time regime.75 This lack of μs – ms motions, especially in the small lobe, contrasts the crystal structure accompanying this study, which shows several disordered structural elements in that region.75
Figure 42.

Amide backbone dynamics determined by CPMG relaxation dispersion for (A) apo (B) AMP-PNP binary and (C) AMP-PNP/PLN1-20 ternary PKA-C. Figure reprinted from Reference 75 with permission from Macmillan Publishing.
Saturation of the apo enzyme with nucleotide stimulates widespread millisecond dynamics, including at the effector site and the Gly-rich loop, which is directly involved in nucleotide binding. Millisecond motions also occur near the activation loop in the central cleft. Most notably, high amplitude Rex values are seen in the C-helix of the small lobe, which the authors hypothesize is evidence for its recruitment to the active site,75 a motion thought to be critical for activation of the enzyme.303 Extension of this dynamic behavior to regions far from the nucleotide site may be essential for positioning the small lobe for catalysis, although this hypothesis requires further study.291 The ternary complex remains highly dynamic, though motions are redistributed throughout the backbone. Several regions undergoing μs-ms motions in the binary complex (i.e. the C-helix) are quenched in the ternary complex, as new dynamic regions appear. Interestingly, an increase in fast (ps-ns) backbone motions in the ternary complex is concurrent in regions of decreased μs-ms motions, suggesting a change in the dynamic timescale rather than complete motional quenching. The small lobe of PKA-C retains most of its dynamic behavior on the slower timescale, with increases in the amplitudes of Rex throughout the domain, which is perhaps reflective of its intimate involvement in catalysis and the general necessity of flexibility in the function of PKA-C.75
In order to draw correlations between interspersed regions of μs-ms motion, Veglia and coworkers plotted the exchange rate constant, Rex, against the square of the population chemical shift difference, Δω2. If the same conformational exchange process affects a set of nuclear spins, a plot of this type will show a linear correlation indicative of synchronous motion in which all residues exhibit the same exchange rate constant (kex) (Figure 43). Measured Rex values for residues around the active site cleft, including the Gly-rich and activation loops, show a linear dependence against the chemical shift difference of the two enzyme conformations, presumably the open (apo-like) and closed (binary/ternary) states. This dependence is observed in the binary and ternary enzymatic complexes. Global, concerted dynamics appear to proceed through contiguous pathways of residues within van der Waal’s contact distances, spanning the distance from the peptide-positioning loop (substrate site) to the Gly-rich loop (effector site). Remote dynamic regions of the enzyme have no connective pathways and demonstrate asynchronous motions, illustrating the complexity of the allosteric network.75
Figure 43.

Synchronous opening/closing of the enzyme active site cleft. Correlation plots of Rex with the chemical shift differences of the open and closed enzyme states for (A) AMP-PNP binary and (B) AMP-PNP/PLN1-20 ternary PKA-C. (C) Contiguous and noncontiguous pathways involved in opening and closing of the enzyme stemming from the active site cleft (orange surface). (D) Residues that show no linear correlation in (A,B, shown as red points) with respect to opening/closing interact directly with the regulatory subunit of PKA, shown in the crystal structure (red surface, PDB 2QCS). Figure reproduced from Reference 75 with permission from Macmillan Publishing.
Based on the results of HX-NOE (fast) and CPMG (slow) NMR dynamics experiments, Veglia and coworkers present a free energy landscape describing conformational fluctuations in PKA-C (Figure 44), where ligand binding alters the conformational ensemble of the apo enzyme and shifts the equilibrium of the open and closed states. The apo enzyme contains residues with distinct kinetics on both timescales, and is classified as ‘dynamically uncommitted,’ while binary and ternary PKA-C become ‘dynamically committed’ and active due to μs – ms motions, which now occur with the same timescale as catalytic turnover. The free energy model is extended to inhibited PKA-C complexes, where motions are quenched or greatly attenuated (NMR data not shown) and the free energy is low. Under this model, allostery in PKA-C is reminiscent of the EAM.16
Figure 44.

Free energy landscape of ligand-induced PKA-C conformational fluctuations on fast (ps-ns, blue structures) and slow (μs-ms, green structures) timescales. Conformational exchange motions are presumed to be related to the opening and closing of the active site cleft, which is quenched in the presence of inhibitors (i.e. PKI5-24). Figure reproduce from Reference 295 with permission from Elsevier.
7.2.1. Post-Translational Modification
Veglia and Taylor recently communicated three additional investigations of PKA-C allostery, the first of which examines the effects of post-translational modifications on the conformational equilibrium of the enzyme using a combination of X-ray crystallography, NMR and MD simulations.301,304 PKA-C is known to undergo several post-translational modifications,291 specifically at its N-terminus. Modifications such as myristoylation and S10 phosphorylation are thought to help regulate the enzyme by modulating target-binding interactions.305 For example, myristoylation has been reported to increase the membrane affinity of PKA-C,306 essentially tuning the enzyme for membrane-bound substrates. Further, Veglia has shown by NMR that myristoylation, as well as membrane insertion, induce allosteric effects on PKA-C, and chemical shift perturbations demonstrate a fast equilibrium between two myristoylated conformational states.301 In the first state, called myr-in, the acyl group of the N-terminal myristoyl tail is buried in the core of the enzyme, and in the second, called myr-out, an extruded myristoyl tail is found.301 Further, exchange between myr-in and myr-out PKA-C involves two additional minor states, reflecting the folded or unfolded modified N-terminal helix, denoted helix-turn-helix (HTH, folded) or long loop (LL, unfolded), respectively.301,304
NMR experiments probing conformational dynamics of PKA-C show that N-terminal motions are quenched upon myristoylation.301 However, simple chemical shift perturbations demonstrate the persistence of long-range allosteric communication between the N-terminal myristoylation site and the nucleotide-binding pocket through a network of residues.301 In a second report on PKA-C myristoylation, MD simulations were used to corroborate the NMR results, mapping the short- and long-range allosteric effects propagating from the N-terminus (Figure 45).304 Most notably, the state of the N-terminal helix of PKA-C (HTH, folded or LL, unfolded) produces a substantial allosteric effect propagating from the N-terminus to distal regions in PKA, which is not observed in either N-myristoylated or S10-phosphorylated PKA-C, highlighting the widely dispersed nature of the allosteric network.
Figure 45.

Allosteric interaction networks determined by MD simulations for various conformational states of PKA-C. (A) Effect of myristoylation comparing myr(+) and myr(−) simulations. (B) Effect of the LL → HTH conformational change comparing myr(+)-LL and myr(+)-HTH simulations. (C) Effect of S10 phosphorylation by comparing myr(+)phos(+)-HTH and myr(+)phos(−)-HTH simulations. Differences between each simulated conformational state are mapped onto the PKA-C structure (see ‘Key’ at the bottom), and the combined perturbation of all algorithms, reflective of the allosteric network, is depicted as a gold surface. Details of the simulation models and perturbation determinants can be found in the Materials and Methods section of Ref. 304. Figure reproduced from Reference 304 with permission. Copyright 2012 American Chemical Society.
7.2.2. Y204A Mutant PKA-C
The collaborative efforts of Veglia and Taylor, among others, have presented a prominent role for flexible residues in the propagation of allosteric signal in PKA-C. Numerous mutagenesis studies aimed at disrupting this allosteric network have encouraged and strengthened this hypothesis, and much of the evidence preceding Veglia’s initial NMR studies was inferred from mutational analysis.307-310 Kinetic experiments on a variety of point mutants suggest the conformational transition from the closed to open state is rate limiting,311 and one of the most well-studied mutants, Tyr204Ala, has been shown to alter both kcat and kcat/Km,308,309 even though the X-ray crystal structures of nucleotide and inhibitor bound Tyr204Ala are essentially identical to those of the WT enzyme.312 In their most recent collaboration,302 Veglia, Taylor, and coworkers explore the propagation of dynamics and allosteric signal in Tyr204Ala PKA-C for comparison to their extensive studies on the WT enzyme. Tyr204 is a component of the electrostatic network of charged residues at the interface of the large and small lobes, and is involved in activation by coupling the P+1 loop to the hydrophobic core of the enzyme.302
Mutation of Tyr204 has little effect on the chemical shifts, with changes arising only near the mutation site. Fast timescale dynamics are also similar to those of the WT enzyme in the apo and nucleotide-bound states,302 but are greatly quenched by the addition of a substrate analogue. Any remaining fast dynamics in the ternary complex are redistributed throughout Tyr204Ala PKA-C. These data are consistent with ITC experiments that show similar affinities for nucleotide between the two enzymes, but nearly a 100-fold decrease in affinity for substrate in Tyr204Ala.302 Veglia and Taylor hypothesize that any gains in conformational freedom resulting from disruption of the Tyr204 electrostatic cluster are redistributed to distant sites within PKA-C, and may contribute to this reduced substrate affinity.
More significantly, slower conformational dynamics are markedly different for Tyr204Ala PKA-C when compared to those of WT. 15N CPMG relaxation dispersion experiments on WT PKA-C detect 15 residues across the enzyme with similar conformational exchange rates, which are referred to as synchronous by the authors, and a global fit of these data gives a value of kex = 1020 ± 150 s−1 (Figure 46).302 The synchronous motion inferred from these data involves residues from the Gly-rich and catalytic loops, several small lobe β-sheets, and the flexible hinge between the lobes. The measured kex values for these clustered residues were found to diverge in Tyr204Ala PKA-C, suggesting a loss of synchronous motion. Motions in several small lobe residues show faster, uncorrelated motions, while others appear to be quenched (Figure 46), suggesting a change in motional time regime.
Figure 46.

Slow timescale conformational motions in PKA-C measured by CPMG relaxation dispersion. Residues involved in the concerted motional network are mapped onto the structure of WT PKA-C, while dispersion curves of WT and Y204A PKA-C reveal a mutation-induced change in the nature of the dynamics. Figure reproduced from Reference 302 with permission from Elsevier.
Thus, concerted μs – ms motions within PKA-C appear to be required for proper substrate interactions. However, disruption of dynamics in the flexible hinge region and Gly-rich loop maybe be most critical, as they are key components of the PKA-C allosteric network. A community network analysis carried out with the aid of molecular dynamics simulations reinforces a shift in correlated motions, evidenced by a dramatic rearrangement of the dynamic communities in Y204A PKA-C.302
The studies presented thus far highlight the power of NMR spectroscopy in the characterization of enzyme allostery, while demonstrating the remaining complexity of long-range allosteric signal propagation in enzyme systems. Nonetheless the NMR structural and dynamical data are consistent with existing allosteric models, models that were originally designed to explain cooperative O2 binding in Hb. Therefore, we conclude by re-examination of Hb and the role that solution NMR has played in advancing knowledge of the classic allosteric protein.
8. Revisiting the Structure of Hemoglobin
Present studies of enzyme allostery are built upon concepts originally developed to describe the cooperative binding of O2 to Hb. The NMR studies described in this Review utilize ideas of R- and T-states or states of high (low) affinity or catalytic activity. Below, recent NMR studies that have further enlightened the allosteric mechanism of Hb are examined in more detail.
The cooperative oxygenation of hemoglobin is perhaps the most well known example of allosteric regulation in biology. Pioneering structural studies by Perutz and coworkers more than 50 years ago helped elucidate the cooperative binding mechanism of Hb, which ultimately led to the description of T- and R-states as a way to view the conformational rearrangements in Hb. However, a recent crystal structure, called “R2” hemoglobin, displays clear differences from the classical R-state structure.313-315 Even though the two structures contain identical helical and β-sheet elements, they differ in their relative position and orientation (Figure 47).313,316
Figure 47.
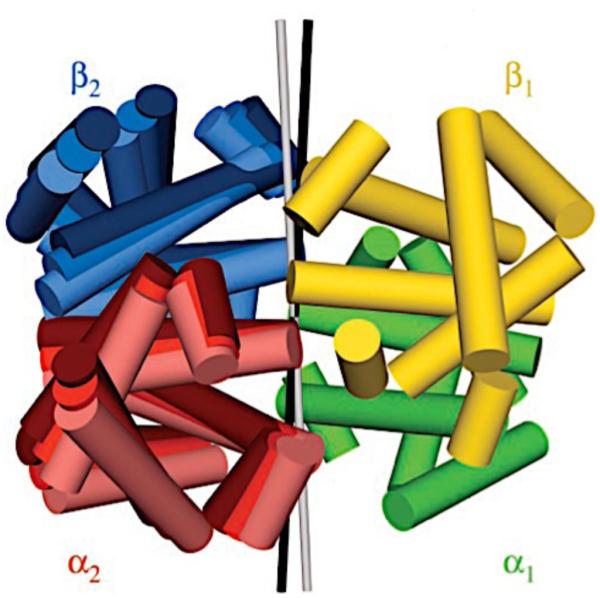
Cartoon representation of the R and R2 crystal structures of Hb A illustrating the difference in orientation of the α2β2 dimeric subunit when the α1β1 dimer is superimposed. Also included in the overlay is the solution structure of Hb A complexed with CO. The α2β2 dimeric units of the R, solution HbCo, and R2 structures are colored in dark, medium and light shades of red and blue, respectively. The C2 symmetry axes of the R and R2 structures are shown as black and white rods, respectively. Figure reproduced from Reference 316 with permission from PNAS. Copyright (2003) National Academy of Sciences.
Interestingly, the root mean square deviation (rmsd) between the Cα atoms of the two R-state structures are of similar magnitude to those between T- and R-Hb, with R2 reported as the most divergent from T. In their report of the R2-Hb structure, the authors speculate that R-Hb may actually be an intermediate species along the transition pathway to R2.313
Building on the hypothesis of Arnone and coworkers, the equilibrium distribution of R- and R2-Hb was examined with solution NMR by Bax, Ho, and coworkers with the goal of identifying the preferred quaternary structure of the tetramer in solution.316 Throughout this study, Hb was complexed with carbon monoxide (CO), which locks the protein into the R conformer and is more stable than the O2-bound form. Residual dipolar coupling NMR experiments were used to probe the bond vector orientation of the Hb subunits as a measure of quaternary structure in the presence of different aligning media (Figure 48).153,316,317
Figure 48.
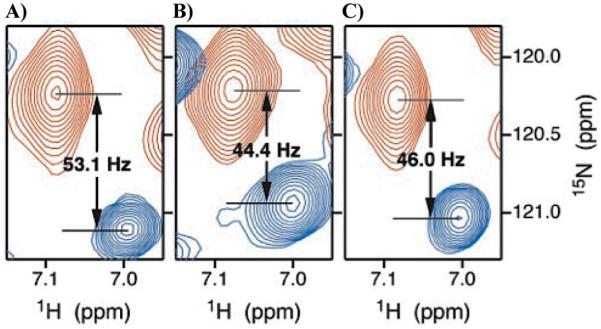
TROSY (blue) and HSQC (red) NMR spectra of the 15N labeled β-chain of Hb-CO showing cross peaks of βLys65 in (A) bicelle, (B) Pf1 phage, and (C) isotropic media. As described in Ref. 316, the separation between TROSY and HSQC resonances in (A) and (B) is given by [(1JNH + 1DNH)/2] and the RDC (1DNH) is extracted from differences in splitting between crystalline and isotropic media in which the TROSY vs. HSQC difference is 0.5 × 1JNH. Figure reproduced from Reference 316 with permission from PNAS. Copyright (2003) National Academy of Sciences.
Mapping the RDC results onto the α and β subunits of the original R hemoglobin tetramer showed poor agreement,7 and only marginal improvements were achieved with more recent high resolution R-state structures. Further, fitting the RDCs to the α1β1 dimer PDB coordinates of R-Hb superimpose directly onto the R2 coordinates, but fits to a full tetramer of either R or R2 are poor, suggesting the solution quaternary structure is an equilibrium distribution of the two. A stepwise reorientation of the α2β2 dimer to the C2 symmetry axis of the more static α1β1 dimer (Figure 47) followed by sequential fitting of the RDCs to each full tetramer improves the agreement. Reduced χ2 analysis of the RDC fits produced a minimum value (best fit) corresponding to a structure that is approximately halfway between the R and R2 tetramers when plotted against the fraction of R/R2, thereby supporting a time-averaged structure containing a mixture of the two.316
Despite the significant insight gained from RDCs about the “dynamic” nature of the Hb structure, there are limitations to this type of analysis. The authors point out that small conformational rearrangements (i.e. subtle reorientations of Hb dimers) are indistinguishable as a static intermediate or dynamic average structure. However, this ambiguity can be clarified with the aid of backbone relaxation (dispersion) measurements to probe dynamics in the time regime of conformational exchange. In their study of the Hb tetramer, Bax, Ho and coworkers reported 15N amide relaxation profiles indicative of increased conformational motions at the interfaces of the dimers, complementing and supporting their RDC analysis and hypothesis of a dynamic equilibrium between R2- and R-Hb.316
In a follow-up study, Ho and coworkers describe a Model-free analysis318,319 of Hb backbone dynamics as an additional step in correlating solution- and crystalline-state structural information to Hb function.320 Using the generalized order parameter S2 as a measure of structural flexibility (rigidity), Ho et al were able to quantify the amplitudes of ps-ns bond vector motions in deoxy- and CO-Hb. Both forms of Hb were found to have a similar distribution of backbone flexibility concentrated in the loop regions joining pairs of α-helices (see Figure 1 in Ref. 320), although several amino acids showed changes in their S2 values following the T-to-R transition, suggesting an involvement in Hb allostery.
Two residues at the intradimer interfaces (i.e. α1β1 or α2β2), αArg31 and βThr123, show substantial increases in S2 following CO binding, indicating a more rigid N-H bond vector. One additional residue, βGly69, also becomes more rigid in the R-state. The highly perturbed αArg31 exists in the “subunit packing” region of the Hb structure and stabilizes an extensive interaction network via hydrogen bonds to neighboring β-subunit residues.321,322 Interestingly, X-ray crystal structures of both T- and R-Hb suggest rigidity at these interfaces, but solution NMR experiments indicate that αArg31, the apparent lynchpin of intradimer stability, is in Ho’s own words “loose” in the T-state and “tightened” during the T-to-R transition.320 Values of Rex from the Model-free analysis also demonstrate slow timescale motions within numerous residues at the intradimer interfaces in deoxy- and CO-bound Hb, which are regions that appear rigidly packed in crystal structures of Hb.
In contrast, βLeu3, βPhe41, and most notably βHis146 all become more mobile in the carbonmonoxy form of Hb (decreased S2). Like αArg31, βHis146 is a crucial residue involved in structural stability (in the T-state), namely through a salt bridge with αLys40 and a hydrogen bond with βAsp49.323 A decrease in S2 of βHis146 is hypothesized to result from its location at the interdimer interface (i.e. α1β2), where dimer rotation during the T-to-R transition disrupts both salt bridging and hydrogen bonding interactions, increasing structural flexibility.320
Even 50 years after the first structures of hemoglobin were reported;7 it remains the classical example of biomolecular cooperativity and allostery. However, as technologies for the investigation of biomolecules evolve, so too does our understanding, and recent reports on the solution structure of hemoglobin demonstrate this point well. Crystallographically, two unique “R-state” structures have been solved,7,313 each of which is energetically favored under its crystallization conditions. Interestingly, NMR experiments have shown both structures to be accessible in solution, suggesting a small energetic barrier for conversion. These results not only reopen the discussion on the nature of conformational transformations in the hemoglobin tetramer, but also demonstrate the complementarity of X-ray crystallography and NMR spectroscopy in elucidating allosteric mechanisms.
9. Concluding Remarks
Allostery has been intensely studied since it was originally described as a mechanism by which protein function and enzyme activity can be modulated through ligand binding at a distant site. Early studies of allosteric enzymes focused on descriptive structural models to explain ligand-binding data. As experimental techniques gained resolution, additional mechanistic insight into allostery became possible. Advances in experimental NMR methods over the past two decades have provided unprecedented knowledge about the workings of allostery. However, it should be clear from review of these six examples that no single mechanism or model is currently capable of describing their allosteric behavior. Some enzymes utilize significant conformational rearrangements when bound to allosteric ligands while others have conformational changes that are barely detectable and operate by increasing molecular motions within an ensemble. Moreover, examples have been presented in which the allosteric model and pathway appear to switch depending on the bound ligand. As described in this review, the insight gained from NMR can be exceptionally fruitful when combined with other experimental techniques. Modern computational methods, though not described here, are providing another novel perspective on enzyme allostery. Thus, while much remains to be learned, powerful experimental and computational tools are available to tackle this exciting biological phenomenon.
Acknowledgements
JPL acknowledges funding from NIH GM106121.
Abbreviations
- Hb
hemoglobin
- T
tense enzymatic state
- R
relaxed enzymatic state
- MWC
Monod-Wyman-Changeux allostery
- KNF
Koshland-Nemethy-Filmer allostery
- EAM
Ensemble Allosteric Model
- G
Gibbs free energy
- CR
coupling response
- NMR
nuclear magnetic resonance
- MD
molecular dynamics
- NOE
nuclear Overhauser effect
- CAP
catabolite activator protein
- cAMP
cyclic adenosine monophosphate
- PRE
paramagnetic relaxation enhancement
- TROSY
transverse relaxation optimized spectroscopy
- ILV
Isoleucine, Leucine, Valine 13C-methyl labeling
- CPMG
Carr-Purcell-Meiboom-Gill pulse sequence
- RF
radio-frequency
- HMQC
heteronuclear multiple-quantum coherence
- SQ
single-quantum
- MQ
multiple-quantum
- RDC
residual dipolar coupling
- ATCase
aspartate transcarbamoylase
- CA
N-carbamoyl L-aspartate
- CP
carbamoyl phosphate
- PALA
N-(phosphonoacetyl)-L-aspartate
- DSC
differential scanning calorimetry
- Tm
unfolding transition midpoint
- H
enthalpy
- CD
circular dichroism
- SAXS
small-angle X-ray scattering
- PAM
phosphonoacetamide
- IGPS
imidazole glycerol phosphate synthase
- PRFAR
N’-((5’-phosphoribulosyl)formimino)-5-aminoimidazole-4-carboxamide-ribonucleotide
- AICAR
5-aminoimidazole-4-carboxamide ribotide
- IGP
imidazole glycerol phosphate
- HSQC
heteronuclear single-quantum coherence
- ITC
isothermal titration calorimetry
- S
entropy
- PGVG
Proline-Glycine-Valine-Glycine loop of HisH
- AAC(6’)-Ii
aminoglycoside N-(6’)-acetyltransferase Ii
- AcCoA
acetyl coenzyme A
- AcRibo
N-acetyl ribostamycin
- Cp
heat capacity
- GCK
glucokinase
- BMRB
Biological Magnetic Resonance Data Bank
- PHHI
persistent hyperinsulinemic hypoglycemia of infancy
- cAMP
3’,5’-cyclic adenosine monophosphate
- PKA-C
catalytic subunit of protein kinase A
- AMP-PNP
5’-andenylylimido-diphosphate
- PLN1-20
phospholamban
- rmsd
root-mean-square deviation
Biographies

George P. Lisi was raised in Stratford, CT, and received his B.Sc. in Chemistry from nearby Fairfield University in 2009. He then moved to Hanover, NH, where he began graduate studies in bioinorganic and biophysical chemistry at Dartmouth College. He received his Ph.D. in 2014 under the direction of Professors Dean E. Wilcox and Ekaterina Pletneva. He is currently conducting postdoctoral work in the laboratory of Professor Patrick Loria at Yale University, where his research uses solution NMR to examine the role of conformational dynamics in allosteric enzymes.

J. Patrick Loria grew up in Fairmont, WV, and received his B.Sc. in Chemistry from The George Washington University in 1990. He received his Ph.D. in Biochemistry from the University of Notre Dame under the direction of Thomas Nowak, studying the enzymological and allosteric properties of yeast pyruvate kinase. In 1997, he trained in solution NMR techniques as an NIH Postdoctoral Fellow with Professor Arthur G. Palmer at Columbia University. Since 2001, he has been on the faculty at Yale University in the Department of Chemistry. His research interests are focused on understanding conformational fluctuations in the function of enzymes.
Footnotes
We use italic h and f to refer to individual amino acids in the HisH and HisF subunits respectively.
Notes
The authors declare no competing financial interest
References
- (1).Tsai C-J, Nussinov R. A Unified View of "How Allosery Works". PLOS Comp. Biol. 2014;10:1–12. doi: 10.1371/journal.pcbi.1003394. [DOI] [PMC free article] [PubMed] [Google Scholar]
- (2).Monod J, Wyman J, Changeux J-P. On the nature of allosteric transitions: A plausible model. J. Mol. Biol. 1965;12:88–118. doi: 10.1016/s0022-2836(65)80285-6. [DOI] [PubMed] [Google Scholar]
- (3).Koshland DE, Jr., Nemethy G, Filmer D. Comparison of Experimental Binding Data and Theoretical Models in Proteins Containing Subunits. Biochemistry. 1966;5:365–368. doi: 10.1021/bi00865a047. [DOI] [PubMed] [Google Scholar]
- (4).Demerdash ONA, Daily MD, Mitchell JC. Structure-Based Predictive Models of Allosteric Hot Spots. PLoS Comput. Biol. 2009;5:e1000531–e1000555. doi: 10.1371/journal.pcbi.1000531. [DOI] [PMC free article] [PubMed] [Google Scholar]
- (5).Weinkam P, Pons J, Sali A. A Structure-Based Model of Allostery Predicts Coupling Between Distant Sites. Proc. Natl. Acad. Sci. USA. 2012;109:4875–4880. doi: 10.1073/pnas.1116274109. [DOI] [PMC free article] [PubMed] [Google Scholar]
- (6).Motlagh HN, Wrabl JO, Li J, Hilser VJ. The Ensemble Nature of Allostery. Nature. 2014;508:331–339. doi: 10.1038/nature13001. [DOI] [PMC free article] [PubMed] [Google Scholar]
- (7).Perutz MF, Rossman MG, Cullis AF, Muirhead H, Will G, North AC. Structure of Haemoglobin: A Three-Dimensional Fourier Synthesis at 5.5 A Resolution, Obtained by X-ray Analysis. Nature. 1960;185:416–422. doi: 10.1038/185416a0. [DOI] [PubMed] [Google Scholar]
- (8).Perutz MF, Bolton W, Diamond R, Muirhead H, Watson HC. Structure of Haemoglobin. An X-Ray Examination of Reduced Horse Haemoglobin. Nature. 1964;203:687–690. doi: 10.1038/203687a0. [DOI] [PubMed] [Google Scholar]
- (9).Perutz MF. Stereochemistry of Cooperative Effects in Haemoglobin. Nature. 1970;228:726–739. doi: 10.1038/228726a0. [DOI] [PubMed] [Google Scholar]
- (10).Monod J, Jacob F. Teleonomic Mechanisms in Cellular Metabolism, Growth, and Differntiation. Cold Spring Harb. Symp. Quant. Biol. 1961;26:389–401. doi: 10.1101/sqb.1961.026.01.048. [DOI] [PubMed] [Google Scholar]
- (11).Changeux J-P. 50th Anniversary of the Word “Allosteric". Protein Sci. 2011;20:1119–1124. doi: 10.1002/pro.658. [DOI] [PMC free article] [PubMed] [Google Scholar]
- (12).Yu EW, Koshland DEJ. Propagating Conformational Changes Over Long (and Short) Distances in Proteins. Proc. Natl. Acad. Sci. USA. 2001;98:9517–9520. doi: 10.1073/pnas.161239298. [DOI] [PMC free article] [PubMed] [Google Scholar]
- (13).Yifrach O, MacKinnon R. Energetics of Pore Opening in a Voltage-Gated K+ Channel. Cell. 2002;111:231–239. doi: 10.1016/s0092-8674(02)01013-9. [DOI] [PubMed] [Google Scholar]
- (14).Purohit P, Mitra A, Auerbach A. A Stepwise Mechanism for Acetylcholine Receptor Channel Gating. Nature. 2007;446:30–33. doi: 10.1038/nature05721. [DOI] [PubMed] [Google Scholar]
- (15).Whitley MJ, Lee AL. Frameworks for Understanding Long-Range Intra-Protein Communication. Protein Peptide Sci. 2009;10:116–127. doi: 10.2174/138920309787847563. [DOI] [PMC free article] [PubMed] [Google Scholar]
- (16).Hilser VJ, Wrabl JO, Motlagh HN. Structural and Energetic Basis of Allostery. Annu. Rev. Biophys. 2012;41:585–609. doi: 10.1146/annurev-biophys-050511-102319. [DOI] [PMC free article] [PubMed] [Google Scholar]
- (17).Tzeng S-R, Kalodimos CG. Dynamic Activation of an Allosteric Regulatory Protein. Nature. 2009;462:368–372. doi: 10.1038/nature08560. [DOI] [PubMed] [Google Scholar]
- (18).Hilser VJ. An Ensemble View of Allostery. Science. 2010;327:653–654. doi: 10.1126/science.1186121. [DOI] [PMC free article] [PubMed] [Google Scholar]
- (19).Bejugam PR, Kuppili RR, Singh N, Gadewal N, Chaganti LK, Sastry GM, Bose K. Allosteric Regulation of Serine Protease HtrA2 Through Novel Non-Canonical Substrate Binding Pocket. PLoS One. 2013;8:e55416–e55429. doi: 10.1371/journal.pone.0055416. [DOI] [PMC free article] [PubMed] [Google Scholar]
- (20).Choi HJ, Laurent AH, Hilser VJ, Ostermeier M. Design of Protein Switches Based on an Ensemble Model of Allostery. Nat. Commun. 2015;6:1–9. doi: 10.1038/ncomms7968. [DOI] [PMC free article] [PubMed] [Google Scholar]
- (21).Hilser VJ. Structural Biology: Signalling from Disordered Protreins. Nature. 2013;498:308–310. doi: 10.1038/498308a. [DOI] [PubMed] [Google Scholar]
- (22).Daily MD, Gray JJ. Local Motions in a Benchmark of Allosteric Proteins. Proteins Struct. Funct. Bioinform. 2007;67:385–399. doi: 10.1002/prot.21300. [DOI] [PubMed] [Google Scholar]
- (23).Daily MD, Gray JJ. Allosteric Communication Occurs via Networks of Tertiary and Quaternary Motions in Proteins. PLoS Comput. Biol. 2009;5:e1000293–e1100306. doi: 10.1371/journal.pcbi.1000293. [DOI] [PMC free article] [PubMed] [Google Scholar]
- (24).Laskowski RA, Gerick F, Thornton JM. The Structural Basis of Allosteric Regulation in Proteins. FEBS Lett. 2009;583:1692–1698. doi: 10.1016/j.febslet.2009.03.019. [DOI] [PubMed] [Google Scholar]
- (25).Nussinov R, Tsai C-J. Allostery Without a Conformational Change? Revisiting the Paradigm. Curr. Opin. Struct. Biol. 2015;30 doi: 10.1016/j.sbi.2014.11.005. [DOI] [PubMed] [Google Scholar]
- (26).Popovych N, Sun S, Ebright RH, Kalodimos CG. Dynamically Driven Protein Allostery. Nat. Struct. Mol. Biol. 2006;13:831–838. doi: 10.1038/nsmb1132. [DOI] [PMC free article] [PubMed] [Google Scholar]
- (27).Schrank TP, Bolen DW, Hilser VJ. Rational Modulation of Conformational Fluctuations in Adenylate Kinase Reveals a Local Unfolding Mechanism for Allostery and Functional Adaptation in Proteins. Proc. Natl. Acad. Sci. USA. 2009;106:16984–16989. doi: 10.1073/pnas.0906510106. [DOI] [PMC free article] [PubMed] [Google Scholar]
- (28).Schrank TP, Elam WA, Li J, Hilser VJ. Strategies for the Thermodynamic Characterization of Linked Binding/Local Folding Reactions Within the Native State: Application to the LID Domain of Adenylate Kinase from Escherichia coli. Methods Enzymol. 2011;492:253–282. doi: 10.1016/B978-0-12-381268-1.00020-3. [DOI] [PMC free article] [PubMed] [Google Scholar]
- (29).Lockless SW, Ranganathan R. Evolutionarily Conserved Pathways of Energetic Connectivity in Protein Families. Science. 1999;286:295–299. doi: 10.1126/science.286.5438.295. [DOI] [PubMed] [Google Scholar]
- (30).Rodriguez GJ, Yao R, Lichtarge O, Wensel TG. Evolution-Guided Discovery and Recoding of Allosteric Pathway Specificity Determinants in Psychoactive Bioamine Receptors. Proc. Natl. Acad. Sci. USA. 2010;107:7787–7792. doi: 10.1073/pnas.0914877107. [DOI] [PMC free article] [PubMed] [Google Scholar]
- (31).Gunasekaran K, Ma B, Nussinov R. Is Allostery an Intrinsic Property of All Dynamic Proteins? Proteins: Structure, Function, and Bioinformatics. 2004;57:433–443. doi: 10.1002/prot.20232. [DOI] [PubMed] [Google Scholar]
- (32).Hilser VJ, Thompson EB. Intrinsic Disorder as a Mechanism to Optimize Allosteric Coupling in Proteins. Proc. Natl. Acad. Sci. USA. 2007;104:8311–8315. doi: 10.1073/pnas.0700329104. [DOI] [PMC free article] [PubMed] [Google Scholar]
- (33).Bakan A, Bahar I. The Intrinsic Dynamics of Enzymes Plays a Dominant Role in Determining the Structural Changes Induced Upon Inhibitor Binding. Proc. Natl. Acad. Sci. USA. 2009;106:14349–14354. doi: 10.1073/pnas.0904214106. [DOI] [PMC free article] [PubMed] [Google Scholar]
- (34).Bahar I, Chennubhotla C, Tobi D. Intrinsic Dynamics of Enzymes in the Unbound State and Relation to Allosteric Regulation. Curr. Opin. Struct. Biol. 2007;117:633–640. doi: 10.1016/j.sbi.2007.09.011. [DOI] [PMC free article] [PubMed] [Google Scholar]
- (35).Rousseau F, Schymkowitz JA. A Systems Biology Perspective on Protein Structural Dynamics and Signal Transduction. Curr. Opin. Struct. Biol. 2005;15:23–30. doi: 10.1016/j.sbi.2005.01.007. [DOI] [PubMed] [Google Scholar]
- (36).Ming D, Wall ME. Allostery in a Coarse-Grained Model of Protein Dynamics. Phys. Rev. Lett. 2005;95:198103–198106. doi: 10.1103/PhysRevLett.95.198103. [DOI] [PubMed] [Google Scholar]
- (37).Rivalta I, Sultan MM, Lee NS, Manley G, Loria JP, Batista VS. Allosteric Pathways in Imidazole Glycerol Phosphate Synthase. Proc. Natl. Acad. Sci. USA. 2012;109:E1428–E1436. doi: 10.1073/pnas.1120536109. [DOI] [PMC free article] [PubMed] [Google Scholar]
- (38).Kern D, Zuiderweg ERP. The Role of Dynamics in Allosteric Regulation. Curr. Opin. Struct. Biol. 2003;13 doi: 10.1016/j.sbi.2003.10.008. [DOI] [PubMed] [Google Scholar]
- (39).Hammes-Schiffer S, Benkovic SJ. Relating Protein Motion to Catalysis. Annu. Rev. Biochem. 2006;75:519–541. doi: 10.1146/annurev.biochem.75.103004.142800. [DOI] [PubMed] [Google Scholar]
- (40).Kumar S, Ma B, Tsai C-J, Nussinov R. Folding Funnels and Conformational Transitions via Hinge-Bending Motions. Cell Biochem. Biophys. 1999;31:141–164. doi: 10.1007/BF02738169. [DOI] [PubMed] [Google Scholar]
- (41).Chakravorty DK, Wang B, Lee CW, Giedroc DP, Merz KMJ. Simulations of Allosteric Motions in the Zinc Sensor CzrA. J. Am. Chem. Soc. 2012;134:3367–3376. doi: 10.1021/ja208047b. [DOI] [PMC free article] [PubMed] [Google Scholar]
- (42).Ahalawat N, Muraka RK. Conformational Changes and Allosteric Communications in Human Serum Albumin due to Ligand Binding. J. Biomol. Struct. Dyn. 2015;12:1–13. doi: 10.1080/07391102.2014.996609. [DOI] [PubMed] [Google Scholar]
- (43).Yuan Y, Tam MF, Simplaceanu V, Ho C. New Look at Hemoglobin Allostery. Chem. Rev. 2015;115:1702–1724. doi: 10.1021/cr500495x. [DOI] [PMC free article] [PubMed] [Google Scholar]
- (44).Changeux J-P, Edelstein SJ. Allosteric Mechanisms of Signal Transduction. Science. 2005;308:1424–1428. doi: 10.1126/science.1108595. [DOI] [PubMed] [Google Scholar]
- (45).Wand AJ. Dynamic Activation of Protein Function: A View Emerging from NMR Spectroscopy. Nat. Struct. Biol. 2001;8:926–931. doi: 10.1038/nsb1101-926. [DOI] [PubMed] [Google Scholar]
- (46).Tsai C-J, del Sol A, Nussinov R. Allostery: Absence of a Change in Shape Does Not Imply that Allostery is Not at Play. J. Mol. Biol. 2008;378 doi: 10.1016/j.jmb.2008.02.034. [DOI] [PMC free article] [PubMed] [Google Scholar]
- (47).Volkman BF, Lipson D, Wemmer DE, Kern D. Two-State Allosteric Behavior in a Single-Domain Signaling Protein. Science. 2001;291:2429–2433. doi: 10.1126/science.291.5512.2429. [DOI] [PubMed] [Google Scholar]
- (48).Henzler-Wildman K, Kern D. Dynamic Personalities of Proteins. Nature. 2007;450:964–972. doi: 10.1038/nature06522. [DOI] [PubMed] [Google Scholar]
- (49).Dyson HJ, Wright PE. Unfolded Proteins and Protein Folding Studied by NMR. Chem. Rev. 2004;104:3607–3622. doi: 10.1021/cr030403s. [DOI] [PubMed] [Google Scholar]
- (50).Palmer AG., 3rd NMR characterization of the dynamics of biomacromolecules. Chem Rev. 2004;104:3623–3640. doi: 10.1021/cr030413t. [DOI] [PubMed] [Google Scholar]
- (51).Loria JP, Berlow RB, Watt ED. Characterization of Enzyme Motions by Solution NMR Relaxation Dispersion. Acc. Chem. Res. 2008;41:214–221. doi: 10.1021/ar700132n. [DOI] [PubMed] [Google Scholar]
- (52).Palmer AG., III Enzyme Dynamics from NMR Spectroscopy. Acc. Chem. Res. 2015;48:457–465. doi: 10.1021/ar500340a. [DOI] [PMC free article] [PubMed] [Google Scholar]
- (53).Mittermaier AK, Kay LE. Observing Biological Dynamics at Atomic Resolution Using NMR. Trends Biochem. Sci. 2009;34:601–611. doi: 10.1016/j.tibs.2009.07.004. [DOI] [PubMed] [Google Scholar]
- (54).Baldwin AJ, Kay LE. NMR Spectroscopy Brings Invisible Protein States into Focus. Nat. Chem. Biol. 2009;5:808–814. doi: 10.1038/nchembio.238. [DOI] [PubMed] [Google Scholar]
- (55).Lange OF, Lakomek NA, Fares C, Schroder GF, Walter KF, Becker S, Meiler J, Grubmuller H, Griesinger C, de Groot BL. Recognition Dynamics Up to Microseconds Revealed from an RDC-Derived Ubiquitin Ensemble in Solution. Science. 2008;320:1471–1475. doi: 10.1126/science.1157092. [DOI] [PubMed] [Google Scholar]
- (56).Boehr DD, Nussinov R, Wright PE. The Role of Dynamic Conformational Ensembles in Biomolecular Recognition. Nat. Chem. Biol. 2009;5:789–796. doi: 10.1038/nchembio.232. [DOI] [PMC free article] [PubMed] [Google Scholar]
- (57).Eisenmesser EZ, Millet O, Labeikovsky W, Korzhnev DM, Wolf-Watz M, Bosco DA, Skalicky JJ, Kay LE, Kern D. Intrinsic Dynamics of an Enzyme Underlies Catalysis. Nature. 2005;438:117–121. doi: 10.1038/nature04105. [DOI] [PubMed] [Google Scholar]
- (58).Boehr DD, McElheny D, Dyson HJ, Wright PE. The Dynamic Energy Landscape of Dihydrofolate Reductase Catalysis. Science. 2006;313:1638–1642. doi: 10.1126/science.1130258. [DOI] [PubMed] [Google Scholar]
- (59).Mittermaier AK, Kay LE. New Tools Provide New Insights in NMR Studies of Protein Dynamics. Science. 2006;312:224–228. doi: 10.1126/science.1124964. [DOI] [PubMed] [Google Scholar]
- (60).Igumenova TI, Frederick KK, Wand AJ. Characterization of the Fast Dynamics of Protein Amino Acid Side Chains Using NMR Relaxation in Solution. Chem. Rev. 2006;106:1672–1699. doi: 10.1021/cr040422h. [DOI] [PMC free article] [PubMed] [Google Scholar]
- (61).Trbovic N, Cho J-H, Abel R, Friesner RA, Rance M, Palmer AG., III Protein Side-Chain Dynamics and Residual Conformational Entropy. J. Am. Chem. Soc. 2009;131:615–622. doi: 10.1021/ja806475k. [DOI] [PMC free article] [PubMed] [Google Scholar]
- (62).Fuentes EJ, Der CJ, Lee AL. Ligand-Dependent Dynamics and Intramolecular Signaling in a PDZ Domain. J. Mol. Biol. 2004;335:1105–1115. doi: 10.1016/j.jmb.2003.11.010. [DOI] [PubMed] [Google Scholar]
- (63).Petit CM, Zhang J, Sapienza PJ, Fuentes EJ, Lee AL. Hidden Dynamic Allostery in a PDZ Domain. Proc. Natl. Acad. Sci. USA. 2009;106:18249–18254. doi: 10.1073/pnas.0904492106. [DOI] [PMC free article] [PubMed] [Google Scholar]
- (64).Lee AL. Contrasting Roles of Dynamics in Protein Allostery: NMR and Structural Studies of CheY and the Third PDZ Domain from PSD-95. Biophys. Rev. 2015;7:217–226. doi: 10.1007/s12551-015-0169-3. [DOI] [PMC free article] [PubMed] [Google Scholar]
- (65).Dhulesia A, Gsponer J, Vendruscolo M. Mapping of Two Networks of Residues that Exhibit Structural and Dynamical Changes Upon Binding in a PDZ Domain Protein. J. Am. Chem. Soc. 2008;130:8931–8939. doi: 10.1021/ja0752080. [DOI] [PubMed] [Google Scholar]
- (66).Zhang L, Bouget-Bonnet S, Buck M. Combining NMR and Molecular Dynamics for Insights into the Allostery of Small GTPase-Protein Interactions. Methods Mol. Biol. 2012;796:235–259. doi: 10.1007/978-1-61779-334-9_13. [DOI] [PMC free article] [PubMed] [Google Scholar]
- (67).Liu J, Zhang J, Yang Y, Huang H, Shen W, Hu Q, Wang X, Wu J, Shi Y. Conformational Change Upon Ligand Binding and Dynamics of the PDZ Domain from Leukemia-Associated Rho Guanine Nucleotide Exchange Factor. Protein Sci. 2008;17:1003–1014. doi: 10.1110/ps.073416508. [DOI] [PMC free article] [PubMed] [Google Scholar]
- (68).Jarymowycz VA, Stone MJ. Remote Changes in the Dynamics of the Phosphotyrosine-Binding Domain of Insulin Receptor Substrate-1 Induced by Phosphopeptide Binding. Biochemistry. 2008;47:13371–13382. doi: 10.1021/bi801096b. [DOI] [PubMed] [Google Scholar]
- (69).Jacoby E, Hua QX, Stern AS, Frank BH, Weiss MA. Structure and Dynamics of a Protein Assembly. 1H-NMR Studies of the 36 kDa R6 Insulin Hexamer. J. Mol. Biol. 1996;258:136–157. doi: 10.1006/jmbi.1996.0239. [DOI] [PubMed] [Google Scholar]
- (70).Popovych N, Tzeng S-R, Tonelli M, Ebright RH, Kalodimos CG. Structural Basis for cAMP-Mediated Allosteric Control of the Catabolite Activator Protein. Proceedings of the National Academy of Sciences of the United States of America. 2009;106:6927–6932. doi: 10.1073/pnas.0900595106. [DOI] [PMC free article] [PubMed] [Google Scholar]
- (71).Tzeng S-R, Kalodimos CG. Protein Activity Regulation by Conformational Entropy. Nature. 2012;488:236–240. doi: 10.1038/nature11271. [DOI] [PubMed] [Google Scholar]
- (72).Kalodimos CG. NMR Reveals Novel Mechanisms of Protein Activity Regulation. Protein Sci. 2011;20:773–782. doi: 10.1002/pro.614. [DOI] [PMC free article] [PubMed] [Google Scholar]
- (73).Hwang P, Bishop R, Kay LE. The Integral Membrane Enzyme PagP Alternates Between Two Dynamically Distinct States. Proc. Natl. Acad. Sci. USA. 2004;101:9618–9623. doi: 10.1073/pnas.0402324101. [DOI] [PMC free article] [PubMed] [Google Scholar]
- (74).Wiesner S, Wybenga-Groot L, Warner N, Lin H, Pawson T, Forman-Kay J, Sicheri F. A Change in Conformational Dynamics Underlies the Activation of Eph Receptor Tyrosine Kinases. EMBO J. 2006;25:4686–4696. doi: 10.1038/sj.emboj.7601315. [DOI] [PMC free article] [PubMed] [Google Scholar]
- (75).Masterson LR, Cheng C, Yu T, Tonelli M, Kornev A, Taylor SS, Veglia G. Dynamics Connect Substrate Recognition to Catalysis in Protein Kinase A. Nat. Chem. Biol. 2010;6:821–828. doi: 10.1038/nchembio.452. [DOI] [PMC free article] [PubMed] [Google Scholar]
- (76).Shi L, Kay LE. Tracing an Allosteric Pathway Regulating the Activity of the HsIV Protease. Proc. Natl. Acad. Sci. USA. 2014;111:2140–2145. doi: 10.1073/pnas.1318476111. [DOI] [PMC free article] [PubMed] [Google Scholar]
- (77).Axe JM, Boehr DD. Long-range interactions in the alpha subunit of tryptophan synthase help to coordinate ligand binding, catalysis, and substrate channeling. Journal of molecular biology. 2013;425:1527–1545. doi: 10.1016/j.jmb.2013.01.030. [DOI] [PubMed] [Google Scholar]
- (78).Axe JM, O'Rourke KF, Kerstetter NE, Yezdimer EM, Chan YM, Chasin A, Boehr DD. Severing of a hydrogen bond disrupts amino acid networks in the catalytically active state of the alpha subunit of tryptophan synthase. Protein science : a publication of the Protein Society. 2015;24:484–494. doi: 10.1002/pro.2598. [DOI] [PMC free article] [PubMed] [Google Scholar]
- (79).Coyne HJI, Giedroc DP. Backbone Resonance Assignments of the Homotetrameric (48 kD) Copper Sensor CsoR from Geobacillus thermodenitrificans in the Apo- and Cu(I)-Bound States: Insights into Copper-Mediated Allostery. Biomol. NMR Assign. 2013;7:279–283. doi: 10.1007/s12104-012-9428-4. [DOI] [PMC free article] [PubMed] [Google Scholar]
- (80).Chakravorty DK, Parker TM, Guerra AJ, Sherrill CD, Giedroc DP, Merz KMJ. Energetics of Zinc-Mediated Interactions in the Allosteric Pathways of Metal Sensor Proteins. J. Am. Chem. Soc. 2013;135:30–33. doi: 10.1021/ja309170g. [DOI] [PMC free article] [PubMed] [Google Scholar]
- (81).Pervushin K, Riek R, Wider G, Wuthrich K. Attenuated T2 relaxation by mutual cancellation of dipole-dipole coupling and chemical shift anisotropy indicates an avenue to NMR structures of very large biological macromolecules in solution. Proc. Natl. Acad. Sci. U S A. 1997;94:12366–12371. doi: 10.1073/pnas.94.23.12366. [DOI] [PMC free article] [PubMed] [Google Scholar]
- (82).Tugarinov V, Kanelis V, Kay LE. Isotope Labeling Strategies for the Study of High-Molecular-Weight Proteins by Solution NMR Spectroscopy. Nature Protocols. 2006;1:749–754. doi: 10.1038/nprot.2006.101. [DOI] [PubMed] [Google Scholar]
- (83).Tugarinov V, Kay LE. Ile, Leu, and Val Methyl Assignments of the 723-Residue Malate Synthase G Using a New Labeling Strategy and Novel NMR Methods. J. Am. Chem. Soc. 2003;125:13868–13878. doi: 10.1021/ja030345s. [DOI] [PubMed] [Google Scholar]
- (84).Grishaev A, Wu J, Trewhella J, Bax A. Refinement of Multidomain Protein Structures by Combination of Solution Small-Angle X-ray Scattering and NMR Data. J. Am. Chem. Soc. 2005;127:16621–16628. doi: 10.1021/ja054342m. [DOI] [PubMed] [Google Scholar]
- (85).Velyvis A, Yang YR, Schachman HK, Kay LE. A Solution NMR Study Showing that Active Site Ligands and Nucleotides Directly Perturb the Allosteric Equilibrium in Aspartate Transcarbamoylase. Proc. Natl. Acad. Sci. USA. 2007;104:8815–8820. doi: 10.1073/pnas.0703347104. [DOI] [PMC free article] [PubMed] [Google Scholar]
- (86).Velyvis A, Schachman HK, Kay LE. Application of Methyl-TROSY NMR to Test Allosteric Models Describing Effects of Nucleotide Binding to Aspartate Transcarbamoylase. J. Mol. Biol. 2009;387:540–547. doi: 10.1016/j.jmb.2009.01.066. [DOI] [PubMed] [Google Scholar]
- (87).Lipchock JM, Loria JP. Nanometer Propagation of Millisecond Motions in V-Type Allostery. Structure. 2010;18:1596–1607. doi: 10.1016/j.str.2010.09.020. [DOI] [PMC free article] [PubMed] [Google Scholar]
- (88).Manley G, Loria JP. NMR Insights into Protein Allostery. Arch. Biochem. Biophys. 2012;519:223–231. doi: 10.1016/j.abb.2011.10.023. [DOI] [PMC free article] [PubMed] [Google Scholar]
- (89).Akke M, Palmer AG. Monitoring macromolecular motions on microsecond-millisecond time scales by R1r-R1 constant-relaxation-time NMR spectroscopy. J. Am. Chem. Soc. 1996;118:911–912. [Google Scholar]
- (90).Loria JP, Rance M, Palmer AG., III A Relaxation-Compensated Carr-Purcell-Meiboom-Gill Sequence for Characterizing Chemical Exchange by NMR Spectroscopy. J. Am. Chem. Soc. 1999;121:2331–2332. [Google Scholar]
- (91).Mulder FA, Hon B, Mittermaier AK, Dahlquist FW, Kay LE. Slow Internal Dynamics in Proteins: Application of NMR Relaxation Dispersion Spectroscopy to Methyl Groups in a Cavity Mutant of T4 Lysozyme. J. Am. Chem. Soc. 2002;124:1443–1451. doi: 10.1021/ja0119806. [DOI] [PubMed] [Google Scholar]
- (92).Grey MJ, Wang C, Palmer AG., III Disulfide Bond Isomerization in Basic Pancreatic Trypsin Inhibitor: Multisite Chemical Exchange Quantified by CPMG Relaxation Dispersion and Chemical Shift Modeling. J. Am. Chem. Soc. 2003;125:14324–14335. doi: 10.1021/ja0367389. [DOI] [PubMed] [Google Scholar]
- (93).Massi F, Grey MJ, Palmer AG., III Microsecond Timescale Backbone Conformational Dynamics in Ubiquitin Studied by NMR R1rho Relaxation Experiments. Protein Sci. 2005;14:735–742. doi: 10.1110/ps.041139505. [DOI] [PMC free article] [PubMed] [Google Scholar]
- (94).Otten R, Villali J, Kern D, Mulder FAA. Probing Microsecond Time Scale Dynamics in Proteins by Methyl 1H Carr-Purcell-Meiboom-Gill Relaxation Dispersion NMR Measurements. Application to Activation of the Signaling Protein NtrCr. Journal of the American Chemical Society. 2010;132:17004–17014. doi: 10.1021/ja107410x. [DOI] [PMC free article] [PubMed] [Google Scholar]
- (95).Hill RB, Bracken C, DeGrado WF, Palmer AG., III Molecular Motions and Protein Folding: Characterization of the Backbone Dynamics and Folding Equilibrium of Alpha D-2 Using C-13 NMR Spin Relaxation. J. Am. Chem. Soc. 2000;122:11610–11619. [Google Scholar]
- (96).Korzhnev DM, Salvatella X, Vendruscolo M, Di Nardo AA, Davidson AR, Dobson CM, Kay LE. Low-Populated Folding Intermediate of Fyn SH3 Characterized by Relaxation Dispersion NMR. Nature. 2004;430:586–590. doi: 10.1038/nature02655. [DOI] [PubMed] [Google Scholar]
- (97).Tang Y, Grey MJ, McKnight J, Palmer AG, III, Raleigh DP. Multistate Folding of the Villin Headpiece Domain. J. Mol. Biol. 2006;355:1066–1077. doi: 10.1016/j.jmb.2005.10.066. [DOI] [PubMed] [Google Scholar]
- (98).Mittag T, Schaffhausen B, Gunther UL. Direct Observation of Protein-Ligand Interaction Kinetics. Biochemistry. 2003;42:11128–11136. doi: 10.1021/bi0347499. [DOI] [PubMed] [Google Scholar]
- (99).Tolkatchev D, Xu P, Ni F. Probing the Kinetic Landscape of Transient Peptide-Protein Interactions by Use of Peptide 15(N) NMR Relaxation Dispersion Spectroscopy: Binding of an Antithrombin Peptide to Human Prothrombin. J. Am. Chem. Soc. 2003;125:12432–12442. doi: 10.1021/ja021238l. [DOI] [PubMed] [Google Scholar]
- (100).Cole R, Loria JP. Evidence for Flexibility in the Function of Ribonuclease A. Biochemistry. 2002;41:6072–6081. doi: 10.1021/bi025655m. [DOI] [PubMed] [Google Scholar]
- (101).Beach H, Cole R, Gill M, Loria JP. Conservation of µs-ms Enzyme Motions in the Apo- and Substrate-Mimicked State. J. Am. Chem. Soc. 2005;127:9167–9176. doi: 10.1021/ja0514949. [DOI] [PubMed] [Google Scholar]
- (102).Kovrigin EL, Loria JP. Enzyme Dynamics Along the Reaction Coordinate: Critical Role of a Conserved Residue. Biochemistry. 2006;45:2636–2647. doi: 10.1021/bi0525066. [DOI] [PubMed] [Google Scholar]
- (103).Kovrigin EL, Loria JP. Characterization of the Transition State of Functional Enzyme Dynamics. J. Am. Chem. Soc. 2006;128:7724–7725. doi: 10.1021/ja061435a. [DOI] [PubMed] [Google Scholar]
- (104).Kempf JG, Loria JP. Theory and Applications of Protein Dynamics from Solution NMR. Cell Biochem. Biophys. 2002;37:187–211. doi: 10.1385/cbb:37:3:187. [DOI] [PubMed] [Google Scholar]
- (105).Berlow RB, Igumenova TI, Loria JP. Value of a Hydrogen Bond in Triosephosphate Isomerase Loop Motion. Biochemistry. 2007;46:6001–6010. doi: 10.1021/bi700344v. [DOI] [PubMed] [Google Scholar]
- (106).Kerns SJ, Agafonov RV, Cho Y-J, Pontiggia F, Otten R, Pachov DV, Kutter S, Phung LA, Murphy PN, Thai V. The Energy Landscape of Adenylate Kinase During Catalysis. Nat. Struct. Mol. Biol. 2015;22:124–131. doi: 10.1038/nsmb.2941. [DOI] [PMC free article] [PubMed] [Google Scholar]
- (107).Gardino AK, Kern D. Functional Dynmaics of Response Regulators Using NMR Relaxation Techniques. Methods Enzymol. 2007;423:149–165. doi: 10.1016/S0076-6879(07)23006-X. [DOI] [PubMed] [Google Scholar]
- (108).Boulton S, Akimoto M, Selvaratnam R, Bashiri A, Melacini G. A tool set to map allosteric networks through the NMR chemical shift covariance analysis. Scientific reports. 2014;4:7306. doi: 10.1038/srep07306. [DOI] [PMC free article] [PubMed] [Google Scholar]
- (109).Mazhab-Jafari MT, Das R, Fotheringham SA, SilDas S, Chowdhury S, Melacini G. Understanding cAMP-dependent allostery by NMR spectroscopy: comparative analysis of the EPAC1 cAMP-binding domain in its apo and cAMP-bound states. Journal of the American Chemical Society. 2007;129:14482–14492. doi: 10.1021/ja0753703. [DOI] [PubMed] [Google Scholar]
- (110).Selvaratnam R, Chowdhury S, VanSchouwen B, Melacini G. Mapping allostery through the covariance analysis of NMR chemical shifts. Proceedings of the National Academy of Sciences of the United States of America. 2011;108:6133–6138. doi: 10.1073/pnas.1017311108. [DOI] [PMC free article] [PubMed] [Google Scholar]
- (111).Palmer AG, III, Kroenke CD, Loria JP. Nuclear Magnetic Resonance for Quantifying Microsecond-to-Millisecond Motions in Biological Macromolecules. Methods Enzymol. 2001;339:204–238. doi: 10.1016/s0076-6879(01)39315-1. [DOI] [PubMed] [Google Scholar]
- (112).Kempf JG, Loria JP. Measurement of Intermediate Exchange Phenomena. In: Downing AK, editor. Protein NMR Techniques. Humana Press; Totowa, NJ: 2004. pp. 185–231. [DOI] [PubMed] [Google Scholar]
- (113).Lipchock JM, Loria JP. Monitoring Molecular Interactions by NMR. Meth. Mol. Biol. 2009;490:115–134. doi: 10.1007/978-1-59745-367-7_5. [DOI] [PubMed] [Google Scholar]
- (114).Clore GM, Szabo A, Bax A, Kay LE, Driscoll PC, Gronenborn AM. Deviations from the Simple Two-Parameter Model-Free Approach to the Interpretation of Nitrogen-15 Nuclear Magnetic Relaxation of Proteins. J. Am. Chem. Soc. 1990;112:4989–4991. [Google Scholar]
- (115).Peng JW, Wagner G. Mapping of Spectral Density Functions Using Heteronuclear NMR Relaxation Measurements. J. Magn. Reson. 1992;98:308–332. [Google Scholar]
- (116).Ishima R, Nagayama K. Protein Backbone Dynamics Revealed by Quasi Spectral Density Function Analysis of Amide N-15 Nuclei. Biochemistry. 1995;34:3162–3171. doi: 10.1021/bi00010a005. [DOI] [PubMed] [Google Scholar]
- (117).Mandel A, Akke M, Palmer AG., III Backbone Dynamics of Escherichia coli Ribonuclease HI: Correlations with Structure and Function in an Active Enzyme. J. Mol. Biol. 1995;246:144–163. doi: 10.1006/jmbi.1994.0073. [DOI] [PubMed] [Google Scholar]
- (118).Farrow NA, Zhang O, Szabo A, Torchia DA, Kay LE. Spectral Density Function Mapping Using 15N Relaxation Data Exclusively. J. Biomol. NMR. 1995;6:153–162. doi: 10.1007/BF00211779. [DOI] [PubMed] [Google Scholar]
- (119).d'Auvergne EJ, Gooley PR. The Use of Model Selection in the Model-Free Analysis of Protein Dynamics. J. Biomol. NMR. 2003;25:25–39. doi: 10.1023/a:1021902006114. [DOI] [PubMed] [Google Scholar]
- (120).Cole R, Loria JP. FAST-Modelfree: A Program for Rapid Automated Analysis of Solution NMR Spin-Relaxation Data. J. Biomol. NMR. 2003;26:203–213. doi: 10.1023/a:1023808801134. [DOI] [PubMed] [Google Scholar]
- (121).Palmer AG, 3rd, Massi F. Characterization of the dynamics of biomacromolecules using rotating-frame spin relaxation NMR spectroscopy. Chem Rev. 2006;106:1700–1719. doi: 10.1021/cr0404287. [DOI] [PubMed] [Google Scholar]
- (122).Cavanagh J, Fairbrother WJ, Palmer AG, Rance M, Skelton NJ. Protein NMR Spectroscopy: Principles and Practice. 2 Elsevier Academic Press; San Diego: 2007. [Google Scholar]
- (123).Abragam A. Principles of Nuclear Magnetism. Clarendon Press; Oxford, UK: 1961. [Google Scholar]
- (124).Wallach D. Effect of Internal Rotation on Angular Correlation Functions. J. Chem. Phys. 1967;47:5258–5268. [Google Scholar]
- (125).Li Z, Raychaudhuri S, Wand AJ. Insights into the local residual entropy of proteins provided by NMR relaxation. Protein Sci. 1996;5:2647–2650. doi: 10.1002/pro.5560051228. [DOI] [PMC free article] [PubMed] [Google Scholar]
- (126).Yang D, Kay LE. Contributions to conformational entropy arising from bond vector fluctuations measured from NMR-derived order parameters: Application to protein folding. J. Mol. Biol. 1996;263:369–382. doi: 10.1006/jmbi.1996.0581. [DOI] [PubMed] [Google Scholar]
- (127).Akke M, Brüschweiler R, Palmer AG. NMR order parameters and free energy: An analytic approach and application to cooperative Ca2+ binding by calbindin D9k. J. Am. Chem. Soc. 1993;115:9832–9833. [Google Scholar]
- (128).Tugarinov V, Sprangers R, Kay LE. Probing Side-Chain Dynamics in the Proteasome by Relaxation Violated Coherence Transfer NMR Spectroscopy. Journal of the American Chemical Society. 2007;129:1743–1750. doi: 10.1021/ja067827z. [DOI] [PubMed] [Google Scholar]
- (129).Loria JP, Rance M, Palmer AG. A TROSY CPMG sequence for characterizing chemical exchange in large proteins. J. Biomol. NMR. 1999;15:151–155. doi: 10.1023/a:1008355631073. [DOI] [PubMed] [Google Scholar]
- (130).Deverell C, Morgan RE, Strange JH. Chemical Exchange by Nuclear Magnetic Relaxation in the Rotating Frame. Mol Phys. 1970;18:553–559. [Google Scholar]
- (131).Carver JP, Richards RE. General Two-Site Solution for the Chemical Exchange Produced Dependence of T2 Upon the Carr-Purcell Pulse Separation. J. Magn. Reson. 1972;6:89–105. [Google Scholar]
- (132).Jen J. Chemical Exchange and NMR T2 Relaxation – The Multisite Case. J. Magn. Reson. 1978;30:111–128. [Google Scholar]
- (133).Davis DG, Perlman ME, London RE. Direct Measurements of the Dissociation-Rate Constant for Inhibitor-Enzyme Complexes Via the T1ρ and T2 (CPMG) Methods. J. Magn. Reson. 1994;104 doi: 10.1006/jmrb.1994.1084. [DOI] [PubMed] [Google Scholar]
- (134).Orekhov VY, Korzhnev DM, Kay LE. Double- and zero-quantum NMR relaxation dispersion experiments sampling millisecond time scale dynamics in proteins. J. Am. Chem. Soc. 2004;126:1886–1891. doi: 10.1021/ja038620y. [DOI] [PubMed] [Google Scholar]
- (135).Korzhnev DM, Kloiber K, Kay LE. Multiple-quantum relaxation dispersion NMR spectroscopy probing millisecond time-scale dynamics in proteins: theory and application. J. Am. Chem. Soc. 2004;126:7320–7329. doi: 10.1021/ja049968b. [DOI] [PubMed] [Google Scholar]
- (136).Luz Z, Meiboom S. Nuclear Magnetic Resonance (N.M.R.) Study of the Protolysis of Trimethylammonium Ion in Aqueous Solution. Order of the Reaction with Respect to Solvent. J. Chem. Phys. 1963;39:366–370. [Google Scholar]
- (137).Ishima R, Torchia DA. Estimating the Time Scale of Chemical Exchange of Proteins from Measurements of Transverse Relaxation Rates in Solution. J. Biomol. NMR. 1999;14:369–372. doi: 10.1023/a:1008324025406. [DOI] [PubMed] [Google Scholar]
- (138).Millet O, Loria JP, Kroenke CD, Pons M, Palmer AG., III The Static Magnetic Field Dependence of Chemical Exchange Linebroadening Defines the NMR Chemical Shift Time Scale. J. Am. Chem. Soc. 2000;122:2867–2877. [Google Scholar]
- (139).Kovrigin EL, Kempf JG, Grey MJ, Loria JP. Faithful Estimation of Dynamics Parameters from CPMG Relaxation Dispersion Measurements. J. Magn. Reson. 2006;180:93–104. doi: 10.1016/j.jmr.2006.01.010. [DOI] [PubMed] [Google Scholar]
- (140).Isaacson RL, Simpson PJ, Liu M, Cota E, Zhang X, Freemont P, Matthews S. A New Labeling Method for Methyl Transverse Relaxation-Optimized Spectroscopy NMR Spectra of Alanine Residues. J. Am. Chem. Soc. 2007;129:15428–15429. doi: 10.1021/ja0761784. [DOI] [PMC free article] [PubMed] [Google Scholar]
- (141).Korzhnev DM, Kloiber K, Kanelis V, Tugarinov V, Kay LE. Probing Slow Dynamics in High Molecular Weight Proteins by Methyl-Trosy NMR Spectroscopy: Application to a 723-Residue Enzyme. J. Am. Chem. Soc. 2004;126:3964–3973. doi: 10.1021/ja039587i. [DOI] [PubMed] [Google Scholar]
- (142).Pervushin K, Riek R, Wider G, Wuthrich K. Attenuated T2 Relaxation by Mutual Cancellation of Dipole-Dipole Coupling and Chemical Shift Anisotropy Indicates an Avenue to NMR Structures of Very Large Biological Macromolecules in Solution. Proc. Natl. Acad. Sci. USA. 1997;94:12366–12371. doi: 10.1073/pnas.94.23.12366. [DOI] [PMC free article] [PubMed] [Google Scholar]
- (143).Trott O, Palmer AG., III R1ρ Relaxation Outside of the Fast-Exchange Limit. J. Magn. Reson. 2002;154:157–160. doi: 10.1006/jmre.2001.2466. [DOI] [PubMed] [Google Scholar]
- (144).Trott O, Palmer AG., 3rd R1rho relaxation outside of the fast-exchange limit. J. Magn. Reson. 2002;154:157–160. doi: 10.1006/jmre.2001.2466. [DOI] [PubMed] [Google Scholar]
- (145).Trott O, Palmer AG., 3rd Theoretical study of R(1rho) rotating-frame and R2 free-precession relaxation in the presence of n-site chemical exchange. J. Magn. Reson. 2004;170:104–112. doi: 10.1016/j.jmr.2004.06.005. [DOI] [PubMed] [Google Scholar]
- (146).Miloushev VZ, Palmer AG., 3rd R(1rho) relaxation for two-site chemical exchange: general approximations and some exact solutions. J Magn Reson. 2005;177:221–227. doi: 10.1016/j.jmr.2005.07.023. [DOI] [PubMed] [Google Scholar]
- (147).Kempf JG, Jung J, Sampson NS, Loria JP. Off-resonance TROSY (R1r – R1) for quantitation of fast exchange processes in large proteins. J. Am. Chem. Soc. 2003;125:12064–12065. doi: 10.1021/ja037101s. [DOI] [PubMed] [Google Scholar]
- (148).Igumenova TI, Palmer AG., 3rd Off-resonance TROSY-selected R1rho experiment with improved sensitivity for medium- and high-molecular-weight proteins. J. Am. Chem. Soc. 2006;128:8110–8111. doi: 10.1021/ja061692f. [DOI] [PubMed] [Google Scholar]
- (149).Saupe A, Englert G. High-Resolution Nuclear Magnetic Resonance (N.M.R.) Spectra of Oriented Molecules. Phys. Rev. Lett. 1963;11:462–464. [Google Scholar]
- (150).Tjandra N, Bax A. Direct Measurement of Distances and Angles in Biomolecules by NMR in a Dilute Liquid Crystalline Medium. Science. 1997;278:1111–1114. doi: 10.1126/science.278.5340.1111. [DOI] [PubMed] [Google Scholar]
- (151).Sanders CR, Prosser RS. Bicelles: A Model Membrance System for All Seasons? Struct. Fold. Des. 1998;67:1227–1234. doi: 10.1016/s0969-2126(98)00123-3. [DOI] [PubMed] [Google Scholar]
- (152).Clore GM, Starich MR, Gronenborn AM. Measurement of Residual Dipolar Couplings of Macromolecules Aligned in the Nematic Phase of a Colloidal Suspension of Rod-Shaped Viruses. J. Am. Chem. Soc. 1998;120:10571–10572. [Google Scholar]
- (153).Hansen MR, Mueller L, Pardi A. Tunable Alignment of Macromolecules by Filamentous Phage Yields Dipolar Coupling Interactions. Nat. Struct. Biol. 1998;5:1065–1074. doi: 10.1038/4176. [DOI] [PubMed] [Google Scholar]
- (154).Tolman JR, Flanagan JM, Kennedy MA, Prestegard JH. Nuclear Magnetic Dipole Interactions in Field-Oriented Proteins: Information for Structure Determination in Solution. Proc. Natl. Acad. Sci. USA. 1995;92:9279–9283. doi: 10.1073/pnas.92.20.9279. [DOI] [PMC free article] [PubMed] [Google Scholar]
- (155).Beger RD, Marathias VM, Volkman BF, Bolton PH. Determination of Internuclear Angles of DNA Using Paramagnetic-Assisted Magnetic Alignment. J. Magn. Reson. 1998;135:256–259. doi: 10.1006/jmre.1998.1527. [DOI] [PubMed] [Google Scholar]
- (156).Jain NU, Tijoe E, Savidor J, Boulie J. Redox-Dependent Structural Differences in Putidaredoxin Derived from Homologous Structure Refinement via Residual Dipolar Couplings. Biochemistry. 2005;44:9067–9078. doi: 10.1021/bi050152c. [DOI] [PubMed] [Google Scholar]
- (157).Ruckert M, Otting G. Alignment of Biological Macromolecules in Novel Nonionic Liquid Crystalline Media for NMR Experiments. J. Am. Chem. Soc. 2000;122:7793–7797. [Google Scholar]
- (158).Bax A, Grishaev A. Weak Alignment NMR: A Hawk-Eyed View of Biomolecular Structure. Curr. Opin. Struct. Biol. 2005;15:563–570. doi: 10.1016/j.sbi.2005.08.006. [DOI] [PubMed] [Google Scholar]
- (159).Lipsitz RS, Tjandra N. Residual Dipolar Couplings in NMR Structure Analysis. Annu. Rev. Biophys. Biomol. Struct. 2004;33:387–413. doi: 10.1146/annurev.biophys.33.110502.140306. [DOI] [PubMed] [Google Scholar]
- (160).Shepherdson M, Pardee AB. Production and Crystallization of Aspartate Transcarbamylase. J. Biol. Chem. 1960;235:3233–3237. [Google Scholar]
- (161).Gerhart JC, Pardee AB. The Enzymology of Control by Feedback Inhibition. J. Biol. Chem. 1962;237:891–896. [PubMed] [Google Scholar]
- (162).Kantrowitz ER. Allostery and Cooperativity in Escherichia coli Aspartate Transcarbamoylase. Arch. Biochem. Biophys. 2012;519:81–90. doi: 10.1016/j.abb.2011.10.024. [DOI] [PMC free article] [PubMed] [Google Scholar]
- (163).Weber K. New Structural Model of Escherichia coli Aspartate Transcarbamylase and the Amino Acid Sequence of the Regulatory Polypeptide Chain. Nature. 1968;218:1116–1119. doi: 10.1038/2181116a0. [DOI] [PubMed] [Google Scholar]
- (164).Wiley DC, Lipscomb WN. Crystallographic Determination of Symmetry of Aspartate Transcarbamylase. Nature. 1968;218:1119–1121. doi: 10.1038/2181119a0. [DOI] [PubMed] [Google Scholar]
- (165).Weber K. Aspartate Transcarbamylase from Escherichia coli: Characterization of the Polypeptide Chains by Molecular Weight, Amino Acid Composition, and Amino-Terminal Residues. J. Biol. Chem. 1968;243:543–546. [PubMed] [Google Scholar]
- (166).Howlett GJ, Blackburn MN, Compton JG, Schachman HK. Allosteric Regulation of Aspartate Transcarbamoylase. Analysis of the Structural and Functional Behavior in Terms of a Two-State Model. Biochemistry. 1977;16:5091–5100. doi: 10.1021/bi00642a023. [DOI] [PubMed] [Google Scholar]
- (167).Ke H, Lipscomb WN, Cho Y, Honzatko RB. Complex of N-phosphonacetyl-L-aspartate with aspartate carbamoyltransferase. X-ray Refinement, Analysis of Conformational Changes and Catalytic and Allosteric Mechanisms. J. Mol. Biol. 1988;204:725–747. doi: 10.1016/0022-2836(88)90365-8. [DOI] [PubMed] [Google Scholar]
- (168).Wang J, Stieglitz KA, Cardia JP, Kantrowitz ER. Structural Basis for Ordered Substrate Binding and Cooperativity in Aspartate Transcarbamoylase. Proc. Natl. Acad. Sci. USA. 2005;102:8881–8886. doi: 10.1073/pnas.0503742102. [DOI] [PMC free article] [PubMed] [Google Scholar]
- (169).Jin L, Boguslaw S, Lipscomb WN, Kantrowitz ER. Insights into the Mechanism of Catalysis and Heterotropic Regulation of Escherichia coli Aspartate Transcarbamoylase Based Upon a Structure of the Enzyme Complexed with the Bisubstrate Analogue N-phosphonacetyl-L-aspartate at 2.1 Å. Proteins: Struct. Funct. Genet. 1999;37:729–742. [PubMed] [Google Scholar]
- (170).Stevens RC, Lipscomb WN. A Molecular Mechanism for Pyrimidine and Purine Nucleotide Control of Aspartate Transcarbamoylase. Proc. Natl. Acad. Sci. USA. 1992;89:5281–5285. doi: 10.1073/pnas.89.12.5281. [DOI] [PMC free article] [PubMed] [Google Scholar]
- (171).Vickers LP, Donovan JW, Schachman HK. Differential Scanning Calorimetry of Aspartate Transcarbamoylase and its Isolated Subunits. J. Biol. Chem. 1978;253:8493–8498. [PubMed] [Google Scholar]
- (172).Edge V, Allewell NM, Sturtevant JM. Differential Scanning Calorimetric Study of the Thermal Denaturation of Aspartate Transcarbamoylase of Escherichia coli. Biochemistry. 1988;27:8081–8087. doi: 10.1021/bi00421a017. [DOI] [PubMed] [Google Scholar]
- (173).Cohlberg JA, Pigiet VPJ, Schachman HK. Structure and Arrangement of the Regulatory Subunits in Aspartate Transcarbamylase. Biochemistry. 1972;11:3396–3411. doi: 10.1021/bi00768a013. [DOI] [PubMed] [Google Scholar]
- (174).Enns CA, Chan W-C. Stabilization of the Relaxed State of Aspartate Transcarbamoylase by Modification with a Bifunctional Reagent. J. Biol. Chem. 1978;253:2511–2513. [PubMed] [Google Scholar]
- (175).West JM, Tsuruta H, Kantrowitz ER. Stabilization of the R Allosteric Structure of Escherichia coli Aspartate Transcarbamoylase by Disulfide Bond Formation. J. Biol. Chem. 2002;277:47300–47304. doi: 10.1074/jbc.M209913200. [DOI] [PubMed] [Google Scholar]
- (176).Mendes KR, Kantrowitz ER. The Pathway of Product Release from the R State of Aspartate Transcarbamoylase. J. Mol. Biol. 2010;401:940–948. doi: 10.1016/j.jmb.2010.07.003. [DOI] [PMC free article] [PubMed] [Google Scholar]
- (177).Mendes KR, Kantrowitz ER. A Cooperative Escherichia coli Aspartate Transcarbamoylase without Regulatory Subunits. Biochemistry. 2010;49:7694–7703. doi: 10.1021/bi1010333. [DOI] [PMC free article] [PubMed] [Google Scholar]
- (178).Newton CJ, Kantrowitz ER. Importance of Domain Closure for Homotropic Cooperativity in Escherichia coli Aspartate Transcarbamoylase. Biochemistry. 1990;29:1444–1451. doi: 10.1021/bi00458a015. [DOI] [PubMed] [Google Scholar]
- (179).Fetler L, Kantrowitz ER, Vachette P. Direct Observation in Solution of a Preexisting Structural Equilibrium for a Mutant of the Allosteric Aspartate Transcarbamoylase. Proc. Natl. Acad. Sci. USA. 2007;104:495–500. doi: 10.1073/pnas.0607641104. [DOI] [PMC free article] [PubMed] [Google Scholar]
- (180).West JM, Xia J, Tsuruta H, Guo W, O'Day EM, Kantrowitz ER. Time Evolution of the Quaternary Structure of Escherichia coli Aspartate Transcarbamoylase upon Reduction with the Natural Substrates and a Slow, Tight-Binding Inhibitor. J. Mol. Biol. 2008;384:206–218. doi: 10.1016/j.jmb.2008.09.022. [DOI] [PMC free article] [PubMed] [Google Scholar]
- (181).Stieglitz KA, Stec B, Baker DP, Kantrowitz ER. Monitoring the Transition from the T to the R State in E. coli Aspartate Transcarbamoylase by X-ray Crystallography: Crystal Structures of the E50A Mutant Enzyme in Four Distinct Allosteric States. J. Mol. Biol. 2004;341:853–868. doi: 10.1016/j.jmb.2004.06.002. [DOI] [PubMed] [Google Scholar]
- (182).Peterson AW, Cockrell GM, Kantrowitz ER. A Second Allosteric Site in Escherichia coli Aspartate Transcarbamoylase. Biochemistry. 2012;51:4776–4778. doi: 10.1021/bi3006219. [DOI] [PMC free article] [PubMed] [Google Scholar]
- (183).Cockrell GM, Kantrowitz ER. Metal Ion Involvement in the Allosteric Mechanism of Escherichia coli Asapartate Transcarbamoylase. Biochemistry. 2012;51:7128–7137. doi: 10.1021/bi300920m. [DOI] [PMC free article] [PubMed] [Google Scholar]
- (184).Honzatko RB, Lauritzen AM, Lipscomb WN. Metal Cation Influence on Activity and Regulation of Aspartate Carbamoyltransferase. Proc. Natl. Acad. Sci. USA. 1981;78 doi: 10.1073/pnas.78.2.898. [DOI] [PMC free article] [PubMed] [Google Scholar]
- (185).Kleppe K, Spaeren U. Aspartate Transcarbamylase from Escherichia coli. II. Interaction of Metal Ions with Substrates, Inhibitors, and Activators. Biochim. Biophys. Acta. 1966;128:199–202. doi: 10.1016/0926-6593(66)90161-5. [DOI] [PubMed] [Google Scholar]
- (186).Changeux J-P. 50 Years of Allosteric Interactions: The Twists and Turns of the Models. Nat. Rev. Mol. Cell Biol. 2013;14:819–829. doi: 10.1038/nrm3695. [DOI] [PubMed] [Google Scholar]
- (187).Schachman HK. Can a Simple Model Account for the Allosteric Transition of Aspartate Transcarbamoylase? J. Biol. Chem. 1988;263:18583–18586. [PubMed] [Google Scholar]
- (188).Tauc P, Leconte C, Kerbiriou D, Thiry L, Herve G. Coupling of Homotropic and Heterotropic Interactions in Escherichia coli Aspartate Transcarbamoylase. J. Mol. Biol. 1982;155:155–168. doi: 10.1016/0022-2836(82)90442-9. [DOI] [PubMed] [Google Scholar]
- (189).Eisenstein E, Markby DW, Schachman HK. Heterotropic Effectors Promote a Global Conformational Change in Aspartate Transcarbamoylase. Biochemistry. 1990;29:3724–3731. doi: 10.1021/bi00467a019. [DOI] [PubMed] [Google Scholar]
- (190).Fetler L, Vachette P. The Allosteric Activator Mg-ATP Modifies the Quaternary Structure of the R-State of Escherichia coli Aspartate Transcarbamoylase Without Altering the T-R Equilibrium. J. Mol. Biol. 2001;309:817–832. doi: 10.1006/jmbi.2001.4681. [DOI] [PubMed] [Google Scholar]
- (191).Schmidt PG, Stark GR, Baldeschwieler JD. Aspartate Transcarbamoylase: A Nuclear Magnetic Resonance Study of the Binding of Inhibitors and Substrates to the Catalytic Subunit. J. Biol. Chem. 1969;244:1860–1868. [PubMed] [Google Scholar]
- (192).Roberts MF, Schaffer MH, Phillips HM, Stark GR. Evidence from Carbon-13 NMR for Protonation of Carbamyl-P and N-(phosphonacetyl)-L-aspartate in the Active Site of Aspartate Transcarbamoylase. J. Biol. Chem. 1976;251:5976–5985. S.J., O. [PubMed] [Google Scholar]
- (193).Moore AC, Browne DT. Binding of Regulatory Nucleotides to Aspartate Transcarbamoylase: Nuclear Magnetic Resonance Studies of Selectively Enriched Carbon-13 Regulatory Subunit. Biochemistry. 1980;19:5768–5773. doi: 10.1021/bi00566a016. [DOI] [PubMed] [Google Scholar]
- (194).Wacks DB, Schachman HK. Fluorine-19 Nuclear Magnetic Resonance Studies of Communication Between Catalytic and Regulatory Subunits in Aspartate Transcarbamoylase. J. Biol. Chem. 1985;260:11659–11662. [PubMed] [Google Scholar]
- (195).Kleanthous C, Wemmer DE, Schachman HK. The Role of an Active Site Histidine in the Catalytic Mechanism of Aspartate Transcarbamoylase. J. Biol. Chem. 1988;263:13062–13067. [PubMed] [Google Scholar]
- (196).Cohen RF, Takama M, Schachman HK. Proton NMR Studies on the Catalytic Subunit of Aspartate Transcarbamoylase. Proc. Natl. Acad. Sci. USA. 1992;89:11881–11885. doi: 10.1073/pnas.89.24.11881. [DOI] [PMC free article] [PubMed] [Google Scholar]
- (197).Newell JO, Schachman HK. Amino Acid Substitutions Which Stabilize Aspartate Transcarbamoylase in the R-State Disrupt Both Homotropic and Heterotropic Effects. Biophys. Chem. 1990;37:183–196. doi: 10.1016/0301-4622(90)88018-n. [DOI] [PubMed] [Google Scholar]
- (198).Herve G, Moody MF, Tauc P, Vachette P, Jones PT. Quaternary Structure Changes in Aspartate Transcarbamoylase Studied by X-Ray Solution Scattering. Signal Transmission Following Effector Binding. J. Mol. Biol. 1985;185:189–199. doi: 10.1016/0022-2836(85)90190-1. [DOI] [PubMed] [Google Scholar]
- (199).Howlett GJ, Blackburn MN, Compton JG, Schachman HK. Allosteric Regulation of Aspartate Transcarbamoylase. Analysis of the Structural and Functional Behavior in Terms of a Two-State Model. Biochemistry. 1977;16:5091–5099. doi: 10.1021/bi00642a023. [DOI] [PubMed] [Google Scholar]
- (200).Foote J, Schachman HK. Homotropic Effects in Aspartate Transcarbamoylase. What Happens When the Enzyme Binds a Single Molecule of the Bisubstrate Analog N-phosphonacetyl-L-aspartate? J. Mol. Biol. 1985;186:175–184. doi: 10.1016/0022-2836(85)90267-0. [DOI] [PubMed] [Google Scholar]
- (201).Thiry L, Herve G. The Stimulation of Escherichia coli Aspartate Transcarbamoylase. Relation with the Other Regulatory Conformational Changes; a Model. J. Mol. Biol. 1978;125:515–534. doi: 10.1016/0022-2836(78)90314-5. [DOI] [PubMed] [Google Scholar]
- (202).Hsuanyu Y, Wedler FC. Effectors of Escherichia coli Aspartate Transcarbamoylase Differentially Perturb Aspartate Binding Rather than the T-R Transition. J. Biol. Chem. 1988;263:4172–4181. [PubMed] [Google Scholar]
- (203).Thoma R, Obmolova G, Lang DA, Schwander M, Jeno P, Sterner R, Wilmanns M. Efficient Expression, Purification and Crystallization of Two Hyperthermostable Enzymes of Histidine Biosynthesis. FEBS Lett. 1999;454:1–6. doi: 10.1016/s0014-5793(99)00757-7. [DOI] [PubMed] [Google Scholar]
- (204).Beismann-Driemeyer S, Sterner R. Imidazole Glycerol Phosphate Synthase from Thermatoga maritima: Quaternary Structure, Steady-State Kinetics, and Reaction Mechanism of the Bienzyme Complex. J. Biol. Chem. 2001;276:20387–20396. doi: 10.1074/jbc.M102012200. [DOI] [PubMed] [Google Scholar]
- (205).Chaudhuri BN, Lange SC, Myers RS, Chittur SV, Davisson VJ, Smith JL. Crystal Structure of Imidazole Glycerol Phosphate Synthase: A Tunnel Through the (Beta/Alpha)8 Barrel Joins Two Active Sites. Structure. 2001;9:987–997. [PubMed] [Google Scholar]
- (206).Chaudhuri BN, Lange SC, Myers RS, Davisson VJ, Smith JL. Toward Understanding the Mechanism of the Complex Cyclization Reaction Catalyzed by Imidazole Glycerolphosphate Synthase: Crystal Structures of a Ternary Complex and the Free Enzyme. Biochemistry. 2003;42:7003–7012. doi: 10.1021/bi034320h. [DOI] [PubMed] [Google Scholar]
- (207).Zalkin H, Smith JL. Utilizing Glutamine as an Amide Donor. Adv. Enzymol. Relat. Areas Mol. Biol. 1998;72:87–144. doi: 10.1002/9780470123188.ch4. [DOI] [PubMed] [Google Scholar]
- (208).Huang X, Holden HM, Raushel FM. Channeling of Substrates and Intermediates in Enzyme-Catalyzed Reactions. Annu. Rev. Biochem. 2001;70:149–180. doi: 10.1146/annurev.biochem.70.1.149. [DOI] [PubMed] [Google Scholar]
- (209).Krahn JM, Kim JH, Burns MR, Parry RJ, Zalkin H, Smith JL. Coupled Formation of an Amidotransferase Interdomain Ammonia Channel and a Phosphoribosyltransferase Active Site. Biochemistry. 1997;36:11061–11068. doi: 10.1021/bi9714114. [DOI] [PubMed] [Google Scholar]
- (210).Chen S, Burgner JW, Krahn JM, Smith JL, Zalkin H. Tryptophan Fluorescence Monitors Multiple Conformational Changes Required for Glutamine Phosphoribosylpyrophosphate Amidotransferase Interdomain Signaling and Catalysis. Biochemistry. 1999;38:11659–11669. doi: 10.1021/bi991060o. [DOI] [PubMed] [Google Scholar]
- (211).Bera AK, Chen S, Smith JL, Zalkin H. Temperature-Dependent Function of the Glutamine Phosphoribosylpyrophosphate Amidotransferase Ammonia Channel and Coupling with Glycinamide Ribonucleotide Synthetase in a Hyperthermophile. J. Bacteriol. 2000;182:3734–3739. doi: 10.1128/jb.182.13.3734-3739.2000. [DOI] [PMC free article] [PubMed] [Google Scholar]
- (212).Mullins LS, Raushel FM. Channeling of Ammonia Through the Intermolecular Tunnel Contained within Carbamoyl Phosphate Synthetase. J. Am. Chem. Soc. 1999;121:3803–3804. [Google Scholar]
- (213).Huang X, Raushel FM. Restricted Passage of Reaction Intermediates Through the Ammonia Tunnel of Carbamoyl Phosphate Synthetase. J. Biol. Chem. 2000;275:26233–26240. doi: 10.1074/jbc.275.34.26233. [DOI] [PubMed] [Google Scholar]
- (214).Thoden JB, Huang X, Raushel FM, Holden HM. Carbamoyl-Phosphate Synthetase. Creation of an Escape Route for Ammonia. J. Biol. Chem. 2002;277:39722–39727. doi: 10.1074/jbc.M206915200. [DOI] [PubMed] [Google Scholar]
- (215).Douangamath A, Wlaker M, Beismann-Driemeyer S, Vega-Fernandez MC, Sterner R, Wilmanns M. Structural Evidence for Ammonia Tunneling Across the (Beta/Alpha)8 Barrel of the Imidazole Glycerol Phosphate Synthase Bienzyme Complex. Structure. 2002;10:185–193. doi: 10.1016/s0969-2126(02)00702-5. [DOI] [PubMed] [Google Scholar]
- (216).Omi R, Mizuguchi H, Goto M, Miyahara I, Hayashi H, Kagamiyama H, Hirotsu K. Structure of Imidazole Glycerol Phosphate Synthase from Thermus thermophilus HB8: Open-Closed Conformational Change and Ammonia Tunneling. J. Biochem. 2002;132:759–765. doi: 10.1093/oxfordjournals.jbchem.a003284. [DOI] [PubMed] [Google Scholar]
- (217).Amaro RE, Tajkhorshid E, Luthey-Schulten ZA. Developing an Energy Landscape for the Novel Function of a (β/α)8 Barrel: Ammonia Conduction Through HisF. Proc. Natl. Acad. Sci. USA. 2003;100:7599–7604. doi: 10.1073/pnas.1331150100. [DOI] [PMC free article] [PubMed] [Google Scholar]
- (218).Klem TJ, Davisson VJ. Imidazole Glycerol Phosphate Synthase: The Glutamine Amidotransferase in Histidine Biosynthesis. Biochemistry. 1993;32:5177–5186. doi: 10.1021/bi00070a029. [DOI] [PubMed] [Google Scholar]
- (219).Lipchock JM, Loria JP. Millisecond Dynamics in the Allosteric Enzyme Imidazole Glycerol Phosphate Synthase (IGPS) from Thermatoga Maritima. J. Biomol. NMR. 2009;45:73–84. doi: 10.1007/s10858-009-9337-8. [DOI] [PMC free article] [PubMed] [Google Scholar]
- (220).Lipchock JM, Loria JP. 1H, 15N and 13C Resonance Assignment of Imidazole Glycerol Phosphate (IGP) Synthase Protein HisF from Thermatoga maritima. Biomol. NMR Assign. 2008;2:219–221. doi: 10.1007/s12104-008-9125-5. [DOI] [PMC free article] [PubMed] [Google Scholar]
- (221).Chittur SV, Klem TJ, Shafer CM, Davisson VJ. Mechanism for Acivicin Inactivation of Triad Glutamine Amidotransferases. Biochemistry. 2001;40:876–887. doi: 10.1021/bi0014047. [DOI] [PubMed] [Google Scholar]
- (222).Kimmel JL, Reinhart GD. Reevaluation of the accepted allosteric mechanism of phosphofructokinase from Bacillus stearothermophilus. Proc Natl Acad Sci U S A. 2000;97:3844–3849. doi: 10.1073/pnas.050588097. [DOI] [PMC free article] [PubMed] [Google Scholar]
- (223).Reinhart GD. Quantitative Analysis and Interpretation of Allosteric Behavior. Methods Enzymol. 2004;380:187–203. doi: 10.1016/S0076-6879(04)80009-0. [DOI] [PubMed] [Google Scholar]
- (224).Amaro RE, Sethi A, Myers RS, Davisson VJ, Luthey-Schulten ZA. A Network of Conserved Interactions Regulates the Allosteric Signal in a Glutamine Amidotransferase. Biochemistry. 2007;46:2156–2173. doi: 10.1021/bi061708e. [DOI] [PubMed] [Google Scholar]
- (225).Korolev S, Skarina T, Evdokimova E, Beasley S, Edwards A, Joachimiak A, Savchenko A. Crystal Structure of Glutamine Amidotransferase from Thermatoga maritima. Proteins. 2002;49:450–452. doi: 10.1002/prot.10161. [DOI] [PMC free article] [PubMed] [Google Scholar]
- (226).Cohen ML, Bloom BR, Murray CJL, Neu HC, Krause RM, Kuntz JD. Drug Resistance. Science. 1992;257:1050–1082. [Google Scholar]
- (227).Wiliams RJ, Heymann DL. Containment of Antibiotic Resistance. Science. 1998;279:1153–1154. doi: 10.1126/science.279.5354.1153. [DOI] [PubMed] [Google Scholar]
- (228).Lin J, Nishino K, Roberts MC, Tolmasky M, Aminov RI, Zhang L. Mechanisms of Antibiotic Resistance. Front. Microbiol. 2015;6:1–3. doi: 10.3389/fmicb.2015.00034. [DOI] [PMC free article] [PubMed] [Google Scholar]
- (229).Shaw KJ, Rather PN, Hare RS, Miller GH. Molecular Genetics of Aminoglycoside Resistance Genes and Familial Relationships of the Aminoglycoside-Modifying Enzymes. Microbiol. Rev. 1993;57:138–163. doi: 10.1128/mr.57.1.138-163.1993. [DOI] [PMC free article] [PubMed] [Google Scholar]
- (230).Wright GD, Berghuis AM, Mobashery S. Aminoglycoside Antibiotics: Structures, Function and Resistance. In: Rosen BP, Mobashery S, editors. Resolving the Antibiotic Paradox: Progress in Drug Design and Resistance. Plenum Publishing Corp.; New York, NY: 1999. [Google Scholar]
- (231).Sakon J, Liao HH, Kanikula AM, Benning MM, Rayment I, Holden HM. Molecular Structure of Kanamycin Nucleotidyltransferase Determined at 3.0 Å Resolution. Biochemistry. 1993;32:11977–11984. doi: 10.1021/bi00096a006. [DOI] [PubMed] [Google Scholar]
- (232).Pedersen LC, Benning MM, Holden HM. Structural Investigation of the Antibiotic and ATP-Binding Sites in Kanamycin Nucleotidyltrasnferase. Biochemistry. 1995;34:13305–13311. doi: 10.1021/bi00041a005. [DOI] [PubMed] [Google Scholar]
- (233).Hon WC, McKay GA, Thompson PR, Sweet RM, Yang DS, Wright GD, Berghuis AM. Structure of an Enzyme Required for Aminoglycoside Antibiotic Resistance Reveals Homology to Eukaryotic Protein Kinases. Cell. 1997;89:887–895. doi: 10.1016/s0092-8674(00)80274-3. [DOI] [PubMed] [Google Scholar]
- (234).Wolf E, Vassilev A, Makino Y, Sali A, Nakatani Y, Burley SK. Crystal Structure of a GCN5-Related N-acetyltransferase: Serratia marcescens Aminoglycoside 3-N-acetyltransferase. Cell. 1998;94:439–449. doi: 10.1016/s0092-8674(00)81585-8. [DOI] [PubMed] [Google Scholar]
- (235).Wybenga-Groot L, Draker K.-a., Wright GD, Berghuis AM. Crystal Structure of an Aminoglycoside 6’-N-acetyltransferase: Defining the GCN5-Related N-acetyltransferase Superfamily Fold. Structure. 1999;7:497–507. doi: 10.1016/s0969-2126(99)80066-5. [DOI] [PubMed] [Google Scholar]
- (236).Wright GD, Ladak P. Overexpression and Characterization of the Chromosomal Aminoglycoside 6’-N-acetyltransferase from Enterococcus faecium. Antimicrob. Agents Chemother. 1997;41:956–960. doi: 10.1128/aac.41.5.956. [DOI] [PMC free article] [PubMed] [Google Scholar]
- (237).DiGiammarino EL, Draker K.-a., Wright GD, Serpersu EH. Solution Studies of Isepamicin and Conformational Comparisons Between Isepamicin and Butirosin A when Bound to an Aminoglycoside 6’-N-acetyltrasferase Determined by NMR Spectroscopy. Biochemistry. 1998;37:3638–3644. doi: 10.1021/bi972778b. [DOI] [PubMed] [Google Scholar]
- (238).Burk DL, Xiong B, Breitbach C, Berghuis AM. Structures of Aminoglycoside Acetyltransferase AAC(6’)-Ii in a Novel Crystal Form: Structural and Normal-Mode Analyses. Acta Cryst. Sect. D. 2005;61:1273–1279. doi: 10.1107/S0907444905021487. [DOI] [PubMed] [Google Scholar]
- (239).Draker K.-a., Northrop DB, Wright GD. Kinetic Mechanism of the GCN5-Related Chromosomal Aminoglycoside Acetyltransferase AAC(6’)-Ii from Enterococcus faecium: Evidence of Dimer Subunit Cooperativity. Biochemistry. 2003;42:6565–6574. doi: 10.1021/bi034148h. [DOI] [PubMed] [Google Scholar]
- (240).Vetting MW, de Carvalho LP, Yu M, Hegde SS, Magnet S, Roderick SL, Blanchard JS. Structure and Functions of the GNAT Superfamily of Acetyltransferases. Arch. Biochem. Biophys. 2005;433:212–226. doi: 10.1016/j.abb.2004.09.003. [DOI] [PubMed] [Google Scholar]
- (241).Freiburger LA, Auclair K, Mittermaier AK. Elucidating Protein Binding Mechanisms by Variable-c ITC. ChemBioChem. 2009;10:2871–2873. doi: 10.1002/cbic.200900614. [DOI] [PMC free article] [PubMed] [Google Scholar]
- (242).Gao F, Yan X, Baettig O, Berghuis AM, Auclair K. Regio- and Chemoselective 6’-N-Derivitization of Aminoglycosides: Bisubstrate Inhibitors as Probes to Study Aminoglycoside 6’-N-Acetyltransferases. Angew. Chem. Int. Ed. 2005;44:6859–6862. doi: 10.1002/anie.200501399. [DOI] [PubMed] [Google Scholar]
- (243).Duke TAJ, Le Novere N, Bray D. Conformational Spread in a Ring of Proteins: A Stochastic Approach to Allostery. J. Mol. Biol. 2001;308:541–553. doi: 10.1006/jmbi.2001.4610. [DOI] [PubMed] [Google Scholar]
- (244).Motlagh HN, Li J, Thompson EB, Hilser VJ. Interplay Between Allostery and Intrinsic Disorder in an Ensemble. Biochem. Soc. Trans. 2012;40:975–980. doi: 10.1042/BST20120163. [DOI] [PMC free article] [PubMed] [Google Scholar]
- (245).Freiburger LA, Baettig O, Sprules T, Berghuis AM, Auclair K, Mittermaier AK. Competing Allosteric Mechanisms Modulate Substrate Binding in a Dimeric Enzyme. Nat. Struct. Mol. Biol. 2011;18:288–294. doi: 10.1038/nsmb.1978. [DOI] [PMC free article] [PubMed] [Google Scholar]
- (246).Freiburger LA, Miletti T, Zhu S, Baettig O, Berghuis AM, Auclair K, Mittermaier AK. Substrate-Dependent Switching of the Allosteric Binding Mechanism of a Dimeric Enzyme. Nat. Chem. Biol. 2014;10:937–942. doi: 10.1038/nchembio.1626. [DOI] [PubMed] [Google Scholar]
- (247).Burk DL, Ghuman N, Wybenga-Groot L, Berghuis AM. X-ray Structure of the AAC(6’)-Ii Antibiotic Resistance Enzyme at 1.8 Å Resolution; Examination of Oligomeric Arrangements in GNAT Superfamily Members. Protein Sci. 2003;12:426–437. doi: 10.1110/ps.0233503. [DOI] [PMC free article] [PubMed] [Google Scholar]
- (248).Robertson AD, Murphy KP. Protein Structure and the Energetics of Protein Stability. Chem. Rev. 1997;97:1251–1268. doi: 10.1021/cr960383c. [DOI] [PubMed] [Google Scholar]
- (249).Gill SJ, Robert CH, Coletta M, Dicera E, Brunori M. Cooperative Free-Energies for Nested Allosteric Models as Applied to Human-Hemoglobin. Biophys. J. 1986;50:747–752. doi: 10.1016/S0006-3495(86)83514-7. [DOI] [PMC free article] [PubMed] [Google Scholar]
- (250).Ferre T, Riu E, Bosch F, Valera A. Evidence from Transgenic Mice that Glucokinase is Rate Limiting for Glucose Utilization in the Liver. FASEB J. 1996;10:1213–1218. doi: 10.1096/fasebj.10.10.8751724. [DOI] [PubMed] [Google Scholar]
- (251).Meglasson MD, Matschinsky FM. New Perspectives in Pancreatic Islet Glucokinase. Am. J. Physiol. Endocrinol. Metab. 1984;246:647–652. doi: 10.1152/ajpendo.1984.246.1.E1. [DOI] [PubMed] [Google Scholar]
- (252).Matschinsky FM. Glucokinase as Glucose Sensor and Metabolic Signal Generator in Pancreatic β-Cells and Hepatocytes. Diabetes. 1990;39:647–652. doi: 10.2337/diab.39.6.647. [DOI] [PubMed] [Google Scholar]
- (253).Vionnet N, Stoffel M, Takeda J, Yasuda J, Bell GI, Zouali H, Lesage S, Velho G, Iris F, Passa PH, Froguel PH, Cohen D. Nonsense Mutation in the Glucokinase Gene Causes Early-Onset Non-Insulin-Dependent Diabetes Mellitus. Nature. 1992;356:721–722. doi: 10.1038/356721a0. [DOI] [PubMed] [Google Scholar]
- (254).Glaser B, Kesavan P, Heyman M, Davis E, Cuesta A, Buchs A, Stanley CA, Thornton PS, Permutt MA, Matschinsky FM, Herold KC. Familial Hyperinsulinism Caused by an Activating Glucokinase Mutation. N. Engl. J. Med. 1998;338:226–230. doi: 10.1056/NEJM199801223380404. [DOI] [PubMed] [Google Scholar]
- (255).Grimsby J, Sarabu R, Corbett WL, Haynes NE, Bizzaro FT, Coffey JW, Guertin KR, Hilliard DW, Kester RF, Mahaney PE, Marcus L, Qi L, Spence CL, Tengi J, Magnusson MA, Chu CA, Dvorozniak MT, Matschinsky FM, Grippo JF. Allosteric Activators of Glucokinase: Potential Role in Diabetes Therapy. Science. 2003;301:370–373. doi: 10.1126/science.1084073. [DOI] [PubMed] [Google Scholar]
- (256).Matschinsky FM. Assessing the Potential of Glucokinase Activators in Diabetes Therapy. Nat. Rev. Drug Discov. 2009;8:399–416. doi: 10.1038/nrd2850. [DOI] [PubMed] [Google Scholar]
- (257).Tinto N, Zagari A, Capuano M, De Simone A, Capobianco V, Daniele G, Giugliano M, Spadaro R, Franzese A, Sacchetti L. Glucokinase Gene Mutations: Structural and Genotype-Phenotype Analyses in MODY Children from South Italy. PLoS One. 2008;3:e1870–e1877. doi: 10.1371/journal.pone.0001870. [DOI] [PMC free article] [PubMed] [Google Scholar]
- (258).Wyman J. Allosteric Effects in Hemoglobin. Cold Spring Harb. Symp. Quant. Biol. 1963;28:483–489. [Google Scholar]
- (259).Kantrowitz ER, Lipscomb WN. Escherichia coli Aspartate Transcarbamoylase: The Relation Between Structure and Function. Science. 1988;241:669–674. doi: 10.1126/science.3041592. [DOI] [PubMed] [Google Scholar]
- (260).Sener A, Malaisse WJ. Kinetics and Specificity of Human β-Cell Glucokinase: Relevance to Hexose-Induced Insulin Release. Biochim. Biophys. Acta. 1996;1312:73–78. doi: 10.1016/0167-4889(96)00010-9. [DOI] [PubMed] [Google Scholar]
- (261).Larion M, Miller BG. Homotropic Allosteric Regulation in Monomeric Mammalian Glucokinase. Arch. Biochem. Biophys. 2012;519:103–111. doi: 10.1016/j.abb.2011.11.007. [DOI] [PMC free article] [PubMed] [Google Scholar]
- (262).Porter CM, Miller BG. Cooperativity in Monomeric Enzymes with Single Ligand-Binding Sites. Bioorg. Chem. 2012;43:44–50. doi: 10.1016/j.bioorg.2011.11.001. [DOI] [PMC free article] [PubMed] [Google Scholar]
- (263).Kamata K, Mitsuya M, Nishimura T, Eiki J, Nagata Y. Structural Basis for Allosteric Regulation of the Monomeric Allosteric Enzyme Human Glucokinase. Structure. 2004;12:429–438. doi: 10.1016/j.str.2004.02.005. [DOI] [PubMed] [Google Scholar]
- (264).Huang M, Lu S, Shi T, Zhao Y, Chen Y, Li X, Liu X, Huang Z, Zhang J. Conformational Transition Pathway in the Activation Process of Allosteric Glucokinase. PLOS One. 2013;8:e55857–e55867. doi: 10.1371/journal.pone.0055857. [DOI] [PMC free article] [PubMed] [Google Scholar]
- (265).Wilson JE. Hexokinases. Rev. Biochem. Pharmacol. 1995;126:65–198. doi: 10.1007/BFb0049776. [DOI] [PubMed] [Google Scholar]
- (266).Larion M, Salinas RK, Bruschweiler-Li L, Bruschweiler R, Miller BG. Direct Evidence of Conformational Heterogeneity in Human Pancreatic Glucokinase from High-Resolution Nuclear Magnetic Resonance. Biochemistry. 2010;49:7969–7971. doi: 10.1021/bi101098f. [DOI] [PMC free article] [PubMed] [Google Scholar]
- (267).Larion M, Salinas RK, Bruschweiler-Li L, Miller BG, Bruschweiler R. Order-Disorder Transitions Govern Kinetic Cooperativity and Allostery of Monomeric Human Glucokinase. PLoS Biol. 2012;10:1–9. doi: 10.1371/journal.pbio.1001452. [DOI] [PMC free article] [PubMed] [Google Scholar]
- (268).Larion M, Hansen AL, Zhang F, Bruschweiler-Li L, Tugarinov V, Miller BG, Bruschweiler R. Kinetic Cooperativity in Human Pancreatic Glucokinase Originates from Millisecond Dynamics of the Small Domain. Angew. Chem. Int. Ed. 2015;54:1–5. doi: 10.1002/anie.201501204. [DOI] [PMC free article] [PubMed] [Google Scholar]
- (269).Rodriguez-Mias RA, Pellecchia M. Use of Selective Trp Side Chain Labeling to Characterize Protein-Protein and Protein-Ligand Interactions by NMR Spectroscopy. J. Am. Chem. Soc. 2003;125:2892–2893. doi: 10.1021/ja029221q. [DOI] [PubMed] [Google Scholar]
- (270).Lin S-X, Neet KE. Demonstration of a Slow Conformational Change in Liver Glucokinase by Fluorescence Spectroscopy. J. Biol. Chem. 1990;17:9670–9675. [PubMed] [Google Scholar]
- (271).Heredia VV, Thomson J, Nettleton D, Sun S. Glucose-Induced Conformational Changes in Glucokinase Mediate Allosteric Regulation: Transient Kinetic Analysis. Biochemistry. 2006;45:7553–7562. doi: 10.1021/bi060253q. [DOI] [PubMed] [Google Scholar]
- (272).Ainsle GRJ, Shill JP, Neet KE. Transients and Cooperativity. A Slow Transition Model for Relating Transients and Cooperative Kinetics of Enzymes. J. Biol. Chem. 1972;247:7088–7096. [PubMed] [Google Scholar]
- (273).Richard J, Meunier J-C, Buc J. Regulatory Behavior of Monomeric Enzymes. 1. The Mnemonical Enzyme Concep. Eur. J. Biochem. 1974;49:195–208. doi: 10.1111/j.1432-1033.1974.tb03825.x. [DOI] [PubMed] [Google Scholar]
- (274).Liu S, Ammirati MJ, Song X, Knafels JD, Zhang J, Greasley SE, Pfefferkorn JA, Qiu X. Insights into the Mechanism of Glucokinase Activation: Observation of Multiple Distinct Protein Conformations. J. Biol. Chem. 2012;287:13598–13610. doi: 10.1074/jbc.M111.274126. [DOI] [PMC free article] [PubMed] [Google Scholar]
- (275).Zelent B, Buettger C, Grimsby J, Sarabu R, Vanderkooi JM, Wand AJ, Matschinsky FM. Thermal Stability of Glucokinase (GK) as Influenced by the Substrate Glucose, an Allosteric Glucokinase Activator Drug (GKA) and the Osmolytes Glycerol and Urea. Biochim. Biophys. Acta. 2012;1824:769–784. doi: 10.1016/j.bbapap.2012.03.003. [DOI] [PMC free article] [PubMed] [Google Scholar]
- (276).Gloyn AL. Glucokinase (GCK) Mutations in Hyper- and Hypoglycemia: Maturity-Onset Diabetes of the Young, Permanent Neonatal Diabetes, and Hyperinsulinemia of Infancy. Hum. Mutat. 2003;22:353–362. doi: 10.1002/humu.10277. [DOI] [PubMed] [Google Scholar]
- (277).Osbak KK, Colclough K, Saint-Martin C, Beer NL, Bellanne-Chantelot C, Ellard S, Gloyn AL. Update on Mutations of Glucokinase (GCK) Which Cause Maturity-Onset Diabetes of the Young, Permanent Neonatal Diabetes, and Hyperinsulinemic Hypoglycemia. Hum. Mutat. 2009;30:1512–1526. doi: 10.1002/humu.21110. [DOI] [PubMed] [Google Scholar]
- (278).Larion M, Miller BG. 23-Residue C-Terminal α-Helix Governs Kinetic Cooperativity in Monomeric Human Glucokinase. Biochemistry. 2009;48:6157–6165. doi: 10.1021/bi9007534. [DOI] [PubMed] [Google Scholar]
- (279).Pilkis SJ, Weber IT, Harrison RW, Bell GI. Glucokinase: Structural Analysis of a Protein Involved in Susceptibility to Diabetes. J. Biol. Chem. 1994;269:1925–1928. [PubMed] [Google Scholar]
- (280).Gloyn AL, Odili S, Zelent D, Buettger C, Castleden HAJ, Steele AM, Stride A, Shiota C, Magnusson MA, Lorini R, d'Annunzio G, Stanley CA, Kwagh J, van Schaftigen E, Veiga-da-Cunha M, Barbetti F, Dunten P, Han Y, Grimsby J, Taub R, Ellard S, Hattersley AT, Matschinsky FM. Insights into the Structure and Regulation of Glucokinase from a Novel Mutation (V62M), Which Causes Maturity-Onset Diabetes of the Young. J. Biol. Chem. 2005;280:14105–14113. doi: 10.1074/jbc.M413146200. [DOI] [PubMed] [Google Scholar]
- (281).Vallurupalli P, Bouvignies G, Kay LE. Studying “Invisible” Excited Protein States in Slow Exchange with a Major State Conformation. J. Am. Chem. Soc. 2012;134:8148–8161. doi: 10.1021/ja3001419. [DOI] [PubMed] [Google Scholar]
- (282).Capuano M, Garcia-Herrero CM, Tinto N, Carluccio C, Capobianco V, Coto I, Cola A, Iafusco D, Franzese A, Zagari A, et al. Glucokinase (GCK) Mutations and their Characterization in MODY2 Children of Southern Italy. PLOS One. 2012;7:e38906–e38914. doi: 10.1371/journal.pone.0038906. [DOI] [PMC free article] [PubMed] [Google Scholar]
- (283).Antoine M, Boutin JA, Ferry G. Binding Kinetics of Glucose and Allosteric Activators to Human Glucokinase Reveal Mutltiple Conformational States. Biochemistry. 2009;48:5466–5482. doi: 10.1021/bi900374c. [DOI] [PubMed] [Google Scholar]
- (284).Larion M, Miller BG. Global Fit Analysis of Glucose Binding Curves Reveals a Minimal Model for Kinetic Cooperativity in Human Glucokinase. Biochemistry. 2010;49:8902–8911. doi: 10.1021/bi1008672. [DOI] [PMC free article] [PubMed] [Google Scholar]
- (285).Frieden C. Kinetic Aspects of Regulation of Metabolic Processes. The Hysteretic Enzyme Concept. J. Biol. Chem. 1970;245:5788–5799. [PubMed] [Google Scholar]
- (286).Bogatyreva NS, Osypov AA, Ivankov DN. KineticDB: A Database of Protein Folding Kinetics. Nucl. Acids Res. 2009;37:D342–D346. doi: 10.1093/nar/gkn696. [DOI] [PMC free article] [PubMed] [Google Scholar]
- (287).Cohen P. The Role of Protein Phosphorylation in Human Health and Disease. Eur. J. Biochem. 2001;268:5001–5010. doi: 10.1046/j.0014-2956.2001.02473.x. [DOI] [PubMed] [Google Scholar]
- (288).Cohen P. The Development and Therapeutic Potential of Protein Kinase Inhibitors. Curr. Opin. Chem. Biol. 1999;3:459–465. doi: 10.1016/S1367-5931(99)80067-2. [DOI] [PubMed] [Google Scholar]
- (289).Cohen P. Protein Kinases - The Major Drug Targets of the Twenty-First Century? Nat. Rev. Drug Discov. 2002;1:309–315. doi: 10.1038/nrd773. [DOI] [PubMed] [Google Scholar]
- (290).Walsh DA, Perkins JP, Krebs EG. An Adenosine 3',5'-Monophosphate-Dependent Protein Kinase from Rabbity Skeletal Muscle. J. Biol. Chem. 1968;243:3763–3765. [PubMed] [Google Scholar]
- (291).Johnson DA, Akamine P, Radzio-Andzelm E, Madhusudan M, Taylor SS. Dynamics of a cAMP-Dependent Protein Kinase. Chem. Rev. 2001;101:2243–2270. doi: 10.1021/cr000226k. [DOI] [PubMed] [Google Scholar]
- (292).Zheng J, Knighton DR, ten Eyck LF, Karlsson R, Xuong N, Taylor SS, Sowadski JM. Crystal Structure of the Catalytic Subunit of cAMP-Dependent Protein Kinase Complexed with MgATP and Peptide Inhibitor. Biochemistry. 1993;32:2154–2161. doi: 10.1021/bi00060a005. [DOI] [PubMed] [Google Scholar]
- (293).Taylor SS, Yang J, Wu J, Haste NM, Radzio-Andzelm E, Anand G. PKA: A Portrait of Protein Kinase Dynamics. Biochim. Biophys. Acta. 2004;1697:259–269. doi: 10.1016/j.bbapap.2003.11.029. [DOI] [PubMed] [Google Scholar]
- (294).Kornev AP, Taylor SS, ten Eyck LF. A Helix Scaffold for the Assembly of Active Protein Kinases. Proc. Natl. Acad. Sci. USA. 2008;105:14377–14382. doi: 10.1073/pnas.0807988105. [DOI] [PMC free article] [PubMed] [Google Scholar]
- (295).Masterson LR, Cembran A, Shi L, Veglia G. Allostery and Binding Cooperativity of the Catalytic Subunit of Protein Kinase A by NMR Spectroscopy and Molecular Dynamics Simulations. Adv. Prot. Chem. Struct. Biol. 2012;87:363–389. doi: 10.1016/B978-0-12-398312-1.00012-3. [DOI] [PMC free article] [PubMed] [Google Scholar]
- (296).Yang J, Kennedy EJ, Wu J, Deal MS, Pennypacker J, Ghosh G, Taylor SS. Contribution of Non-Catalytic Core Residues to Activity and Regulation in Protein Kinase A. J. Biol. Chem. 2009;284:6241–6248. doi: 10.1074/jbc.M805862200. [DOI] [PMC free article] [PubMed] [Google Scholar]
- (297).Hyeon C, Jennings PA, Adams JA, Onuchic JN. Ligand-Induced Global Transitions in the Catalytic Domain of Protein Kinase A. Proc. Natl. Acad. Sci. USA. 2009;106:3023–3028. doi: 10.1073/pnas.0813266106. [DOI] [PMC free article] [PubMed] [Google Scholar]
- (298).Kornev A, Taylor SS. Defining the Conserved Internal Architecture of a Protein Kinase. Biochim. Biophys. Acta. 2009;1804:440–444. doi: 10.1016/j.bbapap.2009.10.017. [DOI] [PMC free article] [PubMed] [Google Scholar]
- (299).Kornev A, Taylor SS. Protein Kinases: Evolution of a Dynamic Regulatory Protein. Trends Biochem. Sci. 2010;36:65–77. doi: 10.1016/j.tibs.2010.09.006. [DOI] [PMC free article] [PubMed] [Google Scholar]
- (300).Karginov AV, Ding F, Kota P, Dokholyan NV, Hahn KM. Engineered Allosteric Activation of Kinases in Living Cells. Nat. Biotechnol. 2010;28:743–747. doi: 10.1038/nbt.1639. [DOI] [PMC free article] [PubMed] [Google Scholar]
- (301).Gaffarogullari EC, Masterson LR, Metcalfe EE, Traaseth NJ, Balatri E, Musa MM, Mullen D, Distefano MD, Veglia G. A Myristoyl/Phosphoserine Switch Controls cAMP-Dependent Protein Kinase Association to Membranes. J. Mol. Biol. 2011;411:823–836. doi: 10.1016/j.jmb.2011.06.034. [DOI] [PMC free article] [PubMed] [Google Scholar]
- (302).Srivastava AK, McDonald LR, Cembran A, Kim J, Masterson LR, McClendon CL, Taylor SS, Veglia G. Synchronous Opening and Closing Motions are Essential for cAMP-Dependent Protein Kinase A Signaling. Structure. 2014;22:1735–1743. doi: 10.1016/j.str.2014.09.010. [DOI] [PMC free article] [PubMed] [Google Scholar]
- (303).Shan Y, Seeliger MA, Eastwood MP, Frank F, Xu H, Jensen MO, Dror RO, Kuriyan J, Shaw DE. A Conserved Protonation-Dependent Switch Controls Drug Binding in the Abl Kinase. Proc. Natl. Acad. Sci. USA. 2009;106:139–144. doi: 10.1073/pnas.0811223106. [DOI] [PMC free article] [PubMed] [Google Scholar]
- (304).Cembran A, Masterson LR, McClendon CL, Taylor SS, Gao J, Veglia G. Conformational Equilibrium of N-Myristoylated cAMP-Dependent Protein Kinase A by Molecular Dynamics Simulations. Biochemistry. 2012;51 doi: 10.1021/bi301279f. [DOI] [PMC free article] [PubMed] [Google Scholar]
- (305).Tholey A, Pipkorn R, Bossemeyer D, Kinzel V, Reed J. Influence of Myristoylation, Phosphorylation, and Deamidation on the Structural Behavior of the N-terminus of the Catalytic Subunit of cAMP-Dependent Protein Kinase. Biochemistry. 2001;40:225–231. doi: 10.1021/bi0021277. [DOI] [PubMed] [Google Scholar]
- (306).Gangal M, Clifford T, Deich J, Chen X, Taylor SS, Johnson DA. Mobilization of the A-kinase N-myristate Through an Isoform-Specific Intermolecular Switch. Proc. Natl. Acad. Sci. USA. 1999;96:12394–12399. doi: 10.1073/pnas.96.22.12394. [DOI] [PMC free article] [PubMed] [Google Scholar]
- (307).Aimes RT, Hemmer W, Taylor SS. Serine-53 at the Tip of the Glycine-Rich Loop of cAMP-Dependent Protein Kinase: Role in Catalysis, P-site Specificity, and Interaction with Inhibitors. Biochemistry. 2000;39:8325–8332. doi: 10.1021/bi992800w. [DOI] [PubMed] [Google Scholar]
- (308).Moore MJ, Adams JA, Taylor SS. Structural Basis for Peptide Binding in Protein Kinase A. Role of Glutamic Acid 203 and Tyrosine 204 in the Peptide-Positioning Loop. J. Biol. Chem. 2003;278:10613–10618. doi: 10.1074/jbc.M210807200. [DOI] [PubMed] [Google Scholar]
- (309).Yang J, Garrod SM, Deal MS, Anand GS, Woods VL, Jr., Taylor SS. Allosteric Network of cAMP-Protein Kinase Revealed by Mutation of Tyr204 in the P+1 Loop. J. Mol. Biol. 2005;346:191–201. doi: 10.1016/j.jmb.2004.11.030. [DOI] [PubMed] [Google Scholar]
- (310).Iyer GH, Moore MJ, Taylor SS. Consequences of Lysine 72 Mutation on the Phosphorylation and Activation State of cAMP-Dependent Kinase. J. Biol. Chem. 2005;280:8800–8807. doi: 10.1074/jbc.M407586200. [DOI] [PubMed] [Google Scholar]
- (311).Adams JA. Kinetic and Catalytic Mechanims of Protein Kinases. Chem. Rev. 2001;101:2271–2290. doi: 10.1021/cr000230w. [DOI] [PubMed] [Google Scholar]
- (312).Yang J, ten Eyck LF, Xuong NH, Taylor SS. Crystal Structure of a cAMP-Dependent Protein Kinase Mutant at 1.26 A: New Insights into the Catalytic Mechanism. J. Mol. Biol. 2004;336:473–487. doi: 10.1016/j.jmb.2003.11.044. [DOI] [PubMed] [Google Scholar]
- (313).Silva MM, Rogers PH. A Third Quaternary Structure of Human Hemoglobin A at 1.7 Å Resolution. J. Biol. Chem. 1992;26:17248–17255. [PubMed] [Google Scholar]
- (314).Smith FR, Simmons KC. Cyanomet Human Hemoglobin Crystallized Under Physiological Conditions Exhibits the Y Quaternary Structure. Proteins. 1994;18:295–300. doi: 10.1002/prot.340180310. [DOI] [PubMed] [Google Scholar]
- (315).Tame JRH. What is the Structure of Liganded Hemoglobin? Trends Biochem. Sci. 1999;24:372–377. doi: 10.1016/s0968-0004(99)01444-9. [DOI] [PubMed] [Google Scholar]
- (316).Lukin JA, Kontaxis G, Simplaceanu V, Yuan Y, Bax A, Ho C. Quaternary Structure of Hemoglobin in Solution. Proc. Natl. Acad. Sci. USA. 2003;100:517–520. doi: 10.1073/pnas.232715799. [DOI] [PMC free article] [PubMed] [Google Scholar]
- (317).Sanders CR, Schwonek JP. Characterization of Magnetically Orientable Bilayers in Mixtures of Dihexanoylphosphatidylcholine and dimyristoylphosphatidylcholine by Solid-State NMR. Biochemistry. 1992;31:8898–8905. doi: 10.1021/bi00152a029. [DOI] [PubMed] [Google Scholar]
- (318).Lipari G, Szabo A. Model-Free Approach to the Interpretation of Nuclear Magnetic Resonance Relaxation in Macromolecules. 1. Theory and Range of Validity. J. Am. Chem. Soc. 1982;104:4546–4559. [Google Scholar]
- (319).Lipari G, Szabo A. Model-Free Approach to the Interpreatation of Nuclear Magnetic Resonance Relaxation in Macromolecules. 2. Analysis of Experimental Results. J. Am. Chem. Soc. 1982;104:4559–4570. [Google Scholar]
- (320).Song X, Yuan Y, Simplaceanu V, Sahu SC, Ho NT, Ho C. A Comparative NMR Study of the Polypeptide Backbone Dynamics of Hemoglobin in the Deoxy and Carbonmonoxy Forms. Biochemistry. 2007;46:6795–6803. doi: 10.1021/bi602654u. [DOI] [PMC free article] [PubMed] [Google Scholar]
- (321).Xu C, Tobi D, Bahar I. Allosteric Changes in Protein Structure Computed by a Simple Mechanical Model: Hemoglobin T --> R2 Transition. J. Mol. Biol. 2003;333:153–168. doi: 10.1016/j.jmb.2003.08.027. [DOI] [PubMed] [Google Scholar]
- (322).Balakrishnan G, Tsai C-H, Wu Q, Case MA, Pevsner A, McLendon GL, Ho C, Spiro TG. Hemoglobin Site-Mutants Reveal Dynamical Role of Interhelical H-bonds in the Allosteric Pathway: Time-Resolved UV Resonance Raman Evidence for Intra-Dimer Coupling. J. Mol. Biol. 2004;340:857–868. doi: 10.1016/j.jmb.2004.05.013. [DOI] [PubMed] [Google Scholar]
- (323).Baldwin J, Chothia C. Haemoglobin: The Structural Changes Related to Ligand Binding and its Allosteric Mechanism. J. Mol. Biol. 1979;129:175–220. doi: 10.1016/0022-2836(79)90277-8. [DOI] [PubMed] [Google Scholar]