

Abstract
Acute spinal cord injury (SCI) is a devastating condition with many consequences and no known effective treatment. Although it is quite easy to diagnose traumatic SCI, the assessment of injury severity and projection of disease progression or recovery are often challenging, as no consensus biomarkers have been clearly identified. Here rats were subjected to experimental moderate or severe thoracic SCI. At 24h and 7d postinjury, spinal cord segment caudal to injury center versus sham samples was harvested and subjected to differential proteomic analysis. Cationic/anionic-exchange chromatography, followed by 1D polyacrylamide gel electrophoresis, was used to reduce protein complexity. A reverse phase liquid chromatography-tandem mass spectrometry proteomic platform was then utilized to identify proteome changes associated with SCI. Twenty-two and 22 proteins were up-regulated at 24 h and 7 day after SCI, respectively; whereas 19 and 16 proteins are down-regulated at 24 h and 7 day after SCI, respectively, when compared with sham control. A subset of 12 proteins were identified as candidate SCI biomarkers - TF (Transferrin), FASN (Fatty acid synthase), NME1 (Nucleoside diphosphate kinase 1), STMN1 (Stathmin 1), EEF2 (Eukaryotic translation elongation factor 2), CTSD (Cathepsin D), ANXA1 (Annexin A1), ANXA2 (Annexin A2), PGM1 (Phosphoglucomutase 1), PEA15 (Phosphoprotein enriched in astrocytes 15), GOT2 (Glutamic-oxaloacetic transaminase 2), and TPI-1 (Triosephosphate isomerase 1), data are available via ProteomeXchange with identifier PXD003473. In addition, Transferrin, Cathepsin D, and TPI-1 and PEA15 were further verified in rat spinal cord tissue and/or CSF samples after SCI and in human CSF samples from moderate/severe SCI patients. Lastly, a systems biology approach was utilized to determine the critical biochemical pathways and interactome in the pathogenesis of SCI. Thus, SCI candidate biomarkers identified can be used to correlate with disease progression or to identify potential SCI therapeutic targets.
Traumatic spinal cord injury (SCI)1 is an injury resulting from an insult inflicted on the spinal cord. It can lead to the loss of sensory and motor after injury, so it is an important cause of neurologic disability after trauma, such as lifelong paralysis for SCI patients (1, 2). It is estimated that ∼300,000 people in North America are living with a spinal cord injury (SCI), and 12,000 to 20,000 new cases occur annually in the United States (3).
It has been hypothesized that the pathologic process that leads to acute traumatic spinal cord injury consists of two steps; the primary injury is the physical and mechanical damages that occur as a result of direct impact to the spinal cord. The secondary injury is the cascade of biochemical events such as proteolysis of cytoskeletal, membrane, and myelin proteins due to the elevation in intracellular Ca2+ that activates cysteine proteases (e.g. calpain). The proteolysis damages the spinal cord by progressive tissue degeneration, including neuronal cell death, axonal degeneration, and demyelination in the spinal cord (4, 5). Although it is quite easy to diagnose acute traumatic SCI, assessment of injury severity is often challenging. Neurological examinations are currently used for diagnosis, determination of severity, and prediction of neurologic outcome in the brain injury (traumatic brain injury (TBI), Stroke). However, these measures often cannot assess the severity of SCI; in addition, the neurological recovery variability for SCI patients is high. Therefore, the discovery and use of biomarkers for SCI could lead to development of new therapeutic interventions that can be applied to prevent or reduce disability of SCI (6).
A biomarker is defined, according to the National Academy of Sciences, as an indicator that signals events in biological samples or systems. Biomarkers are considered as extremely valuable unbiased tools to define the severity of SCI because they reflect the extent of the spinal cord damage and predict neurologic recovery (7). There are some metabolite candidates such as N-acetyl aspartate (NAA, neuronal/axonal marker) (8), creatine (gliosis marker) (9), and choline (indicator of cellular turnover related to both membrane synthesis and degradation) (10) that can be used as biomarkers for monitoring the pathobiological changes of primary and secondary damage in SCI using proton magnetic resonance spectroscopy (1H-MRS). In vivo 1H-MRS is a valuable tool for noninvasive monitoring of brain biochemistry by quantifying the changes in the metabolites in brain tissue. However, due to the relatively small size of the spinal cord and magnetic susceptibility effects from the surrounding bony structures, the ability to acquire MR spectra with adequate signal -to-noise ratio (SNR) is limited, and this precludes the detection of subtle changes in metabolite levels (11).
Proteomic analysis is a useful technique for simultaneously determining multiple proteins in a biological system; it provides robust methods to study protein abundance, expression patterns, interactions, and subcellular localization in the blood, organelle, cell, tissue, organ or organism that can be studied to provide accurate and comprehensive data about that system (12). Proteomic methods are the most powerful techniques that can aid in the discovery of novel biomarker candidates; it utilizes extensive sample procedure and Data Dependent Acquisition to follow disease-specific proteins (identity and concentration). It facilitates the identification of all differentially expressed proteins at any given time in a proteome and correlates these patterns with the healthy ones during disease progression (13). It has been used to study protein expression at the molecular level with a dynamic perspective that helps to understand the mechanisms of the disease (14). The complexity, immense size and variability of the neuroproteome, extensive protein-protein and protein-lipid interactions, all limit the ability of the mass spectrometer to detect all peptides/proteins contained within the sample; further, some peptides/proteins are extraordinarily resistant to isolation (15, 16). Therefore, the analytical methods for the separation and identification of peptides/proteins must manage all of these issues by using separation techniques combined with the powerful new mass spectrometry technologies to expand the scope of protein identification, quantitation and characterization.
The complexity of the biological sample can be reduced by further separation or fractionation at the protein or peptide level. Multidimensional LC can be used for two or more different types of sequential combinations to improve significantly the resolution power and results in a larger number of proteins to be identified (17). Ion-exchange chromatography (IEC) in the first dimension is very suitable for the separation of proteins and peptides, separating proteins based on their differences in overall charges. IEC's stationary phase is either an anion or a cation exchanger, prepared by immobilization of positively or negatively charged functional groups on the surface of chromatographic media, respectively. Proteins or peptide separation occurs by linear change of the mobile-phase composition (salt concentration or pH) that decreases the interactions of proteins with the stationary phase, resulting in finally eluting the proteins (18). Also, SDS-PAGE can be used for further protein separation by apparent molecular weight with the resolving distance optimized for the proteome of interest. Furthermore, peptides can be separated by their hydrophobicity using a reversed phase C18 column, which can be directly coupled to the electrospray mass spectrometer (ESI-LC-MS/MS). Reversed-phase liquid chromatography (RPLC) is most often used in the second dimension due to its compatibility with the downstream mass spectrometry (sample concentration, desalting properties, and volatile solvents). Proteomics has two approaches: “bottom-up”, which involves direct digestion of a biological sample using a proteolytic enzyme (such as trypsin) that cleaves at well-defined sites to create a complex peptide mixture, followed by analysis of the digested samples on platforms that include liquid chromatography prior to tandem mass spectrometry (LC-MS/MS); and “top-down”, that involves separating intact proteins from complex biological samples using techniques such as liquid chromatography or 2-D gel electrophoresis, followed by differential expression analysis using spectrum analysis or gel imaging platforms. Although top-down analysis preserves protein-protein interactions and does not lose the protein information, it has been limited because of the difficulty in intact protein processing due to the lack of separation methods (only gel based) (19, 20) as well as the challenges of performing mass spectrometry on intact high-molecular weight proteins.
Mass spectrometry (MS) is the most important tool for protein identification and characterization in proteomics due to the high selectivity and sensitivity of the analysis (1, 2, 16). Electrospray ionization (ESI) is considered as an ideal ionization source for protein analysis due to two characteristics: first, the ability to produce multiply charged ions from large molecules (producing ions of lower m/z that are readily separated by mass analyzers such as quadruples and ion traps), and second, the ease of interfacing with chromatographic liquid-phase separation techniques (21). Electrospray ionization followed by tandem mass spectrometry (ESI-MS/MS) is one of the most commonly used approaches for protein identification and sequence analysis (18). Proteomic studies have been conducted to identify biomarkers and assess severity of SCI utilizing traumatic animal SCI models (16, 22–24), but these methods have not been used to identify biomarkers in CSF from patients with traumatic SCI because CSF sampling is challenging (25–27).
Calcium binding protein S100 beta (S100β), glial fibrillary acidic protein (GFAP), myelin basic protein (MBP), neuron specific enolase (NSE), neurofilament protein- H and L (NF-H, NF-L), SBDP150/SBDP145/SBDP120, ubiquitin C-terminal hydrolase-L1 (UCHL-1), microtubule- associated 2 (MAP-2), and cytokines interleukins 6 and 8 (IL-6 and IL-8) have been identified as potential markers of spinal cord damage mainly in the cerebrospinal fluid (CSF) compartment (6, 26–36). These studies need to be developed and validated for their potential use in clinical settings to determine the severity of SCI. However, due to the complexity of spinal cord injury, multiple interventions targeting different complications of damage may be required. Human SCI is a heterogeneous injury with injuries potentially occurring at different spinal cord segments and injury severities. Thus, it is unlikely that a single biomarker can be successfully used to diagnose and determine the severity of SCI patients.
Systems biology (SB) is a new field of science that analyzes the relationships among all the individual components in a biological system (genes, proteins, metabolites etc.) by quantitative description of the interaction among them (37). The goal of this approach is to develop computational models of these systems, therefore the responses of the system to any kind of perturbation; for example, environmental disturbance, genetic mutation etc., can be predicted. Pathway analysis of various biomarker types have been or can be used to revealed association with CNS disorders; including neurodegenerative disorders, stroke, traumatic brain injury (TBI) and spinal cord injury (SCI) (38–40).
In this study, we sough to identify possible new SCI markers by using our CAX-PAGE-LC-MS/MS proteomic platform (41) using SCI biosamples collected from both an SCI animal model (weight-drop) and human clinical studies of SCI patients.
EXPERIMENTAL PROCEDURES
Rat Spinal Cord Injury Model
Adult female Fischer rats (220–250 g) were housed according to the National Institutes of Health and United States Department of Agriculture guidelines. Institutional Animal Care and Use Committee of the University of Miami approved all animal procedures. Prior to surgery, rats were anesthetized (45 mg ketamine/kg, 5 mg xylazine/kg) by intraperitoneal injection. An adequate level of anesthesia was determined by monitoring the corneal reflex and withdrawal to painful stimuli for hind limbs. All animals underwent T9-T10 spinal laminectomy (42, 43). During surgery, rats were placed on a warming pad to maintain body temperature at 37° ± 0.5 °C. Briefly, the rat was placed ventrally on top of a small bit of sterile gauze to evaluate the surgical site presenting an adequate exposure of the back anatomy. A 2 cm longitudinal skin incision was centered over the T9 spinus process along the midline. As previously described, perispinal nerves and ligaments were laterally dissected and retracted followed by removal of bony elements of the posterior spine including the spinus process in lamina using a micro Rongiers. The ninth thoracic spinal segment was then exposed without removing the dura mata by removing the dorsal part of the vertebra. The exposed cord was next contused by a 10 gm weight dropped from a height of either 12.5 mm (moderate), or 25 mm (severe) by using the New York University (NYU)-MASCIS impactor (44). This model and injury severities have been shown to produce well-described pattern of electrophysiological, behavioral and histopathological consequences (45).
Rat SCI-CSF Collection
Following SCI, CSF samples were drawn at 4, 24 or 48 h posttrauma. CSF was collected as previously described (46). At appropriate time points, injured, sham-injured and naïve animals were anesthetized as described above and secured in a stereotactic frame with the head allowed to move freely along the longitudinal axis. The head was flexed so that the external occipital protuberance in the neck was prominent and a dorsal midline incision was made over the cervical vertebrae and occiput. The atlanto-occipital membrane was exposed by blunt dissection and a 25-gauge needle attached to polyethylene tubing was inserted into the cisterna magna. Approximately 0.1 to 0.15 ml of CSF was collected per rat, then they were removed and immediately euthanized by decapitation. CSF samples were centrifuged at 4000 × g for 4 min. at 4 °C to clear any contaminating erythrocytes.
Sample Preparation
SCI and sham control (caudal, rostral and epi-center segments) samples were rapidly snap frozen in liquid nitrogen and homogenized to fine powder using a small mortar and pestle set over a dry ice. The powder was scraped into chilled microfuge tubes, then lysed with 1% Triton X-100 lysis buffer containing 20 mm Tris HCl pH 7.4, 150 mm sodium chloride (NaCl), 5 mm ethylenediaminetetraacetic acid (EDTA), 5 mm ethylene glycol bis(aminoethyl ether) tetraacetic acid (EGTA), 10 μl 1 m dithiothreitol (DTT), 100 μl of phosphatase inhibitors (all from Sigma-Aldrich), with a complete mini protease inhibitor mixture tablet (Roche Biochemicals). Lysis was conducted for 3 h at 4 °C with hourly vortexing. Lysates were then centrifuged to remove DNA, lipids, and particulates at 15,000 × g for 10 min at 4 °C. The supernatant was collected and protein content was determined using a DC Protein Assay (BioRad) then, the protein concentration was standardized to 1 μg/μl for immunoblotting analysis. Pooled 1-mg SCI and control rostral segment samples (n = 5) were prepared for differential analysis using CAX-PAGE.
Human Spinal Cord Injury Subject Enrollment and Biosample Collection
Spinal cord injury subjects (SCI) classified as moderate-severe (AIS Grades A, B & C) (n = 15) were recruited at the University of Miami Hospital for this SCI biomarker study. This human SCI study is considered discovery stage and the candidate biomarkers are at exploratory/discovery stage. The University of Miami Institutional Review Board approved all human SCI studies (IRB#20090655). In this discovery stage study, fifteen consented moderate-severe SCI subjects were continuously enrolled during the period from August 2010 to September 2014. Patients were classified according to the American Spinal Injury Association scale (AIS) of impairment (degree of impairment) and AIS on discharge (improvement), urodynamic test (bladder control), somatosensory evoked potential test, and magnetic resonance (MRI) scan. The patients were further classified as traumatic paraplegia or traumatic quadriplegia. (See supplemental Table S1). SCI patients with confirmed moderate-severe SCI (AIS Grades A, B, and C) are included. Subjects with pre-existing neurological or neuropsychiatric conditions were excluded. Of the 15 SCI patients, 13 are male and 2 were female with an average of 38.5-year-old (range 19 to 67).
For CSF collection, we followed the NIH/NINDS common data elements (CDE) for traumatic brain injury (https://commondataelements.ninds.nih.gov/tbi.aspx) under the section ”TBI Biospecimen Collection Protocol”, since biosample collection CDE has not been formally established for SCI. Briefly, strict aseptic techniques were conducted when a lumbar puncture was performed at L2–3 or L3–4 and an intrathecal catheter inserted for intrathecal drainage of CSF. Timed CSF samples were diverted to glass tubes (no preservative, heparin or EDTA) for the specified vol. (3 cc), spun at 4000 RPM at room temperature (to remove loose cells and debris). Aliquots of 500 μl of cleared CSF (supernatant) were placed into 1.2 ml cryovials and stored at –80 °C in an ultralow temperature freezer until used. In this study, CSF samples were collected within every 6 h postinjury up to 6 days, whenever feasible.
In parallel, normal control CSF samples (n = 20; 14 male, 6 female, average age 42.0) were obtained from a commercial source (Bioreclamation Inc., Westbury, NY).
Gel Electrophoresis and Electrotransfer
2× Laemmli sample buffer containing 65.8 mm Tris (pH 6.8), 0.1 mm DTT, 2% SDS, 0.01% bromphenol blue and 10% glycerol in distilled water was used for processing the control and SCI injured samples. Twenty (20) microgram of protein from each sample was centrifuged for 1 min at 10,000 g and then resolved by SDS-PAGE on 4–20% or 10–20% Tris/glycine gels (Invitrogen Life Technologies, Carlsbad, CA) at 200 V for 60 min at room temperature. The fractionated proteins were transferred to a polyvinylidene difluoride (PVDF) membrane (Invitrogen) by electroblotting using the iBlot Gel Transfer Device (Invitrogen) for 7 mins. Following the transfer, the membranes were blocked in 5% nonfat dry milk in TBST (20 mm Tris-HCl, 150 mm NaCl and 0.003% Tween-20, pH 7.5) for an hour.
Immunoblotting Analysis and Antibodies
Immunoblotting membranes containing tissue protein were incubated with the primary antibody overnight at 4 °C with shaking. Monoclonal anti-mouse α-spectrin (Enzo Life Sciences NY, Farmingdale, NY), polyclonal anti-rabbit GFAP (Abcam, MA, Cambridge, MA), and monoclonal anti- mouse UCHL-1 (EMD Millipore, MA, Billerica, MA) were used at a dilution of 1:1000 in 5% milk. Polyclonal anti-rabbit transferrin (Abcam), polyclonal anti-goat cathepsin D (Santa Cruz Biotechnology, Dallas, TX), polyclonal anti-rabbit triosephosphate isomerase-1 (TPI-1, TIM) (Santa Cruz Biotechnology), and polyclonal anti-rabbit astrocytic phosphoprotein (PEA-15) (Cell Signaling, Danvers, MA) were used at a dilution of 1:500, 1:200, and 1:1000, respectively in 5% milk. On the following day, the membranes were washed three times with TBST and probed with an alkaline phosphatase-conjugate goat secondary antibody (EMD Millipore) at a dilution of 1:5000 in 5% milk for an hour, followed by TBST washing. Immunoreactivity was detected using 5-bromo-4-chloro-3-indolylphosphate (BCIP)/nitroblue tetrazolium phosphatase substrate (Kirkegaard & Perry Laboratories, Gaithersburg, MD). For all spinal cord tissue Western blots data, we have included probing a house keeping protein polyclonal anti-carbonic anhydrase-II (Abcam) at dilution of 1:2000 in 5% milk as a loading control. Since its lane-to-lane intensity variability is less than 20%, it was not necessary to convert the target protein densitometric level as standardized relative levels over carbonic anhydrase-II.
CSF (like serum and plasma) is considered a biofluid, often when biomarkers are measured in biofluids, they are expressed as a concentration unit i.e. per volume unit of a biofluid, e.g. in pg/ml or ng/ml), rather than standardized over same amount of total protein concentration. Thus, following this convention, our biomarker levels were not standardized over the total protein concentration of the sample. Lastly, CSF protein concentrations also tend to change after brain injury - thus our CSF protein biomarker levels are measured in 10 μl of CSF sample.
Anion/Cation-Exchange Chromatography
The CAX chromatography was performed on a BioRad Biologic DuoFlow system (Fig. 2) with sulfoproyl SCX (S1) and quaternary ammonium SAX (Q1) modified Sepharose pre-packed ion-exchange columns (BioRad) that were placed in series, and connected in tandem along with a QuadTec UV detector and BioFrac fraction collector. Buffers consisted of 20 mm Tris-HCl (pH 7.5 molecular biology grade, Fisher Scientific) in double distilled water (mobile phase A) and 20 mm Tris-HCl with 1 m NaCl (Fisher Scientific, crystalline 99.8% certified) in double distilled water (mobile phase B). Samples of 1 mg proteins from pooled spinal cord tissue lysates were injected with an optimized method for differential analysis. The first and second linear gradient steps were from 0 to 5% B, and 5 to 10% in 5 ml each at a flow rate of 1 ml/min, and followed by a six-step gradient, each step increased by 5% from 10 to 40% in 1 ml, the last gradient step was from 40 to 50% in 1 ml. Then, the composition was held at 50% B for 1 ml and re-equilibrated to 0% B in 3 ml. The UV chromatograms were monitored at a wavelength of 280 and 214 nm for each run. Forty-four 1-ml fractions were autonomously collected via the BioFrac fraction collector into 1.5-ml screw-cap microfuge tubes kept on ice.
Fig. 2.

Comparison of differential SCI protein identification for 24 h and 7 day post-SCI versus sham. Shown are the number of identified proteins using CAX-PAGE-LC-MS/MS platform along with common proteins between 24 h and 7 days (A) up-regulated (B) down-regulated.
1D-SDS-PAGE
Fractions collected throughout CAX chromatography were concentrated using Millipore centrifugal ultrafiltration units (Millipore Corporation) which have a retaining power for proteins of >3kDa. Each ultrafiltration unit was treated with 500 μl of 1% SDS (passivation for improved recovery) and soaked for three hours at room temperature, and then all the device units were rinsed with tap water followed by distilled water and spun at 15,000 rpm for 20 min twice. The collected fractions (0.5 ml) were added to the ultrafiltration units and spun at 15,000 rpm for 50 min at 4 °C. 2× Laemmli buffer (containing 65.8 mm Tris (pH 6.8), 0.1 mm DTT, 2% SDS, 0.01% bromphenol blue and 20% glycerol in distilled water) was added (20 μl) for each unit and boiled for few seconds prior to collection by centrifugation at 1000 g for 3 min. The protein fractions were run side-by-side (i.e. sham next to SCI 6h & SCI 24h), by loading 20 μl of each fraction onto a Criterion TGX Any kDa gels (BioRad), 1 mm wide, for 20 min at 300V in a Tris-glycine buffer.
Gel Band Visualization and Quantification
The gels were visualized with Coomassie blue stain (BioRad) for differential band analysis. Scanning of the gel and membrane bands was performed using an Epson Expression 8836XL high-resolution flatbed scanner (Epson). UN-SCAN-IT software (version 6.1, Silk Scientific Corporation) was used for quantitative densitometric analysis of selected gel or membrane bands based on their relative intensities. Fold increase or decrease between differential bands was computed by dividing the greater value by the lesser value with a positive sign and negative sign to indicate an increase or decrease after SCI injury. Differential bands were boxed and labeled according to their 2D-position. Gel band intensity was quantified by NIH ImageJ software.
In-Gel Digestion of Proteins
Gels were thoroughly rinsed twice with Optima LC-MS grade water. Differential bands were excised, cut into pieces, placed in 1.5 ml low retention Eppendorf tubes, and washed with 100 μl Optima LC-MS H2O. The gel bands were washed again by 50% 100 mm ammonium bicarbonate (Fisher)/50% acetonitrile (Burdick-Jackson, Optima LC-MS grade). Bands were dehydrated with 100% acetonitrile and dried by Speedvac (Labcoco), and then they were rehydrated with 50 μl of 10 mm dithiothreitol, DTT (Thermo) in 50 mm ammonium bicarbonate and incubated for 30 min at 56 °C. DTT was replaced by 50 μl of 55 mm iodoacetamide (Amersham Biosciences) in 50 mm ammonium bicarbonate and reacted for 30 min in the dark at room temperature for alkylation. Gel pieces were washed with 50 mm ammonium bicarbonate followed by 100% acetonitrile dehydration and dried by Speedvac. For protein digestion, gel pieces were rehydrated with 15 μl of 12.5 ng/μl trypsin solution (Promega Gold) for 30 min at 4 °C, and then 20 μl of 50 mm ammonium bicarbonate was added and incubated overnight at 37 °C. The hydrophobic peptide extraction was performed with 50% acetonitrile/50% water with 0.1% formic acid. The peptide extract was dried by Speedvac and resuspended in 20 μl Optima LC-MS grade H2O with 0.1% formic acid after sonication for 15 min and centrifuged at 1500 rpm. Trypsinized band extracts were analyzed by nanospray reversed-phase liquid chromatography and tandem mass spectrometry.
Reversed-Phase Liquid Chromatography Tandem Mass Spectrometry (RPLC-MS/MS)
Nano-reversed-phase liquid chromatography tandem mass spectrometry was employed for protein separation and identification. Nanoflow was performed on a NanoAcquity UPLC (Waters, Milford); the autosampler was used to load two microliters of each sample onto a 5 μm particle size Symmetry 180 μm × 20 mm C18 trapping column at 4 μl/min for 10 min. Then, the sample plug was loaded onto a 1.7 μm particle size BEH130 C18 100 μm × 100 mm analytical column at 300 nL/min. The mobile phase consisted of solvent A (water with 0.1% formic acid) and solvent B (acetonitrile with 0.1% formic acid). Separation was achieved within a run time of 115 min at a flow rate of 300 nL/min. The first linear gradient was from 1% to 40% B over 90 min, the second linear gradient was from 40% to 100% B over 5 min and held for 5 min before returning to initial mobile-phase composition (1%B). Tandem mass spectra were collected on LTQ-XL (Thermo, San Jose, CA) using a Data Dependent Acquisition method in Xcalibur 2.0.7 (Thermo), in which data dependent scanning was specified as a criteria to select the top 10 most abundant ions using 11 separate scan events at a given chromatographic time point (115 min) for subsequent analysis. The mass spectrometer was set to perform a full-scan and subsequently MS/MS scans on the ten most intense ions in the full-scan spectrum MS (scan event 1) with Dynamic Exclusion enabled. Dynamic Exclusion temporarily puts a mass into an exclusion list after its MS/MS spectrum is acquired, providing the opportunity to collect MS/MS information on the second most intense ion from the full-scan spectrum MS (scan event 1). All MS/MS spectra were analyzed using Proteome Discoverer 1.3 (Thermo). SEQUEST (version: 1.3.0.339) and X! Tandem (version: CYCLONE (2010.12.01.1)). Database search engines were set up to search a trypsin-Indexed uniprot-Rattus+norvegicus.fasta (unknown version, 35126 entries). The search was achieved using the average mass for matching the precursor with a fragment ion mass tolerance of 0.8 Da and a parent ion tolerance of 2.00 Da and a maximum of two missed cleavage sites. Carbamidomethylation of cysteine was selected as a static modification, whereas the oxidation of methionine was selected as a dynamic modification. Using the output from SEQUEST and X! Tandem, Scaffold (version: Scaffold_3.3.3, Proteome Software) was used to validate, organize, and interpret mass spectrometry data. Peptide identifications were accepted if they could be established at greater than 95.0% probability as specified by the Peptide Prophet algorithm (38). Protein identifications were accepted if they could be established at greater than 99.9% probability and contained at least 2 identified peptides. The mass spectrometry proteomics data have been deposited to the ProteomeXchange Consortium via the PRIDE (47) partner repository with the dataset identifier PXD003473 and 10.6019/PXD003473.
Systems Biology Tools
Pathway Studio software 9.0 (Ariadne Genomics Inc. MD) and STRING (http://string-db.org/) were employed to identify significant pathways across individual samples as a signature to predict clinical outcomes. Twelve SCI candidate biomarkers (Table III) were input separately into Pathway Studio for systems biology analysis. The network was generated using the “Shortest Path” algorithm to map interactions between altered proteins based on a comprehensive database from the relevant scientific literature.
Table III. Spinal cord injury candidate biomarkers.
| Name | Description |
|---|---|
| TF | Transferrin |
| FASN | Fatty acid synthase |
| NME1 | NME/NM23 nucleoside diphosphate kinase 1 |
| STMN1 | Stathmin 1 |
| EEF2 | Eukaryotic translation elongation factor 2 |
| ANXA1 | Annexin A1 |
| CTSD | Cathepsin D |
| ANXA2 | Annexin A2 |
| PGM1 | Phosphoglucomutase 1 |
| PEA15 | Phosphoprotein enriched in astrocytes 15 |
| GOT2 | Glutamic-oxaloacetic transaminase 2, mitochondrial (aspartate aminotransferase 2) |
| TPI-1 | Triosephosphate isomerase 1, TIM |
Experimental Design and Statistical Rationale
Rats to receive severe spinal cord injury, moderate spinal cord injury, sham control, or naïve control were selected randomly. There are total of 10 groups (Naïve, sham 4 h, sham 24 h, sham 7 day, moderate SCI 4 h, moderate SCI 24 h, moderate SCI 7 day, severe SCI 4 h, severe SCI 24h, severe SCI 7d) with n = 5 rat each. Epicenter of impact segment, rostral segment and caudal segment of the spinal cord tissue samples were collected to prepare tissue lysate (n = 5 each), respective rat CSF samples were also collected (n = 5).
For the LC-mass spectrometry, a portion of each rostral tissue lysate sample (n = 5) were pooled for these groups: sham 24 h, severe SCI 24 h, sham 7 day severe SCI 7 day within the same group were pooled to achieve 1 mg sample for the CAX-PAGE and LC-MS/MS as described. For the verification of hits, individual un-pooled samples (n = 5) from rat rostral, caudal, and epicenter segments spinal cord tissue lysates and CSF samples from all 10 groups (Naïve, sham 4 h, sham 24 h, sham 7 day, moderate SCI 4 h, moderate SCI 24 h, moderate SCI 7 day, severe SCI 4 h, severe SCI 24 h, severe SCI 7 day) (n = 5 for all cases) were subjected to Western blot analysis and quantified by densitometry. n = 5 is considered generally acceptable for this type of rodent proteomic and quantitative immunblotting analysis (41). For statistical tests, the main comparison is control (naïve of sham at same time point) to SCI (either severe or moderate). Thus we used unpaired t test, as we have performed previously with a similar traumatic brain injury study (48). Also, we performed severe SCI versus moderate SCI companion by unpaired t test. p value of < 0.05 is considered statistically significant for these comparisons.
For human study, SCI patients were enrolled continuously at University of Miami Hospital when they met the enrollment criteria. A total of n = 15 SCI patients were enrolled for this study, serial CSF samples were collected from first day of injury to up to 6 days from injury every 6 h (maximal 4 samples per day). For human control samples, n = 20 human CSF non-injured controls were randomly selected (Bioreclamation Inc., Westbury, NY) and processed as with human SCI CSF samples. For statistical tests of human samples, the main comparison of quantitative immunoblot data is control CSF versus human CSF - first sample or all CSF samples. Thus we used unpaired t test, as we have performed previously with a similar TBI study (41). p value of < 0.05 is considered statistically significant for these comparisons.
RESULTS
CAX-PAGE Differential Neuroproteomic Analysis
CAX chromatography was employed to fractionate SCI samples and control proteins according to their surface charges followed by 1D gel electrophoresis to separate proteins based on their molecular weight. Pooled spinal cord tissue lysate samples of rostral segment collected from the SCI rat contusion model SCI (severe injury) at 4 h, 24 h, and 7 day time points (n = 5, each) were first subjected to CAX chromatography ion exchange (CAX separation has the ability of retaining both positively and negatively charged proteins). As shown in Fig. 1, there were chromatographic differences with high protein recovery for differential expression profiling of sham and SCI rat lysates (UV chromatograms at a wavelength of 280 nm), which were attributed to the injured spinal cord proteome. Both sham and SCI proteins were distributed into 28 fractions (1 ml) and collected after using tandem CAX columns. Protein fractions were analyzed side-by-side on a 1D-gel for differential comparison, 24 h sham versus 24 h SCI and 7 day sham versus 7 day SCI. Differential bands were boxed and labeled according to their 2D position with number and letter (e.g. the top band excised from the lane of fraction X was labeled XA). ImageJ densitometry software was used for quantification of selected differential gel band intensities to derive the relative fold increase or decrease.
Fig. 1.

CAX-PAGE differential separation of sham and SCI rat lysate (A) Ion exchange (CAX) separation chromatograms overlay of pooled rat SCI (at 24 h and 7 day postsevere injury) and sham at 24 h and 7 day lysate (pooled from n = 5 each) with the same 280 nm absorbance scale: sham in purple and SCI in green, solvent B % in orange, and conductivity in red. B, 1D-PAGE of selected CAX fractions out of 28 collected, run side by side for comparison, selected bands are boxed and labeled according to 2D position. C, Quantification of selected differential gel band intensities to derive the relative -fold increase or decrease using ImageJ densitometry software.
Identification of Differential Proteins by RPLC-MS/MS
Differentially displayed bands were selected from the 1D-gels and cut into pieces for proteomic analysis, then trypsinized. The tryptic peptides were separated by reversed-phase liquid chromatography online with tandem mass spectrometry (RPLC-MS/MS) for protein identification. All MS/MS spectra were analyzed using Proteome Discoverer 1.3 (Thermo), SEQUEST and X! Tandem database search engines have been utilized to search the experimental spectra against a rat-indexed database and validated by Scaffold 3 (0.1% and 0.4% FDR for proteins and peptides, respectively). Based on identified unique peptides, sequence coverage, and molecular weight gel band, the protein biomarker candidates were isolated in each band.
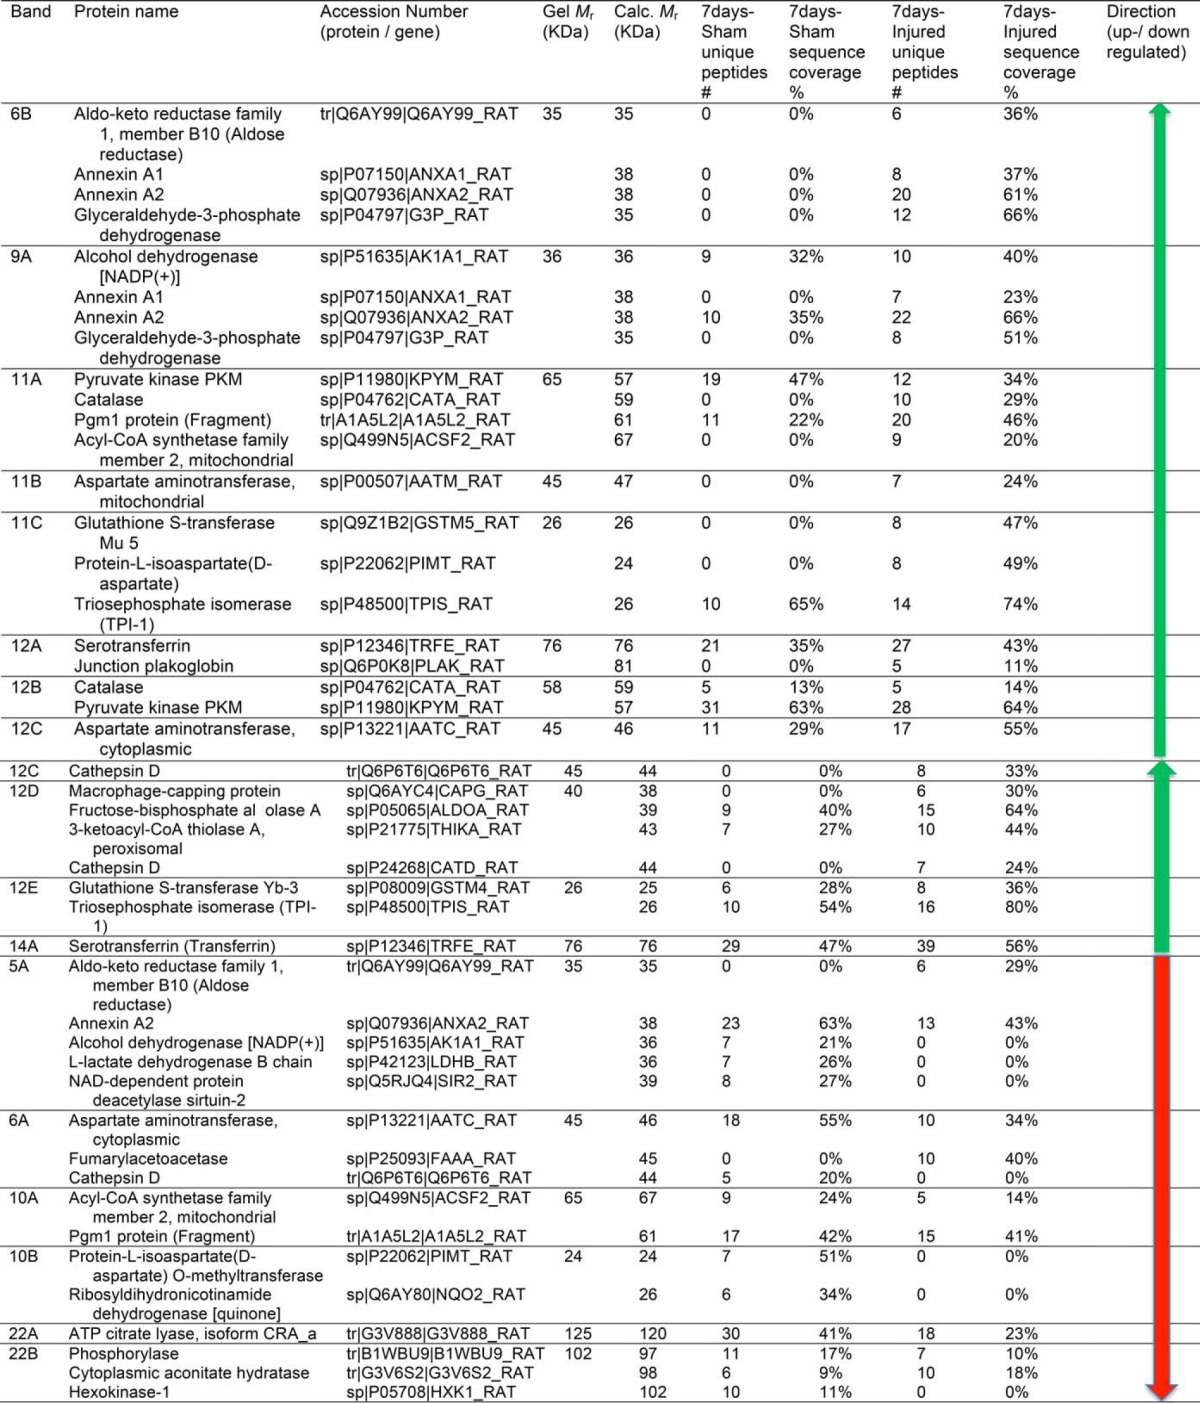
41 and 38 proteins for 24h and 7d, respectively reported in Tables I and II were identified by the analysis to be differentially expressed between sham and SCI. The identified proteins were grouped as having increased (22 and 22 proteins) or decreased (19 and 16 proteins) abundance for 24 h and 7 day, respectively (Fig. 2). The proteins with increased levels post-SCI (24 h) included aldehyde dehydrogenase 4 family, member A1 (Aldh4a1) protein (Fragment), LOC367586 protein, aminoacylase-1A, transketolase, Gamma-enolase, elongation factor 2, protein Tln1, and peroxiredoxin-2. After 7 day the list included aldo-keto reductase family 1, member B10 (aldose reductase), pyruvate kinase PKM, Acyl-CoA synthetase family member 2, mitochondrial, and protein-l-isoaspartate (d-aspartate O-methyltransferase). Among the proteins with decreased levels post-SCI (24 h) were isocitrate dehydrogenase [NADP], mannose-6-phosphate isomerase, pyridoxal kinase, stathmin, and peripheral myelin protein 2 (Pmp2). After 7 day, alcohol dehydrogenase [NADP(+)], l-lactate dehydrogenase B chain, ribosyldihydronicotinamide dehydrogenase [quinone], and ATP citrate lyase, isoform CRA a. Some differentially expressed proteins are common in both 24h and 7d time points, annexin A1& A2, glyceraldehyde-3-phosphate dehydrogenase, Pgm1 protein (Fragment), glutathione S-transferase Mu 5, triosephosphate isomerase, and transferrin (serotransferrin). Also, we have noticed the presence of the same proteins that were identified in both up and down regulated bands. This can be explained as families of proteins (Ex: annexin 1&2), mobility in CAX or PAGE would vary with (protein modification, or altered by proteases (BDP) so these proteins could elute in different fractions due to differences in surface charge. Between the 24 h and 7 day SCI increased protein level groups; we found that 7 of them overlapped (glyceraldehyde-3-phosphate dehydrogenase, Alcohol dehydrogenase [NADP(+)], annexin A2, Pgm1 protein, triosephosphate isomerase (TIM), glutathione S-transferase Mu 5, serotransferrin (transferrin)). Between the 24 h and 7 day post-SCI decreased protein level groups, only two proteins were on both lists (annexin A2 and Pgm1 protein) (Fig. 2).
TABLE 1. Identification of Differentially Expressed Proteins of sham and SCI rat lysate (24h) using CAX-PAGE/RPLC-MS/MS platform.
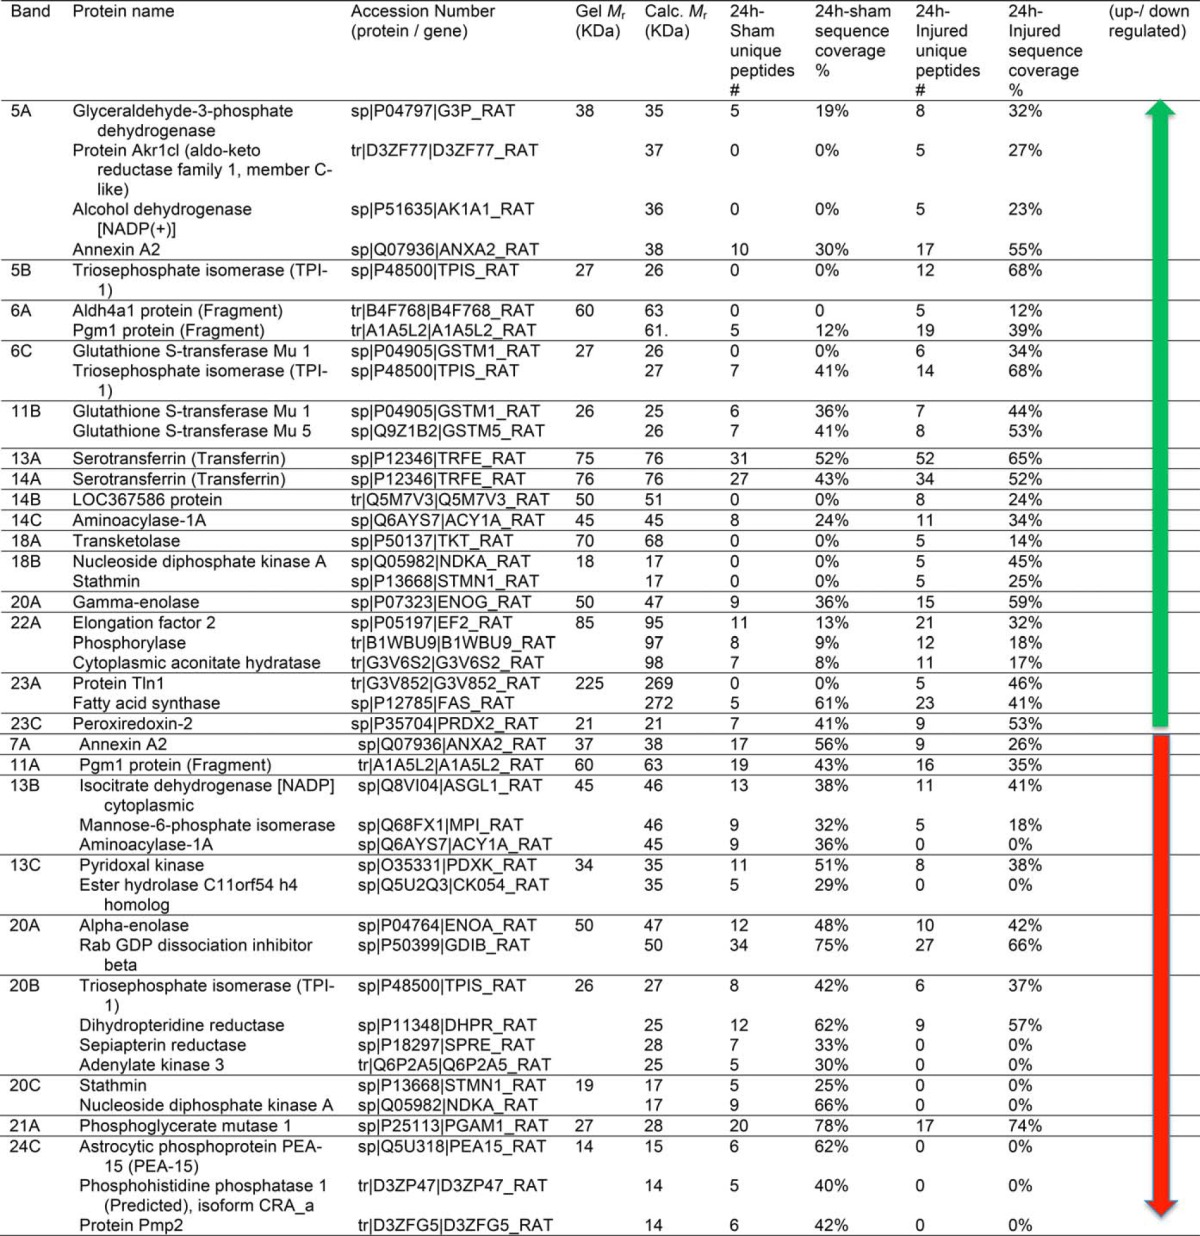
Table II. Identification of differentially expressed proteins of sham and SCI rat lysate (7days) using CAX-PAGE/RPLC-MS/MS platform.
Protein Immunoblotting Validation
Because necrosis, apoptosis, and cell death pathways are activated early after SCI damage, we have targeted already known biomarkers, αII- spectrin breakdown products (SBDP) SBDP-150 and SBDP-145 as reporters of calpain-mediated necrotic injury, SBDP-120 as a marker for caspase-mediated apoptosis, and GFAP breakdown products GBDP-38 as reporters of calpain-mediated glial injury, UCH-L1 for neuronal injury to validate the potential value of the new identified candidates. The candidate protein selection was based on the spinal cord specificity, antibody availability, and levels of peptide abundance. Five biomarker candidates were selected, blood brain barrier (BBB) located transferrin (49), lysosomal protease cathepsin D (50), triosephosphate isomerase-1 (TIM, TPI-1) (16), astrocytic phosphoprotein of 15 kDa (PEA-15) (51), and potential stroke biomarker nucleoside diphosphate kinase A (52) to confirm their protein alterations associated with SCI. The proteolytic damage markers to the spinal cord structural and cellular components have been validated by quantitative immunoblotting using specific antibodies for each protein. Differential changes in the above mentioned proteins have been confirmed by using (tissue lysate and CSF) sham and SCI (4 h, 24 h and 7 day) groups in the two severity points (moderate and severe) in rat spinal cord tissue segments (rostral, caudal, and epicenter) and CSF (Fig. 3, Fig. 4, Fig. 5, 6).
Fig. 3.
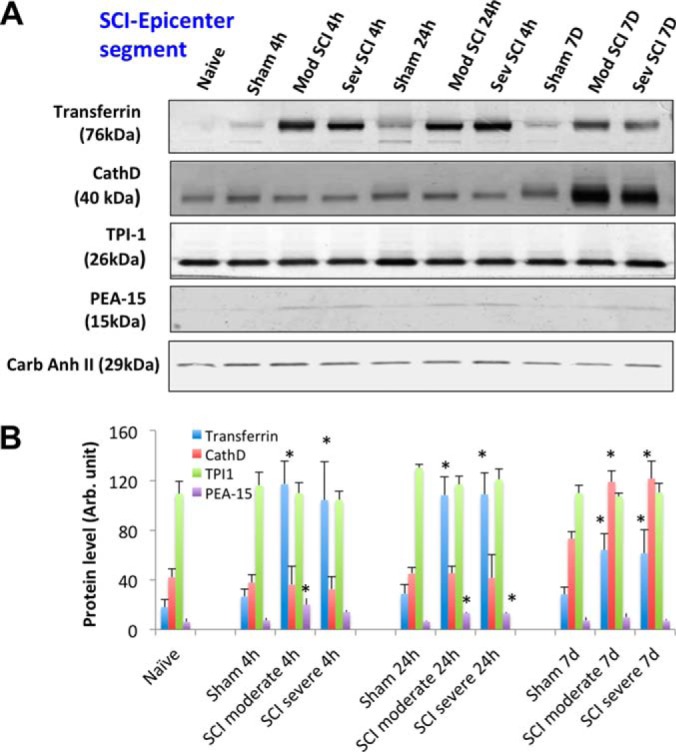
SCI-tissue immunoblotting validation (epi-center segment). A, Time course of post-SCI biomarkers and new candidates validation illustrated by Western blot of rat spinal cord tissue (rostral) lysate of rostral section (sham, and two SCI severity) collected at three time points (4 h, 24 h, and 7 days), candidate markers probed include transferrin, cathepsin D, TPI-1,and PEA-15. Western blot of carbonic anhydrase II served as a loading control. B, Immunoblotting quantification of spinal cord tissue lysate samples (sham and two SCI severity levels at three time points) for transferrin, CathD, TPI-1,and PEA-15 biomarkers. Mean + S.E. are shown. (* p < 0.05, compared with corresponding sham, unpaired t test).
Fig. 4.
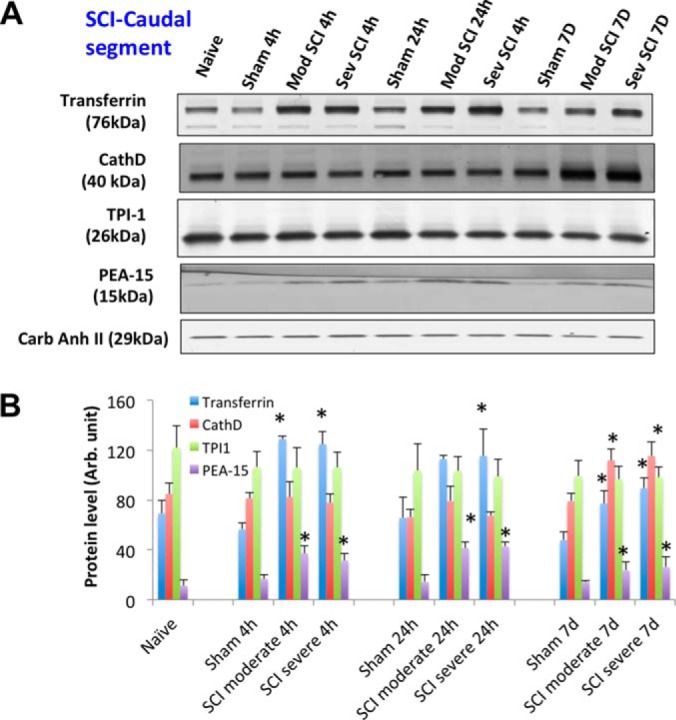
SCI-tissue immunoblotting validation (caudal segment). A, Time course of post-SCI biomarkers and new candidate's validation illustrated by Western blot of rat spinal cord tissue (rostral) lysate of rostral section (sham, and two SCI severity) collected at three time points (4 h, 24 h, and 7 days), candidate markers probed include transferrin, cathepsin D, TPI-1, and PEA-15. Western blot of carbonic anhydrase II served as a loading control. B, Immunoblotting quantification of spinal cord tissue lysate samples (sham and two SCI severity levels at 3 time points) for transferrin, CathD, TPI-1, and PEA-15 biomarkers. Mean + S.E. are shown. (* p < 0.05, compared with corresponding sham, unpaired t test).
Fig. 5.
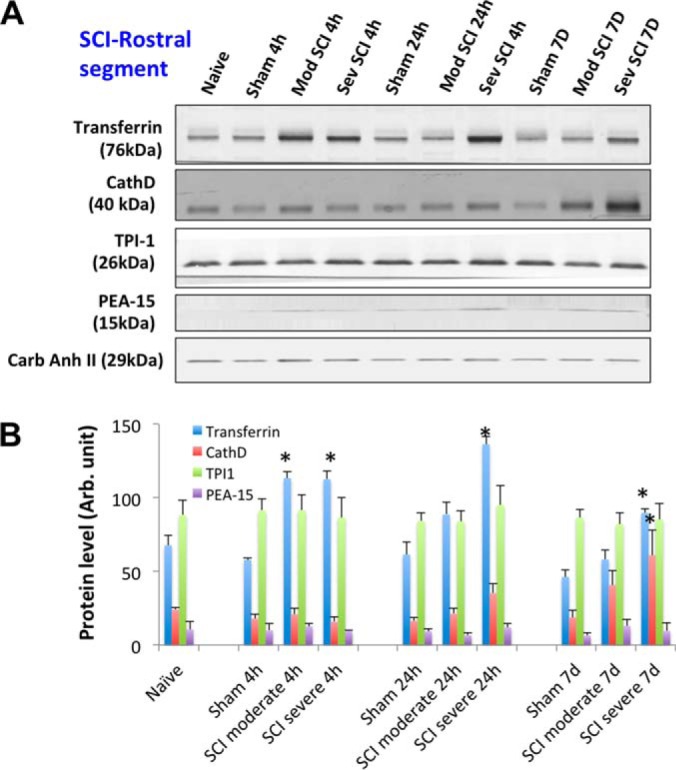
SCI-tissue immunoblotting validation (rostral segment). A, Time course of post-SCI biomarkers and new candidates validation illustrated by Western blot of rat spinal cord tissue (rostral) lysate of rostral section (sham, and two SCI severity) collected at three time points (4 h, 24 h, and 7 days), candidate markers probed include transferrin, cathepsin D, TPI-1 and PEA-15. Western blot of carbonic anhydrase II served as a loading control. B, Immunoblotting quantification of spinal cord tissue lysate samples (sham and two SCI severity levels at 3 time points) for transferrin, CathD, TPI-1, and PEA-15 biomarkers. Mean + S.E. are shown. (* p < 0.05, compared with corresponding sham, unpaired t test).
Fig. 6.

Rat SCI-CSF immunoblotting validation. A, Time course of post-SCI biomarkers release and new candidate marker validation illustrated by Western blot of rat spinal cord CSF samples (sham, and two SCI severity) collected at three time points (4 h, 24 h, and 7 days), the markers probed are alphaII-spectrin, transferrin, GFAP, TPI-1, UCHL-1, and PEA-15, B, Immunoblotting quantification of CSF samples (sham and two SCI severity levels at three time points) for Alpha II-spectrin breakdown products SBDP145 & SBDP120, GFAP and GFAP-BDP (38K), TPI-1, and PEA-15 biomarkers. Mean + S.E. are shown. (* p < 0.05, compared with corresponding sham, unpaired t test).
In rat spinal cord tissue samples, two known neuronal/axonal injury markers alpha-II-spectrin breakdown products (SBSP150, 120) were observed and glial injury marker GFAP was significantly degraded to GBDP-38K after SCI in both a severity-dependent manner (severe > moderate) and time dependent manner (7 day > 24 h > 4 h). No significant changes of a third marker UCH-L1 was observed in spinal cord tissue after SCI. For new candidate markers, the transferrin and PEA-15 levels are elevated in injured SCI samples compared with sham in the three time points (Fig. 3–5). CathD was found to be up-regulated only at 7 day post-SCI in all three segments (Fig. 3–5). However, TPI-1 is not significantly altered in this case.
In rat CSF, following SCI, marked increases of alpha II-spectrin breakdown products, SBDP145, SBDP120, and GFAP breakdown products, GBDP-38K were observed in 4h and to a lesser extent in the 24h samples and they return to basal levels by 7 day, when compared with shams. This temporal profile is different from the spinal cord tissue levels of SBDP and GBDP patterns where their levels continue to rise at 7 day. The most likely explanation is that at the tissue level there may be some residual necrotic/apoptotic tissue remaining and some continuing tissue damage and protein breakdown during the early time points, but by day 7, the animals might have sufficiently recovered to the point that they can more efficiently remove extracellular biofluid-based proteins (e.g. phagocytosis by microglia, macrophage) and regain protein clearance mechanisms in the CSF compartment, thus not allowing significant accumulation of the released biomarker proteins into the circulating CSF. Our novel candidate markers TPI-1 displayed higher levels in both moderate and severe (4 h and 24 h), however, PEA-15 didn't show signals. Transferrin was endogenously present in controls (sham), but its levels were further elevated at 4h after SCI (moderate and severe) (Fig. 6).
In human CSF, the calpain-generated SBDP150/145 levels were elevated at day 1–2 and sustained to day 4–5; however, the caspase-3-generated SBDP120 levels were elevated only at day 4–5 (Fig. 7). This is consistent with the acute pro-necrosis-calpain activation and delayed activation of caspase-3 in the apoptosis phase of CNS injury (53, 54). GFAP is subjected to endogenous proteolysis after SCI as it is shown in Fig. 7. In addition, we have demonstrated strong elevation of GFAP-BDP and to a lesser extent intact GFAP in CSF from day 1 to day 5 after SCI. Novel marker candidates Transferrin, CathD, TPI-1 and to a lesser extent, PEA-15, were readily detected in human CSF samples, especially after SCI (Fig. 7). CSF levels of all four candidate markers are also significantly increased after in SCI as compared with control CSF.(Fig. 8).
Fig. 7.

Representative time course of SCI biomarker candidate proteins released into human CSF after SCI, detected by immunoblotting. AlphaII-spectrin, SBDP150/145 and SBDP120, GFAP, GFAP-BDP, and Transferrin, CathD, TPI-1 and PEA-15 for two SCI patients A &B at different time points postinjury and for two patients and 4 controls.
Fig. 8.
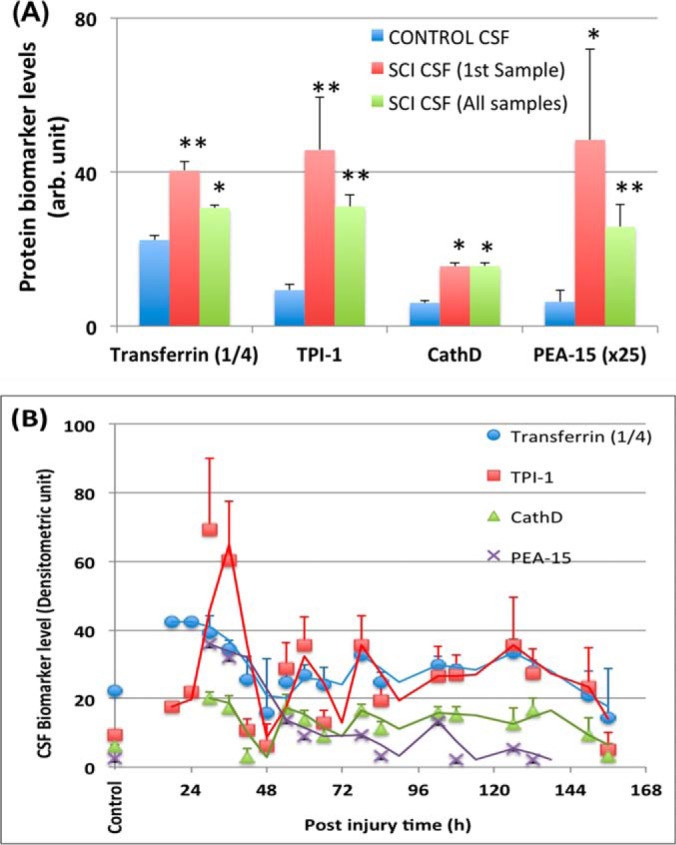
Quantification of biomarker release human CSF after SCI. (A) Biomarker levels at initial time point (First sample taken- usually within 36 postinjury) and all time points (all samples from day 0 to 6 post-SCI). Transferrin (signals × ¼ is shown), CathD, TPI-1, and PEA-15 (signals × 25 is shown). (* p < 0.05, **, p < 0.001, as compared with control CSF, unpaired t test). B, Time course of biomarker levels in CSF for all patients (n = 14). Mean + S.E. are shown. Trend lines shown are moving averages of biomarker levels from two adjacent time points.
Systems Biology Analysis
Top 12 candidate SCI biomarkers are input into Systems Biology (SB) analysis (Pathway Studio 10.0) to identify cellular process, regulation and common disease pathways. Using “Shortest Path” algorithm, potential interactions among these protein components were mapped (Fig. 9). Several nonredundant converging pathways are identified - they highlight the potential role of neuronal death mechanism, cell invasion, oxidative stress, and cell differentiation pathway as main players on SCI. Additional data and literature-mining and new experiments can be done to further understand the pathological pathways involved in spinal cord structural and functional changes, SCI recovery, complications and other SCI-related co-morbidities. Importantly further analysis identified three pathways as altered when the 12 SCI biomarker proteins as input. These include (1) cell growth and aging, (2) metabolic dysfunction, and (3) neural death pathways (Fig. 10). Lastly, Systems Biology analysis was also performed based on STRING program (http://string-db.org/) of the top 12 SCI biomarkers plus known CNS injury biomarkers, including αII-spectrin (SPTAN1 in human and rat, SPAN2 in mouse), UCHL1, MBP, GFAP, and S100b; we identified several interactome clusters in human, rat and mouse (Fig. 11). Overall, such SB analysis can help identify convergent pathways that might be relevant to SCI pathology and with future work we could identify possible therapeutic targets.
Fig. 9.

Candidate SCI biomarker input for Systems Biology and pathway network analysis. Top 12 candidate SCI biomarkers (shown in (A)) are input into Pathway Studio to identify cellular process, regulation and common disease pathway analysis (B).
Fig. 10.

Three pathways identified as altered based on the 12 SCI biomarker candidate proteins as input. Based on 1 Biology pathway analysis, (Fig. 9), three pathways were found to have the most interactions between these 12 candidate biomarkers: A, Cell growth and Aging; B, Metabolic Dysfunction; and C, Neural Death. Original SCI biomarkers are in red ovals with blue aura. Additional interacting partner proteins are in red ovals. Cell processes are in blue rectangles, disease pathway in purple rectangles, while regulation are annotated by gray arrows.
Fig. 11.

Systems Biology analysis identifying further interactome and interplay among the top 12 new SCI biomarkers with additional CNS injury biomarkers αII-spectrin (SPTAN1; SPAN2(mouse)), UCHL1 and MBP, GFAP, and S100b. Systems Biology analysis was based on STRING program (http://string-db.org/) with action views using three species: human (A), mouse (B), and rat (C). Blue lines indicate interactions, arrows indicate regulations, whereas gray lines identify possible associations. Green circles identified key interaction clusters identified.
DISCUSSION
Acute spinal cord injury (SCI) is a devastating disease with many consequences and no known effective treatment. Although it is quite easy to diagnose traumatic SCI, the assessment of injury severity and projection of disease progression or recovery are often challenging. In the literature, a number of CNS structural proteins (NSE, S100b, NF-H) and inflammatory cytokines (e.g. IL-6, IL-8) have been examined in proximal biofluids such as CSF and microdialysate in human or in rat model of SCI. However, no informative biomarkers have been definitely identified.
Proteomics is a promising approach for biomarker discovery; it has been used to study protein expression at the molecular level with a dynamic perspective (41). In fact, Lubieniecka et al. examined rat CSF fluid with LC-MS/MS approach and identified three proteins - Ywhaz (14–3-3 protein zeta/delta), Itih4 (Inter-α-trypsin inhibitor heavy chain 4), and Gpx3 (glutathione peroxidase 3) (7). However, none of these three proteins are known to be specific or enriched in the spinal cord of CNS. In this study, a comprehensive multi-dimensional separation scheme, cationic/anionic-exchange (CAX) chromatography, followed by 1D polyacrylamide gel electrophoresis (PAGE), has been used to reduce protein complexity (Fig. 1, 2). A reverse phase liquid chromatography-tandem mass spectrometry (LC-MS/MS) proteomic platform was utilized to examine and characterize proteome changes associated with rat SCI tissue (Table I, II). In all, 32 proteins were found to be either up- or down-regulated at 24h after SCI (severe) in the rostral segment of rat SCI, when compared with sham control (Fig. 2). Similar, 29 additional proteins were either up- or down-regulated at 7 day after SCI (Fig. 2). We thus further triage the candidates down to 12 candidates in terms of signal strength as well as potential relevance to spinal cord injury (Table III).
To confirm the authenticity of the candidates, we sought to use a method for validation that is independent of mass spectrometry. Quantitative immunoblotting method was chosen (38) for these purposes. We also expanded the analysis with three regions (rostral, caudal and epicenter) of SCI injured (and sham) samples collected from the rat SCI animal model at two severity-levels (moderate and severe). Tissue samples collected were expanded to three time points (4 h, 24 h, 7 day) along with cerebrospinal fluid (CSF). With four the 12 candidate biomarkers, we were able to obtain robust immunoblotting signals (transferrin, CathD, TPI-1, and PEA-15) (Fig. 3–5). We indeed verified that two proteins Transferrin and PEA-15 are up-regulated at least one time point post-SCI in all three tissue segments (Fig. 3–5). Their direction of change (i.e. elevations) is consistent with the findings in mass spectrometry data for both of these proteins (Table I, II). CathD was found to be up-regulated only at 7d post-SCI in all three segments (Fig. 3–5). These data are consistent with mass spectrometry data showing CathD differential elevations only at day 7 but not day 1 (Table II). We noted that while transferrin, CathD, TPI-1 and PEA-15 were up-regulated in both moderate and severe SCI at various time points over naïve and corresponding sham controls, but their levels between the severe groups and corresponding moderate groups were not different.
In our moderate injury model in rats, Transferrin and CathD protein levels were elevated at the lesion epicenter as well as caudal to the lesion site at 7 days, but were not significantly increased in the rostral segments at the same time point (Fig. 3, 4 versus 5). This differs from the severe injury model, where Transferrin and CathD were elevated in all three segments at 7 days. These findings may suggest that alterations in levels of some proteins (e.g. Transferrin, CathD) might result from neurodegenerative events occurring within the epicenter and descending neural tracts rather than from secondary injury processes which are likely to occur in epicenter, descending and ascending tracts. In the future, it will be important to correlate these and other biomarker changes and region dependent structural changes with MRI imaging approaches to evaluate cause and effect relationships.
In addition, we also examined with immunoblotting method three candidate markers (transferrin, TPI-1 and PEA-15) in rat SCI and naïve and sham control CSF samples collected at 4 h, 24 h, and 7days against two known CNS injury biomarkers (αII-Spectrin and GFAP and their breakdown products (BDPs)). Although we did not get sufficient signals for PEA-15, we readily detected transferrin and TPI- signals. Again, we confirmed that transferrin is significantly up-regulated at 4 h post-SCI (both moderate and severe), while TPI-1 was elevated in CSF at 4 and 24 h postinjury (both moderate and severe SCI) (Fig. 6). These data are consistent with spinal tissue immunoblotting data (Fig. 3–5) as well as mass spectrometry data (Table I-II).
For our clinical translational study, we examined several candidate biomarkers with immunoblotting method using serial CSF samples (collected from day 1 to 5 postinjury) from 15 human, severe to moderate, SCI patients and 10 normal controls (Suppl. Table I). Blood (serum, plasma) samples were not attempted due to unfavorable noise to signal issue. Transferrin, CathD, TPI-1 and to a lesser extent, PEA-15, were readily detected in human CSF samples, especially after SCI (Fig. 7). From our composite quantification data, we were able to establish their time course of release over 6 days postinjury (Fig 8B). We also confirmed that all four markers were significantly elevated in CSF samples from SCI patients when compared with corresponding controls (Fig 8A).
From comparing two different patients (e.g. SBDP, Transferrin, GFAP and TPI-1 (Fig. 7), it becomes apparent patient A has an immediate elevation of these proteins at early time points, while patient B has more fluctuated and persistent elevated levels. It is tempting to suggest that these biomarker profiles might reflect differences in severity (ASIA scale), lesion level (e.g. cervical versus lumbar), patient improvement over time, and/or presence of secondary insults at later time points. But due to the limited patient sample size, our current discovery study did not have enough power to examine these possible correlations systemically. This is in fact a limitation of the current study.
For the four candidate biomarkers we validated in human CSF samples, transferrin is a glycoprotein involved in binding and regulation of free iron ion in tissue biofluids. Its up-regulation after SCI might suggest that iron regulation might be altered. Cathepsin D (CathD), a lysosomal cysteine protease, might be involved in the cytoskeletal and other cellular protein degradation we observed after SCI. Two known cytoskeletal proteins (axonal αII-spectrin and astroglial GFAP) were already found to be degraded to respective BDPs after SCI in rat and human (Fig. 6–7). TPI-1 (Triosephosphate isomerase-1) is an enzyme that catalyzes the isomerization of glyceraldehyde 3-phosphate (G3P) and dihydroxy-acetone phosphate (DHAP) in glycolysis and gluconeogenesis. In addition to its role in glycolysis and gluconeogenesis TPI-1 is also involved in several additional metabolic biological processes including the pentose phosphate shunt, and fatty acid biosynthesis. Thus, its up-regulation after SCI suggests likely alterations of the regulation of metabolic pathways. PEA-15 is a phosphorylation-regulated astroglia protein. The PEA-15 protein is shown to regulate autophagy via activation of JNK in glioma cells (50). Its up-regulation suggests the involvement in astroglia responses in SCI. However, regardless of the proteomic methods used, it is nearly impossible to detect all proteins that are altered in a given experimental system, thus we also turned to Systems Biology (SB) method to complement and expand our findings. SB analysis has the advantage of highlighting cellular process, regulation, common disease pathways as well as potential protein-protein interactions.
Bioinformatic and Systems biology tools have been initially developed to cancer biology based on the large cancer biology datasets collected (55, 56). However, more recently, as more neuro-disorder datasets are becoming available, these bioinformatic and SB tools were being increasingly used in neurological (TBI), neurodegenerative (multiple sclerosis, amyotrophic lateral sclerosis (ALS)) and neuropsychiatric disorders (substance abuse disorder) (38, 40, 57–59) and SCI in the current study (Fig. 9–11).
When the 12 candidate biomarkers were input into SB analysis, we indeed identified that at least three pathways might be involved in SCI pathology: (1) cell growth and aging; (2) metabolic dysfunction, and (3) neural death pathways (Fig. 9–10). In terms of interactome analysis, we also found that the 12 new SCI biomarkers we identified in fact interact with 5 known CNS injury biomarkers (SPTAN1 UCHL1, MBP, GFAP, and S100b) by way of 2–3 clusters of interactome (Fig. 11). Thus, such SB analysis can facilitate the identification of convergent pathways and potential therapeutic target “hot-spots” that might be critical to SCI pathology.
In conclusion, twelve SCI candidate biomarkers were tentatively identified by out proteomic method. This study is unique in that we not only verified biomarker levels in spinal cord tissue and in CSF in rat model of SCI, but several candidate biomarkers were further validated in human CSF samples from day 0 to 6 post-SCI. Thus, the translational potential of our findings is high. PEA-15 is especially of interest as it is highly specific to astroglial cells found in the CNS, thus it might be a specific SCI biomarker. The next step will be development of simple, robust and quantitative assays (such as ELISA) for these biomarkers to further validate their elevations not only in proximal biofluid such as CSF, but can in blood samples (such as serum or plasma) from human SCI patients. Through Systems Biology and pathway analysis, our proteomic study also pointed to a number of altered signaling or cellular pathways. Thus our approach of differential SCI proteomics can facilitate not only the identification of novel diagnostic and potentially prognostic SCI biomarkers. Although this study does provide novel information regarding alterations in a battery of biomarkers after experimental and human SCI, more work has to be done to completely characterize these outcome measures. Indeed, larger groups of animals and subjects with different locations and degrees of injury would help identify specific biomarkers for patients with specific types of SCI. Thus, future studies will build on these observations and hopefully provide therapeutic targets for future treatment interventions.
Supplementary Material
Footnotes
Author contributions: A.M., H.M.B., R.A.Y., W.D., and K.K.W. designed research; A.M., H.M.B., J.H.D., Z.Y., T.S., and M.S.W. performed research; A.M. and K.K.W. analyzed data; A.M. and K.K.W. wrote the paper; A.M. co-corresponding author.
* This study is supported in part by the DOD grant W81XWH-12-1-0276 (WDD, MSW) and W81XWH-12-1-0277 (KKW) from the United States Army.
 This article contains supplemental material.
1 The abbreviations used are:
- SCI
- spinal cord injury
- AIS
- American Spinal Injury Association scale
- CAX
- Cationic/anionic-exchange
- PAGE
- polyacrylamide gel electrophoresis
- RPLC
- reverse phase liquid chromatography
- MS/MS
- tandem mass spectrometry
- TBI
- Traumatic brain injury
- TF
- Transferrin
- FASN
- Fatty acid synthase
- NME1
- Nucleoside diphosphate kinase 1
- STMN1
- Stathmin 1
- EEF2
- Eukaryotic translation elongation factor 2
- CTSD
- CathD, Cathepsin D
- ANXA1
- Annexin A1
- ANXA2
- Annexin A2
- PGM1
- Phosphoglucomutase 1
- PEA15
- Phosphoprotein enriched in astrocytes 15
- GOT2
- Glutamic-oxaloacetic transaminase 2
- TPI-1
- Triosephosphate isomerase 1
- GFAP
- glial fibrillary acidic protein
- SBDP
- αII-Spectrin breakdown product
- GBDP
- GFAP breakdown product.
REFERENCES
- 1. Cortez R., and Levi A. D. (2008) Acute spinal cord injury. Curr. Treat Options Neurol. 9, 115–125 [DOI] [PubMed] [Google Scholar]
- 2. Gil-Dones F., Alonso-Orgaz S., Avila G., Martin-Rojas T., Moral-Darde V., Barroso G., Vivanco F., Scott-Taylor J., and Barderas M. G. (2009) An Optimal Protocol to Analyze the Rat Spinal Cord Proteome. BMI 2009, 135–164 [DOI] [PMC free article] [PubMed] [Google Scholar]
- 3. The Christopher & Dana Reeve Foundation (2008) Paralysis 2008, 1–48 [Google Scholar]
- 4. Baptiste D. C., and Fehlings M. G. (2006) Pharmacological approaches to repair the injured spinal cord. J. Neurotrauma 23, 318–334 [DOI] [PubMed] [Google Scholar]
- 5. Yu C.-G., and Geddes J. W. (2007) Sustained calpain inhibition improves locomotor function and tissue sparing following contusive spinal cord injury. Neurochem. Res. 32, 2046–2053 [DOI] [PubMed] [Google Scholar]
- 6. Kwon B. K., Casha S., Hurlbert R. J., and Yong V. W. (2011) Inflammatory and structural biomarkers in acute traumatic spinal cord injury. Clin. Chem. Lab. Med. 49, 425–433 [DOI] [PubMed] [Google Scholar]
- 7. Lubieniecka J. M., Streijger F., Lee J. H. T., Stoynov N., Liu J., Mottus R., Pfeifer T., Kwon B. K., Coorssen J. R., Foster L. J., Grigliatti T. A., and Tetzlaff W. (2011) Biomarkers for Severity of Spinal Cord Injury in the Cerebrospinal Fluid of Rats. PLoS ONE 6, e19247. [DOI] [PMC free article] [PubMed] [Google Scholar]
- 8. Holly L. T., Freitas B., McArthur D. L., and Salamon N. (2009) Proton magnetic resonance spectroscopy to evaluate spinal cord axonal injury in cervical spondylotic myelopathy. J Neurosurg Spine 10, 194–200 [DOI] [PubMed] [Google Scholar]
- 9. Sajja B. R., Wolinsky J. S., and Narayana P. A. (2009) Proton magnetic resonance spectroscopy in multiple sclerosis. Neuroimaging Clin. N. Am. 19, 45–58 [DOI] [PMC free article] [PubMed] [Google Scholar]
- 10. Carpentier A., Galanaud D., Puybasset L., Muller J.-C., Lescot T., Boch A.-L., Riedl V., Riedl V., Cornu P., Coriat P., Dormont D., and van Effenterre R. (2006) Early morphologic and spectroscopic magnetic resonance in severe traumatic brain injuries can detect “invisible brain stem damage” and predict “vegetative states”. J. Neurotrauma 23, 674–685 [DOI] [PubMed] [Google Scholar]
- 11. Qian J., Herrera J. J., and Narayana P. A. (2010) Neuronal and axonal degeneration in experimental spinal cord injury: in vivo proton magnetic resonance spectroscopy and histology. J. Neurotrauma 27, 599–610 [DOI] [PMC free article] [PubMed] [Google Scholar]
- 12. JOHANN D. J. JR., MCGUIGAN M. D., PATEL A. R., TOMOV S., ROSS S., Conrads T. P., Veenstra T. D., FISHMAN D. A., WHITELEY G. R., PETRICOIN E. F. III, and LIOTTA L. A. (2004) Clinical Proteomics and Biomarker Discovery. Ann. N.Y. Acad. Sci. 1022, 295–305 [DOI] [PubMed] [Google Scholar]
- 13. Paul D., Kumar A., Gajbhiye A., Santra M. K., and Srikanth R. (2013) Mass spectrometry-based proteomics in molecular diagnostics: discovery of cancer biomarkers using tissue culture. BioMed. Research International 2013, 783131–783131 [DOI] [PMC free article] [PubMed] [Google Scholar]
- 14. Davidsson P., and Sjögren M. (2005) The use of proteomics in biomarker discovery in neurodegenerative diseases. Dis. Markers 21, 81–92 [DOI] [PMC free article] [PubMed] [Google Scholar]
- 15. Paul D., Kumar A., Gajbhiye A., Santra M. K., and Srikanth R. (2013) Mass spectrometry-based proteomics in molecular diagnostics: discovery of cancer biomarkers using tissue culture. BioMed Research International 2013, 783131–783131 [DOI] [PMC free article] [PubMed] [Google Scholar]
- 16. Ding Q., Wu Z., Guo Y., Zhao C., Jia Y., Kong F., Chen B., Wang H., Xiong S., Que H., Jing S., and Liu S. (2006) Proteome analysis of up-regulated proteins in the rat spinal cord induced by transection injury. Proteomics 6, 505–518 [DOI] [PubMed] [Google Scholar]
- 17. Issaq H. J., Chan K. C., Janini G. M., Conrads T. P., and Veenstra T. D. (2005) Multidimensional separation of peptides for effective proteomic analysis. J. Chromatography B 817, 35–47 [DOI] [PubMed] [Google Scholar]
- 18. Tissot Lion J. D. N. (2008) Clinical Proteomics: From Diagnosis to Therapy. By Van Eyk J. E. and Dunn M. J. (Eds.). Proteomics 8, 1945–1945 [Google Scholar]
- 19. Yu W., Li Y., Deng C., and Zhang X. (2006) Comprehensive two-dimensional separation in coupling of reversed-phase chromatography with capillary isoelectric focusing followed by MALDI-MS identification using on-target digestion for intact protein analysis. Electrophoresis 27, 2100–2110 [DOI] [PubMed] [Google Scholar]
- 20. Sheng S., Chen D., and Van Eyk J. E. (2006) Multidimensional liquid chromatography separation of intact proteins by chromatographic focusing and reversed phase of the human serum proteome: optimization and protein database. Mol. Cell. Proteomics 5, 26–34 [DOI] [PubMed] [Google Scholar]
- 21. Sheng S., Chen D., and Van Eyk J. E. (2006) Multidimensional liquid chromatography separation of intact proteins by chromatographic focusing and reversed phase of the human serum proteome: optimization and protein database. Mol. Cell. Proteomics 5, 26–34 [DOI] [PubMed] [Google Scholar]
- 22. Kang S. K., So H. H., Moon Y. S., and Kim C. H. (2006) Proteomic analysis of injured spinal cord tissue proteins using 2-DE and MALDI-TOF MS. Proteomics 6, 2797–2812 [DOI] [PubMed] [Google Scholar]
- 23. Tsai M. C., Shen L. F., Kuo H. S., Cheng H., and Chak K. F. (2008) Involvement of acidic fibroblast growth factor in spinal cord injury repair processes revealed by a proteomics approach. Mol. Cell. Proteomics 7, 1668–1687 [DOI] [PMC free article] [PubMed] [Google Scholar]
- 24. Yan X., Liu J., Luo Z., Ding Q., Mao X., Yan M., Yang S., Hu X., Huang J., and Luo Z. (2010) Proteomic profiling of proteins in rat spinal cord induced by contusion injury. Neurochem. Int. 56, 971–983 [DOI] [PubMed] [Google Scholar]
- 25. Cao F., Yang X.-F., Liu W.-G., Hu W.-W., Li G., Zheng X.-J., Shen F., Zhao X.-Q., and Lv S.-T. (2008) Elevation of neuron-specific enolase and S-100beta protein level in experimental acute spinal cord injury. J. Clin. Neurosci. 15, 541–544 [DOI] [PubMed] [Google Scholar]
- 26. Guéz M., Hildingsson C., Rosengren L., Karlsson K., and Toolanen G. (2003) Nervous tissue damage markers in cerebrospinal fluid after cervical spine injuries and whiplash trauma. J. Neurotrauma 20, 853–858 [DOI] [PubMed] [Google Scholar]
- 27. Kwon B. K., Stammers A. M. T., Belanger L. M., Bernardo A., Chan D., Bishop C. M., Slobogean G. P., Zhang H., Umedaly H., Giffin M., Street J., Boyd M. C., Paquette S. J., Fisher C. G., and Dvorak M. F. (2010) Cerebrospinal fluid inflammatory cytokines and biomarkers of injury severity in acute human spinal cord injury. J. Neurotrauma 27, 669–682 [DOI] [PubMed] [Google Scholar]
- 28. Ma J., Novikov L. N., Karlsson K., Kellerth J. O., and Wiberg M. (2001) Plexus avulsion and spinal cord injury increase the serum concentration of S-100 protein: an experimental study in rats. Scand. J. Plast. Reconstr. Surg. Hand Surg. 35, 355–359 [DOI] [PubMed] [Google Scholar]
- 29. Zhang B., Huang Y., Su Z., Wang S., Wang S., Wang J., Wang A., and Lai X. (2011) Neurological, functional, and biomechanical characteristics after high-velocity behind armor blunt trauma of the spine. J. Trauma: Injury, Infection, and Critical Care 71, 1680–1688 [DOI] [PubMed] [Google Scholar]
- 30. Loy D. N., Sroufe A. E., Pelt J. L., Burke D. A., and Cao Q. (2005) Serum biomarkers for experimental acute spinal cord injury: Rapid elevation of neuron-specific enolase and S-100β. Neurosurgery 56, 391–397 [DOI] [PubMed] [Google Scholar]
- 31. Shaw G., Yang C., Ellis R., Anderson K., Parker Mickle J., Scheff S., Pike B., Anderson D. K., and Howland D. R. (2005) Hyperphosphorylated neurofilament NF-H is a serum biomarker of axonal injury. Biochem. Biophys. Res. Commun. 336, 1268–1277 [DOI] [PubMed] [Google Scholar]
- 32. Springer J. E., Azbill R. D., Kennedy S. E., George J., and Geddes J. W. (1997) Rapid calpain I activation and cytoskeletal protein degradation following traumatic spinal cord injury: attenuation with riluzole pretreatment. J. Neurochem. 69, 1592–1600 [DOI] [PubMed] [Google Scholar]
- 33. Zhang S. X., Underwood M., Landfield A., Huang F. F., Gison S., and Geddes J. W. (2000) Cytoskeletal disruption following contusion injury to the rat spinal cord. J. Neuropathol. Exp. Neurol. 59, 287–296 [DOI] [PubMed] [Google Scholar]
- 34. Pouw M. H., Hosman A. J. F., van Middendorp J. J., Verbeek M. M., Vos P. E., and van de Meent H. (2009) Biomarkers Spinal Cord Injury 47, 519–525 [DOI] [PubMed] [Google Scholar]
- 35. Okon E. B., Streijger F., Lee J. H. T., Anderson L. M., Russell A. K., and Kwon B. K. (2013) Intraparenchymal microdialysis after acute spinal cord injury reveals differential metabolic responses to contusive versus compressive mechanisms of injury. J. Neurotrauma 30, 1564–1576 [DOI] [PubMed] [Google Scholar]
- 36. Stammers A. T., Liu J., and Kwon B. K. (2012) Expression of inflammatory cytokines following acute spinal cord injury in a rodent model. J. Neurosci. Res. 90, 782–790 [DOI] [PubMed] [Google Scholar]
- 37. Kitano H. (2002) Systems biology: a brief overview. Science 295, 1662–1664 [DOI] [PubMed] [Google Scholar]
- 38. Zhang Z., Larner S. F., Kobeissy F., Hayes R. L., and Wang K. K. W. (2010) Systems biology and theranostic approach to drug discovery and development to treat traumatic brain injury. Methods Mol. Biol. 662, 317–329 [DOI] [PubMed] [Google Scholar]
- 39. Kobeissy F. H., Guingab-Cagmat J. D., Razafsha M., O'Steen L., Zhang Z., Hayes R. L., Chiu W.-T., and Wang K. K. W. (2011) Leveraging biomarker platforms and systems biology for rehabilomics and biologics effectiveness research. PM & R 3, S139–S147 [DOI] [PubMed] [Google Scholar]
- 40. Feala J. D., AbdulHameed M. D. M., Yu C., Dutta B., Yu X., Schmid K., Dave J., Tortella F., and Reifman J. (2013) Systems Biology Approaches for Discovering Biomarkers for Traumatic Brain Injury. J. Neurotrauma 30, 1101–1116 [DOI] [PMC free article] [PubMed] [Google Scholar]
- 41. Kobeissy F. H., Ottens A. K., Zhang Z., Liu M. C., Denslow N. D., Dave J. R., Tortella F. C., Hayes R. L., Wang K. K., Kobeissy F. H., Ottens A. K., Zhang Z., Liu M. C., Denslow N. D., Dave J. R., Tortella F. C., Hayes R. L., and Wang K. K. W. (2006) Novel differential neuroproteomics analysis of traumatic brain injury in rats. Mol. Cell. Proteomics 5, 1887–1898 [DOI] [PubMed] [Google Scholar]
- 42. Pinzon A., Marcillo A., Pabon D., Bramlett H. M., Bunge M. B., and Dietrich W. D. (2008) A re-assessment of erythropoietin as a neuroprotective agent following rat spinal cord compression or contusion injury. Exp. Neurol. 213, 129–136 [DOI] [PMC free article] [PubMed] [Google Scholar]
- 43. Pinzon A., Marcillo A., Quintana A., Stamler S., Bunge M. B., Bramlett H. M., and Dietrich W. D. (2008) A re-assessment of minocycline as a neuroprotective agent in a rat spinal cord contusion model. Brain Res. 1243, 146–151 [DOI] [PMC free article] [PubMed] [Google Scholar]
- 44. Gruner J. A. (1992) A monitored contusion model of spinal cord injury in the rat. J. Neurotrauma 9, 123–128 [DOI] [PubMed] [Google Scholar]
- 45. Agrawal G., Kerr C., Thakor N. V., and All A. H. (2010) Characterization of graded multicenter animal spinal cord injury study contusion spinal cord injury using somatosensory-evoked potentials. Spine 35, 1122–1127 [DOI] [PMC free article] [PubMed] [Google Scholar]
- 46. Flint J., Dutta S., Johnson E., Wang K. K., Pike B. R., and Hayes R. L. (2001) Accumulation of non-erythroid alpha II-spectrin and calpain-cleaved alpha II-spectrin breakdown products in cerebrospinal fluid after traumatic brain injury in rats. J. Neurochem. 78, 1297–1306 [DOI] [PubMed] [Google Scholar]
- 47. Vizcaíno J. A., Deutsch E. W., Wang R., Csordas A., Reisinger F., Ríos D., Dianes J. A., Sun Z., Farrah T., Bandeira N., Binz P.-A., Xenarios I., Eisenacher M., Mayer G., Gatto L., Campos A., Chalkley R. J., Kraus H.-J., Albar J. P., Martinez-Bartolomé S., Apweiler R., Omenn G. S., Martens L., Jones A. R., and Hermjakob H. (2014) ProteomeXchange provides globally coordinated proteomics data submission and dissemination. Nat. Biotechnol. 32, 223–226 [DOI] [PMC free article] [PubMed] [Google Scholar]
- 48. Pineda J. A., Lewis S. B., Valadka A. B., Papa L., Hannay H. J., Heaton S. C., Demery J. A., Liu M. C., Aikman J. M., Akle V., Brophy G. M., Tepas J. J., Wang K. K., Robertson C. S., Hayes R. L., Pineda J. A., Lewis S. B., Valadka A. B., Papa L., Hannay H. J., Heaton S. C., Demery J. A., Liu M. C., Aikman J. M., Akle V., Brophy G. M., Tepas J. J., Wang K. K. W., Robertson C. S., and Hayes R. L. (2007) Clinical significance of alphaII-spectrin breakdown products in cerebrospinal fluid after severe traumatic brain injury. J. Neurotrauma 24, 354–366 [DOI] [PubMed] [Google Scholar]
- 49. Reis F. M., Esteves A. M., Tufik S., and de Mello M. T. (2010) ORIGINAL ARTICLEPlasma iron levels appraised 15 days after spinal cord injury in a limb movement animal model. Spinal Cord 49, 361–364 [DOI] [PubMed] [Google Scholar]
- 50. Banik N. L., Matzelle D. C., Gantt-Wilford G., Osborne A., and Hogan E. L. (1997) Increased calpain content and progressive degradation of neurofilament protein in spinal cord injury. Brain Res. 752, 301–306 [DOI] [PubMed] [Google Scholar]
- 51. Sharif A., Renault F., Beuvon F., Castellanos R., Canton B., Barbeito L., Junier M. P., and Chneiweiss H. (2004) The expression of PEA-15 (phosphoprotein enriched in astrocytes of 15 kDa) defines subpopulations of astrocytes and neurons throughout the adult mouse brain. NSC 126, 263–275 [DOI] [PubMed] [Google Scholar]
- 52. Allard L., Burkhard P. R., Lescuyer P., Burgess J. A., Walter N., Hochstrasser D. F., and Sanchez J.-C. (2005) PARK7 and nucleoside diphosphate kinase A as plasma markers for the early diagnosis of stroke. Clin. Chem. 51, 2043–2051 [DOI] [PubMed] [Google Scholar]
- 53. Wang K. K. W. (2000) Calpain and caspase: can you tell the difference? Trends Neurosci. 23, 20–26 [DOI] [PubMed] [Google Scholar]
- 54. Liu M. C., Akinyi L., Scharf D., Mo J., Larner S. F., Muller U., Oli M. W., Zheng W., Kobeissy F., Papa L., Lu X.-C., Dave J. R., Tortella F. C., Hayes R. L., and Wang K. K. W. (2010) Ubiquitin C-terminal hydrolase-L1 as a biomarker for ischemic and traumatic brain injury in rats. Eur. J. Neurosci. 31, 722–732 [DOI] [PMC free article] [PubMed] [Google Scholar]
- 55. Boja E. S., and Rodriguez H. (2014) Proteogenomic convergence for understanding cancer pathways and networks. Clin. Proteomics 11, 22. [DOI] [PMC free article] [PubMed] [Google Scholar]
- 56. Wang E. (2013) Understanding genomic alterations in cancer genomes using an integrative network approach. Cancer Lett. 340, 261–269 [DOI] [PubMed] [Google Scholar]
- 57. Kobeissy F. H., Sadasivan S., Liu J., Gold M. S., and Wang K. K. W. (2008) Psychiatric research: psychoproteomics, degradomics and systems biology. Expert Rev. Proteomics 5, 293–314 [DOI] [PubMed] [Google Scholar]
- 58. Fekete T., Zach N., Mujica-Parodi L. R., and Turner M. R. (2013) Multiple kernel learning captures a systems-level functional connectivity biomarker signature in amyotrophic lateral sclerosis. PLoS ONE 8, e85190. [DOI] [PMC free article] [PubMed] [Google Scholar]
- 59. Kotelnikova E., Bernardo-Faura M., Silberberg G., Kiani N. A., Messinis D., Melas I. N., Artigas L., Schwartz E., Mazo I., Masso M., Alexopoulos L. G., Mas J. M., Olsson T., Tegner J., Martin R., Zamora A., Paul F., Saez-Rodriguez J., and Villoslada P. (2015) Signaling networks in MS: a systems-based approach to developing new pharmacological therapies. Multiple Sclerosis J. 21, 138–146 [DOI] [PubMed] [Google Scholar]
Associated Data
This section collects any data citations, data availability statements, or supplementary materials included in this article.