

Abstract
Characterizing whole proteins by top-down proteomics avoids a step of inference encountered in the dominant bottom-up methodology when peptides are assembled computationally into proteins for identification. The direct interrogation of whole proteins and protein complexes from the venom of Ophiophagus hannah (king cobra) provides a sharply clarified view of toxin sequence variation, transit peptide cleavage sites and post-translational modifications (PTMs) likely critical for venom lethality. A tube-gel format for electrophoresis (called GELFrEE) and solution isoelectric focusing were used for protein fractionation prior to LC-MS/MS analysis resulting in 131 protein identifications (18 more than bottom-up) and a total of 184 proteoforms characterized from 14 protein toxin families. Operating both GELFrEE and mass spectrometry to preserve non-covalent interactions generated detailed information about two of the largest venom glycoprotein complexes: the homodimeric l-amino acid oxidase (∼130 kDa) and the multichain toxin cobra venom factor (∼147 kDa). The l-amino acid oxidase complex exhibited two clusters of multiproteoform complexes corresponding to the presence of 5 or 6 N-glycans moieties, each consistent with a distribution of N-acetyl hexosamines. Employing top-down proteomics in both native and denaturing modes provides unprecedented characterization of venom proteoforms and their complexes. A precise molecular inventory of venom proteins will propel the study of snake toxin variation and the targeted development of new antivenoms or other biotherapeutics.
The toxic secretions of venomous animals have long been a source of biologically active molecules, yet remain a promising source of new drugs (1, 2). Snake venoms in particular are widely studied and contain a mixture of small molecules, peptides, proteins, and protein complexes which are used to incapacitate prey and to defend against predators (3–5). Snakes produce anywhere from three to several dozen diverse families of toxic proteins. Each family is encoded by multiple multilocus genes generated by gene duplication resulting in a large number of expressed isoforms (6) that can differ greatly even between individuals of the same species (4, 7, 8).
Most current techniques for venom protein analysis and toxin identification are based on bottom-up (BU)1 proteomics approaches where toxins are enzymatically digested and the peptides are analyzed by tandem mass spectrometry (MS/MS) (8–11). Although this technique can generate a comprehensive overview of toxin families present in the venom, such peptide-based toxin studies do not provide isoform-specific identifications and/or distributions and stoichiometries of post-translational modifications (PTMs). As a result, bottom-up experiments provide imprecise information about what specific molecular species/toxins are present and how they interact.
In principle, top-down proteomics (TDPs), a method that measures intact proteins and their fragment ion masses, can access new information on protein toxins. TDPs has matured over the past decade and now can be applied to intricate biological samples in a high-throughput manner for proteins up to ∼30 kDa (12). One major advantage of TDPs lies in the ability to provide complete molecular specificity of an intact protein to determine its “proteoforms”, the set of molecules that arise from combinations of genetic variation (e.g. sequence variants, isoforms) and PTMs (13). Increased levels of characterization are possible thanks to recent advances in instrumentation (14, 15), intact protein fractionation methods (16–18), and data processing (19, 20). Recently, Calvete and co-workers published a top-down MS analysis of snake venom. Their pipeline coupled LC-MS/MS analysis, intact mass values of reduced and non-reduced proteins, and BU proteomics to assign manually toxin identifications with high attention to locus-specificity. The analysis identified 11 three finger toxins (3FTx), 1 Kunitz-type serine protease inhibitor (KNT), 1 ohanin, 1 phospholipase A2 (PLA2), and 1 cysteine rich secretory protein (CRISP) in the venom of the Indonesian king cobra (21).
Although denaturing TDPs provides a powerful technique for characterizing individual proteins <30 kDa, native MS is a growing field where highly purified multiproteoform complexes (22) larger than 100 kDa in size can be interrogated by top-down MS (12, 22–24). Native MS analysis of purified protein complexes has been reported since the early 1990's (25, 26). This was followed by gas-phase ejection of subunits (27), with the fragmentation of these by MS/MS and their identification being a more recent advance (23). The development of a separation technique termed native gel-eluted liquid fraction entrapment electrophoresis (native GELFrEE), allowed its linked use with native MS (23) to fully characterize intact complexes from endogenous systems (28). With many proteins performing their functions as members of protein assemblies, their direct observation could provide a highly informative view of the molecular composition and protein-protein interactions in snake venom. Native MS is a relatively new technique to study non-covalent protein-protein interactions in comparison to x-ray diffraction and solution nuclear magnetic resonance (NMR) that are commonly used to characterize the tertiary and quaternary structures of proteins (29). Based on these and other biochemical methods, several toxin complexes were identified with variable stoichiometry (homo- and heteromeric complexes) and from almost all snake venom toxin families (30). Characterization studies have focused on: haditoxin, a 3FTx homodimer (31), crotoxin, a PLA2 heterodimer (32), the homodimer of l-amino acid oxidase (LAAO) from Calloselasma rhodostoma (33), and pseutarin C, a serine protease heterodimer (34).
Here, we leverage all recent advances of denaturing and native TDPs to characterize the proteins in Ophiophagus hannah (king cobra) venom. The results provide the most comprehensive, proteoform-specific view of a venom proteome to date, resolving combinatorial variations arising from proteolytic protein processing, sequence polymorphism, complexation and post-translational modification.
EXPERIMENTAL PROCEDURES
Venom Samples
Ophiophagus hannah (king cobra) venom milked from two individuals original from Malaysia was purchased from the Kentucky Reptile Zoo, and was pooled by zoo staff. Venom protein concentration was determined using the BCA protein assay kit and BSA as standard following the manufacturer's instructions (Thermo Pierce, Rockford, IL).
Denaturing Top-down Proteomics
GELFrEE separation was performed on a GELFREE 8100 fractionation system (Expedeon, Harston, Cambridgeshire, UK) using 300 μg of venom sample on a 10% cartridge following the manufacturer's instructions. Twelve 150 μl fractions were collected manually and precipitated with MeOH/CH3Cl/H2O to remove SDS and salts as described previously (16). Pelleted fractions were resuspended in 30 μl of buffer A (95% H2O, 5% ACN, 0.2% formic acid).
In-solution isoelectric focusing (sIEF) was performed on a 1 mg sample of venom dissolved in 3 ml of 7 m urea, 2 m thiourea, 30 mm DTT, and 60 μl (2%) of Biolyte 3/10 ampholytes, pH range 3.0 to 10.0 (Bio-Rad, Hercules, CA). The separation was performed on a MicroRotofor (BioRad) at 1 W constant power for 3 h at 10 °C. Ten fractions were collected and cleaned using homemade C-18 stage tips (35). Fractions were dried and resuspended in 50 μl of buffer A. Nano RPLC-MS/MS analysis was performed using an Ultimate 3000 nanoRPLC (Thermo Scientific Dionex, Sunnyvale, CA) system on an in-house packed polymeric reverse phase resin (PLRP-S, 5 μm, 1000 Å, Phenomenex, Santa Clara, CA) for the trap-column (2 cm x 150 μm i.d.) and analytical column (20 cm × 75 μm i.d.). Fractionated samples were separated with a 90 min. gradient whereas the whole venom was analyzed using a 120 min. gradient. RPLC was used in tandem with an Orbitrap Elite and a Q-Exactive HF (Thermo Scientific, San Jose, CA) for online MS/MS analysis. MS1 (intact protein) spectra were acquired at 120,000 resolving power (at 400 m/z for the Orbitrap Elite and at 200 m/z for the Q-Exactive HF) using four μscans. Data-dependent top two MS2 (protein fragmentation) spectra were acquired using higher-energy collisional dissociation (HCD) at 60,000 resolving power with an isolation window of 15 m/z (Orbitrap Elite) and 4 m/z (Q-Exactive HF).
Data Analysis
Intact protein mass and fragment ions were searched against protein sequences and candidate proteoforms from the suborder Serpente, including sequences, features and modifications for the king cobra (36). This was accomplished by downloading a UniprotKB flatfile on June 10, 2014 and the search database was created using the Database Manager application within ProSightPC v3.0 (Thermo Fisher Scientific). The resulting database was established as a ProSight Warehouse File (.pwf) and contained 331,349 candidate proteoforms. Searches were performed using an iterative, three-tiered, absolute mass search tree (2.5 Da, 200 Da, and 2000 Da intact mass tolerance), and then re-searched using a biomarker search with a 15 ppm tolerance for intact protein mass and a 10 ppm mass tolerance for fragment ions. In order to estimate the false discovery rate (FDR) for each data set, spectra were searched against a scrambled database and their p-scores derived from a Poisson statistical model (37) were fit to a gamma distribution as described previously (16, 38). The E-values corresponding to a 5% FDR cutoff for absolute mass searches are as follows: GELFrEE, 1.1 × 10⁻⁶; whole venom, 1.7 × 10⁻⁶; sIEF 2.7 × 10⁻⁶. Because of the differences in the search space covered by biomarker (“no enzyme”) searches, the E-values corresponding to a 5% instantaneous FDR (a.k.a. q-values) for those were generated separately and were: 1.2 × 10⁻¹⁰ for denaturing GELFrEE, 2.6 × 10⁻¹¹ for LC-MS of whole venom and 1.7 × 10⁻⁸ for sIEF.
Relative protein abundance was quantified by summing ion abundance measurements using in-house protein software built and reported for label-free quantitation (39). All raw data files associated with this study are available at http://massive.ucsd.edu/ with identifier MSV000079351 and all compatible identified proteoforms are assigned unique PFR identifiers, deposited in the Consortium for Top Down Proteomics Proteoform Repository (http://repository.topdownproteomics.org/).
Native Separations
O. hannah venom was fractionated by Native-GELFrEE as described previously (28). Briefly, 1 mg of venom was suspended in 200 μl of low salt solubilization buffer (50 mm imidazole, 500 mm aminocaproic acid, 1 mm EDTA, pH 7.0) and mixed with 30 μl of 70% glycerol and 0.1% Ponceau S. Fractionation was performed via imidazole-based clear native GELFrEE carried out using 1–12% T gradient tube gel. A voltage range of 200–1000 V was applied for protein separation, and 150 μl fractions were collected manually. Fractions were cleaned with HiPPR detergent-removal columns (Thermo Pierce), following manufacturer instructions, and buffer exchanged into 150 mm ammonium acetate using 30 kDa Amicon Ultra molecular weight cutoff filters (Millipore, Billerica, MA).
Native Mass Spectrometry
Native electrospray ionization was performed using a custom source developed by the Dovichi lab and previously reported (28, 40) with a spray voltage of 1.0–1.2 kV. Mass spectrometry was conducted on a modified Q-Exactive HF (Thermo Fisher Scientific). Briefly, the standard Q-Exactive quadrupole rf drive was modified in order to decrease the resonant rf frequency to 284 kHz and enable higher m/z selection up to m/z 20,000, as described previously (23). Scans were collected manually using 15,000 resolving power at m/z 200 for MS1 spectra and 120,000 resolving power for MS2 and pseudo-MS3 spectra as described previously (23). Average masses and charge states for spectra without isotopic resolution were calculated by optimizing the standard deviation of the most intense peaks using the web tool ESIprot Online (41). Proteins were identified from fragmentation spectra using ProSightPC v3.0 (Thermo Fisher Scientific) and were searched against the Serpente database with 331,349 candidate proteoforms in the same ProSight Warehouse described above. Spectra that were not identified by database retrieval were analyzed and interpreted manually using Qual Browser (Thermo Fisher Scientific) and mMass (42). Graphical fragment maps for the figures were created using ProSight Lite v1.1 (43).
Protein Digestion
In triplicate, 100 μg of venom was resuspended in 8 m urea, 2 m thiourea, and reduced using 10 mm of DTT for 1 h at room temperature. Cysteine residues were carboxamidomethylated with 10 mm iodoacetamide for 30 min. in the dark. Samples were diluted to 1 m urea with Tris-HCL 100 mm, pH 8.2, and MS grade trypsin (Promega, Fitchburg, WI) was added (1:50 protease/substrate (w/w)) for overnight digestion at 37 °C. Proteolysis was stopped by adding trifluoroacetic acid to a 1% final concentration (44). Peptides were cleaned using homemade C-18 stage tips (35) and resuspended in buffer A.
LC-MS/MS
Peptides were fractionated using a Ultimate 3000 nanoRPLC (Thermo Fisher Scientific) system on an in-house packed 2 cm × 150 μm i.d. pre-column (Jupiter C18, 3 μm, 300 Å, Phenomenex), and 25 cm × 75 μm i.d. column (Jupiter C18, 3 μm, 300 Å, Phenomenex, Torrance, CA) coupled to a Q-Exactive HF (23) (Thermo Fisher Scientific). Chromatography was performed at 300 nl/min. flow rate with 95% water, 5% ACN and 0.2% formic acid (FA) as mobile phase A and 85% ACN, 15% water, and 0.2% FA as phase B. Runs were performed using an optimized gradient of 120 min. (5% B per 10 min., 5–45% B over 85 min., followed by 45–90% B over 5 min., 90% B for 5 min., and 90–5% B for 5 min.). Mass spectra were acquired by Tune and Xcalibur software operating in data dependent acquisition (DDA) mode, switching between full scan MS1 (60,000 resolution at 200 m/z, 200 ms maximum injection time, AGC 1 × 10⁶ ions, scan range 300–2,000 m/z) and MS2 (15,000 resolution at 200 m/z, 250 ms maximum injection time, AGC 1 × 10⁵ ions, range 200–2,000 m/z). MS2 spectra were obtained by HCD fragmentation of the 10 most intense ions using 22 to 26 stepped normalized collision energy.
Bottom Up Data Analysis
Peptide searches were performed using ProLuCID v1.3 search engine (45) against only the canonical protein sequences in the Serpente database, including the O. hannah genome data, downloaded from UniprotKB on June 10, 2014, totaling 49,360 entries. Carboxamidomethylation of cysteines was set as a fixed modification and oxidation of methionine was set as a variable modification. Only full tryptic peptides were considered with a maximum of two missed cleavages. Mass tolerances for MS1 and MS2 were set at 70 and 550 ppm, respectively. XCorr was determinate as a primary score, and ZScore was used as a secondary one. Resultant peptides were processed and evaluated by Search Engine Processor (SEPro) v3.2.0.2 using the following filter parameters: 10 ppm deviation from theoretical peptide precursor, peptides longer than six amino acid residues, and a 1% estimated protein-level FDR (46). Label free protein quantitation was performed according to the normalized spectral abundance factor (NSAF) (47). Bottom-up data are available via ProteomeXchange with identifier PXD003403. Annotated spectra and filtered data can be opened and visualized using the package “PatternLab for proteomics” available for free at http://www.patternlabforproteomics.org/.
Experimental Design and Statistical Rationale
Denaturing top-down analyses of the whole venom without prefractionation were performed in five runs of LC-MS/MS (MS technical replicates) to reduce under-sampling associated with the DDA-based method. GELFrEE and sIEF fractionations were performed twice (process replicates) and each obtained fraction was analyzed by LC-MS/MS twice (MS technical replicates) to reduce variance from the separation methods. The venom was fractionated twice by native GELFrEE (process replicates) and the fractions from each were analyzed by direct injection nanospray once. The bottom-up analysis was performed using a single digestion that was analyzed by LC-MS/MS in triplicate (MS technical replicates) to reduce under-sampling associated with the DDA method.
RESULTS
Denaturing Top-down Venomics
Fig. 1 shows the strategy used for proteoform-resolved interrogation of the venom proteome obtained from two individuals of king cobra. The top-down methodology is divided into two major sections: denaturing top-down (dTD) and native top-down (nTD), with the latter employing native GELFrEE and native MS/MS (28). For dTD (Fig. 1A), we began by omitting prior fractionation and directly analyzing the whole venom by LC-MS/MS, yielding an intense set of peaks eluting in the first 30 min. of the total ion chromatogram (Fig. 2A). MS data extracted from these peaks indicated the presence of many proteoforms with masses of 5–13 kDa. A total of 17 proteins (counted as unique UniprotKB accession numbers) were identified at a 5% FDR (Table I and supplemental Table S1). The highly abundant peaks were identified as 3FTx, PLA2, and ohanin. After 30 min. of elution, only the larger (CRISP) and more hydrophobic (3FTx and PLA2) proteins were identified.
Fig. 1.
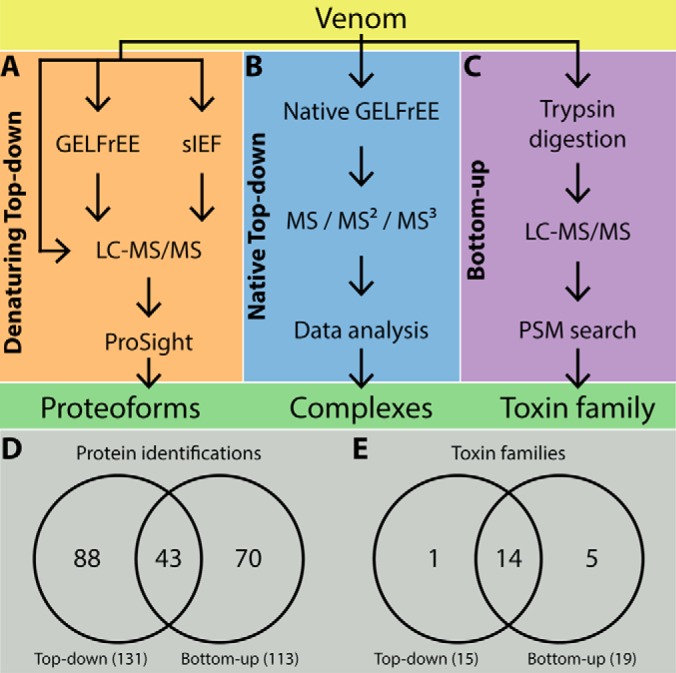
Strategy used for proteoform-resolved interrogation of king cobra venom. The main steps used in each of the different top-down and bottom-up strategies are highlighted. Top-down analyses were divided into denaturing (A) and native (B) modes, with bottom-up analysis (C) used for comparative benchmarking. Comparison of protein identifications (D) and toxin families (E) identified by denaturing top-down and bottom-up proteomics.
Fig. 2.

Visualization of the different separation methods applied prior to LC/MS analysis. The total ion chromatogram from direct analysis of whole venom by LC-MS/MS analysis (A), SDS-PAGE slab gel used to visualize the quality of fractionation of whole venom by denaturing GELFrEE (B), and solution isoelectric focusing (sIEF) (C). The diagram reports the number of proteins identified (by absolute mass and biomarker mode searches) using LC-MS/MS analysis after each of three fractionation methods employed for dTD (D).
Table I. Proteins and proteoforms identified by separation method. The number of proteins, as unique UniprotKB accession number, and distinct observed proteoforms are in parentheses for each protein family identified in each of the experiments performed using top-down proteomics in denaturing mode (dTD). The last column shows the proteins identified by Calvete and co-workers by TDP (21). Abbreviations are: 3FTx, three finger toxins; CRISP, cysteine rich secretory protein; CVF, cobra venom factor; IGF, insulin-like growth factor; KNT, Kunitz-type serine protease inhibitor; LAAO, l-amino acid oxidase; OHN, ohanin; PLA2, phospholipase A2; SVMP, snake venom metalloproteinases; SVNGF, snake venom nerve growth factor; SVSP, snake venom serine protease; SVVEGF, snake venom vascular endothelial growth factor; WAP, waprin.
| Protein family | Whole venom | GELFrEE | sIEF | Non-redundant | Previous work (21) |
|---|---|---|---|---|---|
| 3FTx | 12 | 43 (2) | 50 (27) | 57 (29) | 11 |
| CRISP | 1 | 2 (3) | 2 | 3 (3) | 1 |
| CVF | 1 | 4 | 4 | ||
| Disintegrin | 2 | 2 | |||
| IGF | 3 | 3 | |||
| KNT | 2 (1) | 2 (7) | 2 (8) | 1 | |
| LAAO | 2 | 1 | 2 | ||
| OHN | 2 | 3 | 2 (4) | 3 (4) | 1 |
| PLA2 | 1 | 2 | 9 (9) | 10 (9) | 1 |
| SVMP | 14 | 14 | |||
| SVNGF | 1 | 1 | |||
| SVSP | 1 | 1 | |||
| SVVEGF | 3 | 1 | 3 | ||
| WAP | 1 | 1 | |||
| Non-toxin | 1 | 6 | 20 | 25 | |
| Total | 17 | 64 (6) | 113 (47) | 131 (53) | 15 |
To improve experimental dynamic range and obtain better coverage of the venom proteome, we then employed and compared denaturing GELFrEE and solution isoelectric focusing (sIEF) prior to LC-MS/MS analysis (Fig. 1A). The resulting fractions from both separation techniques were visualized on SDS-PAGE slab gels (Fig. 2B and 2C, respectively) before being interrogated by LC-MS/MS. GELFrEE generated 12 fractions and separated the most abundant 5–13 kDa proteins into the first four fractions (Fig. 2B). LC-MS/MS analysis of each fraction using the same MS/MS data acquisition and search parameters used for whole venom analysis generated 64 protein identifications (Table I and supplemental Table S2), representing a ∼2.8-fold increase when compared with direct venom analysis. On the other hand, sIEF partitioned the most abundant proteins into 7 of the 10 collected fractions (Fig. 2C). When these ten fractions were submitted to the same LC-MS/MS analysis, they resulted in 113 protein identifications, nearly twice as many as found via denaturing GELFrEE (Table I and supplemental Table S3). Fig. 2D shows a direct comparison of the resulting identifications, organized by separation method. In total, we identified 131 proteins, with sIEF/LC-MS/MS providing 63 unique protein identifications not found using the other two separation strategies. Denaturing GELFrEE/LC-MS/MS and direct venom analysis provided 18 identifications not found after sIEF, with 16 of these classified as nontoxins. Of the 131 proteins identified during the automated search process, only 14% arose from absolute mass searches with a MS1 mass window of less than 2.5 Da. The remaining 86% of identifications resulted from a searches using 2.5 to 2000 Da windows, indicating the large sequence variation present in the venom.
Proteins identified by absolute mass searching were manually validated to precisely annotate the amino acid substitutions, alternative processing cleavage sites, and presence of extra PTMs, resulting in the identification of 53 additional proteoforms (each different from the 131 mapping to unique accession numbers discussed above). The 53 additional cases map to genes in the 3FTx, PLA2, KNT, and CRISP families; in total, 184 unique proteoforms were identified (Table I and supplemental Table S4). The mass shifts observed in the intact mass of some proteoforms were characterized with complete molecular specificity based on the information available from MS2 fragment masses that matched to <10 ppm. Nearly 70% of the 53 distinct proteoforms arose from either amino acid changes in the primary sequence (compared with the canonical sequence present in UniprotKB) and/or PTMs not related to protein proteolytic processing. The next most common modification was proteolytic processing, which was observed on 28 proteoforms at sites other than the annotated cleavage sites reported in the literature or in UniprotKB. In addition, 12 proteoforms harbored variations in both primary sequence and proteolytic processing.
The toxin family with the largest number of identified proteoforms was the 3FTx (supplemental Fig. S1). Within this family, the long neurotoxin Oh-55 (Q53B58) exhibited the most proteoforms (5 in total; Table S4). The base proteoform of Oh-55 we refer to here as Pf 0 (derived from the canonical sequence deposited in UniprotKB with no additional modifications) was identified with a mass error of −0.53 ppm when compared with the theoretical mass and with extensive fragmentation reflected in the outstanding p-score of 5.2 × 10−114 (Fig. 3A). Three additional proteoforms of Oh-55 were identified and characterized with varying sequence lengths which are referred to here as Oh-55 Pf 1, 2, and 3. They are missing C-terminal residues from the mature toxin chain from unexpected proteolytic processing (supplemental Table S4). Furthermore, we identified Oh-55 Pf 4 with seven amino acid mutations from the Oh-55 Pf 0, the largest number characterized in this study (Fig. 3B). When mapped onto the crystal structure, none of these sequence differences were observed in Loop I (residues 1–14), and only one was found in Loop II (residues 19–43). However, five differences were observed in Loop III (residues 44–59) (Fig. 3C) (48, 49). Curiously, all 7 non-synonymous differences (only two are conservative) do not to map to known function-critical residues that directly bind to acetylcholine receptors and impair neuromuscular and neuronal transmission (48, 49).
Fig. 3.

Proteoform fragmentation, primary sequence, and 3D structure indicating the locations of sequence variation. Proteoform fragmentation map of the base proteoform (Pf 0) of the long neurotoxin Oh-55 (Q53B58) (A) and of Pf 4 of Oh-55 (B); sequence positions showing amino acid differences from the Pf 0 of Oh-55 are highlighted in gray. J represents the isobaric amino acids Ile/Leu. Mapping of the polymorphic residues (indicated in red) determined by dTD analysis of Pf 4 of Oh-55 onto a 3D structural model, based on long neurotoxin 2 (P01386) (C).
Proteolytic processing/degradation and non-canonical cleavage sites or poorly annotated proteins were identified and annotated using a Biomarker-type search. In this search the intact proteoform mass is searched against all protein subsequences, similar to “no-enzyme” BU searches but also considering possible disulfide bond formation. Several of the larger proteins present in the venom such as SVMP, LAAO, and CVF were only identified in the denaturing TD workflow as unexpected proteolytic products using the Biomarker search mode (supplemental Table S4). New proteolytic processing events not yet annotated in UniprotKB were observed in ohanin (P83234), and the resultant proteoforms are displayed in Fig. 4. The ohanin proteoforms Pf 1 and 2 differ when compared with Pf 0 by the addition of 1 (Arg129) and 2 (Arg130) amino acids at the C terminus, respectively. Further, we identified three proteoforms originating from the ohanin propeptide (supplemental Fig. S2). They constitute the predicted propeptide with six (Pf 3) and seven (Pf 4) residues cleaved from the N-terminal region, and a third proteoform equivalent to Pf 4 but with the N-terminal Glu137 converted to pyroglutamic acid (Pf 5). The most abundant propeptide proteoform was Pf 3, representing 88.3% (± 0.5%) of the total propeptide abundance followed by ohanin Pf 5, 11.0% (± 0.5%), and Pf 4, 0.8% (± 0.2%).
Fig. 4.

Graphical representation of the proteoforms of ohanin. The translated sequence of ohanin (P83234) containing the signal peptide region (SP), the mature protein, and the propeptide region. The six proteoforms characterized are depicted by the colored rectangles, and the bottom-up coverage (bottom of figure) is represented in the same manner; the red color on Pf 5 of ohanin indicates the post-translationally modified pyroglutamic acid. The graphical representation was constructed with the assistance of the software Caititu (71).
Native Top-down Venomics
To access the larger proteins present in king cobra venom, we applied a nTD methodology (Fig. 1B). Whole venom was fractionated by native GELFrEE, yielding 14 fractions visualized using a clear native PAGE slab gel (Fig. 5A). The most intense fractions in the gel, N10 and N11, were pooled and analyzed by native mass spectrometry. We observed two distributions of peaks with average masses centered at 130,014.2 ± 0.7 Da and 126,271.0 ± 2.3 Da (Fig. 5B and Table II). The peaks making up each distribution differed in mass by ∼203 Da, consistent with the mass of multiple N-acetyl hexosamine (HexNAc) residues (Fig. 5B, inset). Quadrupole-isolation, with a 50 m/z isolation window, of each of the main glycoform distributions, followed by HCD fragmentation using an optimized energy to maximize dissociation, in separate MS/MS experiments produced highly similar fragmentation spectra (supplemental Fig. S3). Neutral masses extracted from each spectrum searched in absolute mass mode with ProSightPC identified both as l-amino acid oxidase (LAAO, P81383) with p-scores of 3 × 10−53 and 2 × 10−51, for the heavier and lighter precursors, respectively. Mapping the fragment ions to the primary sequence with a 10 ppm tolerance showed extensive coverage of the C-terminal region (Fig. 5C).
Fig. 5.

Identification and purification of l-amino acid oxidase multiproteoform complexes. A native GELFrEE separation of whole O. hannah venom visualized using a native, silver-stained slab gel (A). An intact mass spectrum of the homodimeric l-amino acid oxidase - LAAO (P81383) multiproteoform complexes (MPCs) is shown in (B). In detail, the observed microheterogenity in the two MPCs corresponds to HexNAc mass differences (increments of 203 Da, see scale bar in the inset of Panel B). The partial fragment map (C), showing selected fragment ions from the C-terminal region of LAAO, which enabled its unambiguous identification by database retrieval. Blue and red MPCs in B are consistent with the presence of 6 (Complex 1) and 5 occupied N-glycosites (Complex 2), respectively; their graphical representation is shown at lower left (D, green diamond corresponds to a glycosylation moiety with average mass of 3,743 Da). Mass values for Complexes 1 and 2 are given in (D) and correspond to the peaks marked with the asterisks in the inset of Panel (B).
Table II. Proteins and protein complexes identified using top-down proteomics in native mode (nTD). Protein accession numbers in UniprotKB (Accession #), protein-protein interaction (Complex), average theoretical mass, average observed mass of monomers and complexes masses in parentheses, and post-translational modifications (PTM) are included.
| Protein | Accession # | Complex | Theoretical mass | Observed mass | PTM |
|---|---|---|---|---|---|
| Cobra venom factor | I2C090 | – | 140,957 Da | 146,565 +/− 63 Daa | Glycosylation 5,608 Da |
| l-amino acid oxidase form 1 | P81383 | Homodimer | 53,691 Da (107,382 Da) | 130,014.2 +/− 0.7 Dab | Glycosylation 22,637.2 Da |
| l-amino acid oxidase form 2 | P81383 | Homodimer | 53,690 Da (107,382 Da) | 126,271.0 +/− 2.3 Dab | Glycosylation 18,889.2 Da |
| Cysteine rich secretory protein | Q7ZT98 | Homodimer | 24,960 Da (49,920 Da) | 49,918 Da | – |
| Phospholipase A2 | Q9DF33 | Homodimer | 13,176 Da (26,352 Da) | 26,375 Da | – |
| Snake venom metalloproteinase | D3TTC2 | – | 47,684 Da | 49,283 Dab | Glycosylation 1,599 Da |
a Centered on the top of the glycoform distribution.
b The most abundant glycoform in the distribution.
The theoretical mass of mature LAAO without any PTMs is 53,690.9 Da, less than half of the measured mass from the venom sample. Therefore, the observation of the intact mass is consistent with that of a homodimer, which has been previously described in the venom of Calloselasma rhodostoma (33). However, the mass difference between the theoretical homodimer (107,382 Da) and the observed average masses of the multiproteoform complexes is 22,632.4 and 18,889.2 Da, equivalent to ∼17 and ∼15% of the total mass, respectively. These mass differences are consistent with the presence of 6 and 5 glycan structures, respectively, with an average mass of ∼3,743 Da for each glycan moiety (Fig. 5D). The glycosylation of LAAO can be associated with the four annotated N-linked glycosylation sites on each monomer (Asn122, Asn238, Asn266, and Asn410) (50). However, our data are consistent with the occupancy of five and six of the eight possible glycosylation sites in the dimer with relative abundances of ∼15 and ∼85%, respectively. This example illustrates the determination of the identity of a complex, as well as its monomer and PTM stoichiometry in a single mass spectrometry experiment.
The analyses of the subsequent native GELFrEE fractions allowed us to identify the CVF (I2C090), known to be the largest protein present in the venom of O. hannah. The observed average mass was 146,565 ± 63 Da (Table II and supplemental Fig. S4), ∼5.6 kDa larger than the theoretical predicted mass. The observed mass difference is again consistent with the presence of glycans at either one or both of the two predicted glycosites (Asp181 and Asp209) (51). In the lower-mass native GELFrEE fractions, we identified two dimeric protein complexes: CRISP (Q7ZT98) and PLA2 (Q9DF33) (Table II). Although PLA2 has been previously observed as a dimer, CRISP has not. Although PLA2 and CRISP could be identified using an automated search process, we observed a protein of mass 49,283 Da (Table II) that could not be identified by database searching. Manually processing the fragmentation spectrum allowed for de novo annotation and characterization of the protein by using BLASTp (http://blast.ncbi.nlm.nih.gov) from a 13-residue sequence tag (supplemental Fig. S5). A glycoprotein similar to zinc metalloproteinase-disintegrin-like atragin from Naja atra (D3TTC2) was identified with a BLASTp-assigned E-value of 2 × 10⁻⁶ and 85% identity. The observed average mass of 49,283 Da was 4% greater than the predicted theoretical mass of 47,684 Da and a literature search found the presence of one glycosylation site (Asp436) (52), the probable explanation for the mass shift. This SVMP identification showed that proteins can be identified de novo and partially characterized using nTD techniques.
Bottom-up Venomics and Comparison with Denaturing Top-down Venomics
We used BU analyses to identify and quantify all known proteins families present in the venom, providing a direct comparison between TD and BU proteomics. BU proteomics is currently the most commonly used technique for protein identification and quantification from complex samples (Fig. 1C). Using a single in-solution digestion of the O. hannah venom and analyzing the peptides in triplicate by LC-MS/MS we identified, at 1% FDR, 113 proteins in maximum parsimony mode, which were assembled into 64 protein groups (supplemental Table S5) representing 19 protein families (supplemental Table S6). TDPs identified 18 more proteins than the BU approaches (Fig. 1D), however BU could identify five additional protein families (Fig. 1E). The TD methodology identified more than 92% of the toxin families smaller than 50 kDa identified by BU.
The normalized spectral abundance factor (NSAF) was used on BU results to obtain the rough relative concentration of protein families in the venom (supplemental Table S6, and supplemental Fig. S6). Using this method 97.9% of the venom proteome is composed of toxins with only 2.1% as non-toxins. The most abundant toxin family identified was the 3FTx, comprising 69.7% of the venom abundance, which is the protein family with the most diverse number of proteoforms characterized by TDPs, 86 in total (Table I and supplemental Fig. S1). Eight protein families were found at intermediate concentrations ranging from 6% to 1% of the total venom, including the PLA2 family, which is the second most abundant venom protein family and comprises 5.7% of the venom. Nine other toxin families (supplemental Table S6 and supplemental Fig. S6) were identified at concentrations equal to or lower than 0.5%, and are considered toxins with minor expression. Comparing protein family identifications by BU to the TDPs results, we were able to identify by TDPs each of the 9 protein families present in the venom in concentrations above 0.5% and an additional four protein families in the low concentration range of 0.3%–0.5%.
DISCUSSION
Snake venom toxins undergo an accelerated rate of evolution in the wild; their genes are exposed to higher rates of mutation than those expressing other proteins culminating in elevated rate of amino acid sequence variation (53, 54). These variations are often in the form of single or multiple amino acid substitutions in the toxins' primary sequence. The resulting “new” toxins have molecular weights that can differ by less than 1 Da for isobaric alterations (e.g. Ile/Leu, Lys/Gln/GlyAla) to >20 Da (Ser/Arg etc.) from the original toxin. Although whole venom LC-MS/MS cannot handle adequately the high dynamic range and GELFrEE cannot easily separate proteoforms with small mass differences, changes in isoelectric point between proteoforms can allow their separation into distinct fractions using sIEF and subsequent fragmentation during LC-MS/MS. With improved separation of proteoforms and the concomitant improvement in experimental dynamic range, sIEF enables more efficient mass spectrometric isolations that allow toxins with similar masses to be identified by automated search algorithms. In this study, venom fractionation by sIEF increased the number of protein identifications from 17 to 113 when compared with whole venom analysis using the same LC-MS/MS pipeline. The observed 664% increase in identifications exemplify the benefit of venom dynamic range reduction by prefractionation, and is analogous to a similar increase observed with Crotalus atrox venom using BU approaches (55).
The large increase in protein identification and proteoform annotation can be attributed to the capability to separate toxins that present similar physicochemical properties. As an example the mass difference between identified Oh-55 Pf 0 and Oh-55 Pf 4 is 15.93 Da, however at the 7+ charge state the two species differ by only 2.28 m/z. In this case, the isotopic envelopes overlap, complicating the efficient isolation of proteoforms using only mass-based separation. These two proteoforms have very similar amino acid composition (90% identity) and hydrophobicity, however the predicted pI difference of one unit (from 8.36 to 7.35) allowed for their complete separation by sIEF and precise analysis by dTD of the two distinct proteoforms, highlighting the importance of prefractionation for thorough characterization of venom content.
The increased sensitivity and level of protein characterization obtained by reducing venom complexity by pre-fractionation increased the opportunity to examine the specific molecular states, or proteoforms, for many of the identified proteins. Each proteoform presented here is based not only on a precursor mass (a technique that can often provide false positives because of the presence of isobaric species) but also the masses of the fragment ions produced from gas-phase dissociation of the precursor. The high confidence provided from searching with fragment ions measured at accurate mass (<10 ppm) allows for wide precursor tolerances and “delta M” mode, making it possible to identify proteins with unannotated sequence variations and PTMs. However, proteins that do not have established cleavage sites (proteolytic processing) or that are mis-annotated cannot be identified using this search type unless a large MS1 tolerance is used in an “open” and error-tolerant search strategy (56). All different branches in the search tree with distinct MS1 tolerances combined with the deep manual analysis of the obtained identifications allowed us to annotate the 53 unique proteoforms presented here. Of the 53 proteoforms characterized, the largest sequence variation observed was from the 3FTx family, which are the result of multigene families that encode multiple toxin proteoforms and is consistent with the birth-and-death model of gene family evolution (57). This source of toxin variation can now be measured precisely and is related to snakes' capability to kill different prey (58) and thus to the predator-prey arms race (59).
Toxin variation in populations is well documented in toxinology and enables snakes to adapt, occupy distinct ecological niches, and develop new toxins (36, 59). However, the underlying mechanisms that drive rapid evolutionary variation remain unclear and access to proteoform-level information can help illuminate major “hot-spots” of snake venom variation. Further, the effect of sequence variation on how PTM profiles of mature toxins in venom can now be determined. The ability to directly readout such combinatorial variation opens the possibility to survey populations and correlate the findings with snakebite pathology and antivenom strategies.
An additional level of information that may be accessed from proteoform-resolved measurements is how toxins are being processed during their maturation from the venom gland to their presence in the milked venom. The final toxin products carry information about how the toxins were proteolytically processed as they reached maturity, and if they contain any PTMs such as pyroglutamic acid, deamidation, and glycosylation. Many toxin families like ohanin, PLA2, snake venom metalloproteinases (SVMP), and cobra venom factor (CVF) are expressed as preprotoxins and the maturation process in many of these cases remains unclear or poorly studied (36).
According to the gene organization of ohanin proposed by Pung and colleagues (60) we identified six proteoforms for this toxin, including 3 proteoforms with different lengths of the mature toxin and 3 proteoforms from the propeptide region. The mature ohanin is a poorly-studied neurotoxin that induces hypolocomotion and hyperalgesia in mice and was first isolated from the venom of king cobra (61). However, there have been no previous studies about the ohanin propeptide. The presence of three propeptide proteoforms can be related to the creation of new peptides with distinct biological activity in a similar way to the prodomains of SVMP (62) or toxins in tandem expression similar to BPP-natriuretic peptides (63). The better characterization of ohanin proteoforms can provide a better understanding of how main-chain toxins and propeptides are processed in the venom gland of snakes. Also, venom degradation by endogenous proteases can generate proteolytic cleavage products and some of them are generated more abundantly during the milking and handling process in the absence of proteinase inhibitors for the metallo- and serine-proteinases present in the venom (64).
For SVMP we identified several cleavage products from the prodomain, consistent with cleavage in the venom gland lumen as observed previously (62). Prodomain degradation in small peptides has been shown to be a mechanism to generate biologically active protease inhibitors that remain inactive in the venom gland and are only activated when the venom is injected into the prey (62). The major decrease in dynamic range from extensive pre-fractionation coupled with improvements in automated MS2-based search routines and newer instrumentation (i.e. upgrading from a LTQ-XL Orbitrap to a Orbitrap Elite and a Q-Exactive HF) allowed us to identify more than 8 times more proteins than the prior work (Table I) (21) while more precisely mapping proteoforms present in the venom.
Unfortunately, dTD methodologies still have limitations for analyzing intact proteins larger than ∼50 kDa, especially those in very low concentrations in the venom, typically lower than 0.5%. The limitations in denaturing mode are related to instrumentation, reduction of signal because of multiple charge states, chemical noise, incomplete desolvation and the presence of multiple PTMs like glycosylation that can frustrate the detection of such signals (65). The use of a native fractionation technique coupled to native MS/MS mitigated many of these problems and proved to be an efficient method to analyze the largest proteins present in the venom. Further, nTD preserves the macromolecular interactions between the toxins and allow the identification and characterization of the complexes, their subunits, and the partial characterization of the glycan structures present in the LAAO complex. Access to PTM and toxin interaction information is vital for a complete venom characterization and it is the first time that this information has been obtained using MS in a toxinology study of large proteins.
In the BU comparison the only toxin family below 50 kDa that was not identified by TDPs was the natriuretic peptide family, represented in the BU identifications by the V8N2J2, a similar toxin to “Natriuretic peptide Oh-NP” (D9IX98). There is no prior protein evidence using classical biochemical methods for these gene products and the basis for protein annotation was information from the genome and transcriptome (36, 66). We suggest that sequence variance from different venom samples in addition to non-annotated cleavage sites and low concentrations may have contributed to the non-identification of this protein family by TDPs. Comparing our BU identifications to recently published papers that used BU for protein identification in O. hannah venom, we were able to identify 80 and 40% more protein families than the identifications presented by Petras et al. (21) and Vonk and co-workers (36), respectively. Notable differences may be related to the different methodologies applied, instrumentation used, and/or variation in snake venom sample (4, 7, 8). Our BU quantitation results showed large amounts of 3FTx in the venom that is consistent with the previous studies of the king cobra venom proteome (21, 36, 67) and with the rapid neurotoxicity because of muscular transmission blockage (i.e. paralysis) observed in human envenomation (68, 69). The comparison with the proteomics gold standard BU showed that TDPs is now a feasible technique for detection, identification, and characterization of even low-abundance proteoforms in snake venom. Even at <1% abundance, highly potent toxins can play import roles in human envenomation and in prey submission by themselves or through synergistic activity with the main toxins (70).
The combination of denaturing and native TDPs to explore the venom proteome of O. hannah has provided a superlative catalogue of venom protein content. Using our pipeline, the dTD approach led to the identification of 184 proteoforms from 15 protein families in a high-confidence process. These results not only represent a ∼1,100% increase in protein identification when compared with the pipeline presented by Calvete and co-workers, but also provided the first proteoform-specific look at the rapidly evolving sequences of the venom proteome. The use of nTD provided a new alternative to study toxins larger than 50 kDa including glycoproteins and their complexes. Using intact mass and fragmentation information, toxins can be identified and characterized even if not present in the protein database using de novo sequencing. The use of both nTD and dTD in “venomics” stands ready to address many of the open challenges in venom toxinology. It allows for a precise molecular catalogue of toxin proteoforms and protein complexes. Thus, TDPs is poised to provide significant contributions to snake natural history and ecology. Furthermore, better understanding of venom will generate new knowledge about snakebites and antivenom production with important impacts in human and animal health.
Supplementary Material
Footnotes
Author contributions: R.D.M., O.S.S., L.F., G.B.D., P.D.C., and N.L.K. designed research; R.D.M., O.S.S., and L.F. performed research; G.B.D., P.D.C., and N.L.K. contributed new reagents or analytic tools; R.D.M., O.S.S., and L.F. analyzed data; R.D.M., O.S.S., L.F., G.B.D., P.D.C., and N.L.K. wrote the paper.
* The W. M. Keck Foundation generously provided funding for this work. This material is based upon work supported by FAPERJ research grant 100.039/2014 from the government of Rio de Janeiro State - Brazil for R.D.M., by the Swiss National Science Foundation under Early Postdoc Mobility fellowship for L.F., and by the National Science Foundation Graduate Research Fellowship under fellowship number 2014171659 for O.S.S. The work was also supported by NIH GM 067193, and the Office for Research at Northwestern University. The content is solely the responsibility of the authors and does not necessarily represent the official views of the National Institutes of Health.
 This article contains supplemental material.
1 The abbreviations used are:
- BU
- bottom-up
- 3FTx
- three finger toxins
- AGC
- automatic gain control
- BCA
- bicinchoninic acid assay
- CRISP
- cysteine rich secretory protein
- CVF
- cobra venom factor
- DDA
- data dependent acquisition
- dTD
- denaturing top-down
- DTT
- dithiothreitol
- FDR
- false discovery rate
- GELFrEE
- gel-eluted liquid fraction entrapment electrophoresis
- HCD
- higher-energy collisional dissociation
- HexNAc
- N-acetyl hexosamine
- IGF
- insulin-like growth factor
- KNT
- Kunitz-type serine protease inhibitor
- LAAO
- L-amino acid oxidase
- LC-MS/MS
- liquid chromatography online with tandem mass spectrometry
- MS/MS
- tandem mass spectrometry
- NSAF
- normalized spectral abundance factor
- nTD
- native top-down
- OHN
- ohanin
- PLA2
- phospholipase A2
- PLRP-S
- polymeric reverse phase resin
- PTM
- post-translational modification
- sIEF
- solution isoelectric focusing
- SVMP
- snake venom metalloproteinases
- SVNGF
- snake venom nerve growth factor
- SVSP
- snake venom serine protease
- SVVEGF
- snake venom vascular endothelial growth factor
- TDP
- top-down proteomics
- WAP
- waprin.
REFERENCES
- 1. Escoubas P., and King G. F. (2009) Venomics as a drug discovery platform. Expert Rev. Proteomics 6, 221–224 [DOI] [PubMed] [Google Scholar]
- 2. McCleary R. J. R., and Kini R. M. (2013) Non-enzymatic proteins from snake venoms: A gold mine of pharmacological tools and drug leads. Toxicon 62, 56–74 [DOI] [PubMed] [Google Scholar]
- 3. Fox J. W., and Serrano S. M. T. (2005) Snake toxins and hemostasis. Toxicon 45, 949 [Google Scholar]
- 4. Georgieva D., Arni R. K., and Betzel C. (2008) Proteome analysis of snake venom toxins: pharmacological insights. Expert Rev. Proteomics 5, 787–797 [DOI] [PubMed] [Google Scholar]
- 5. Vetter I., Davis J. L., Rash L. D., Anangi R., Mobli M., Alewood P. F., Lewis R. J., and King G. F. (2011) Venomics: a new paradigm for natural products-based drug discovery. Amino Acids 40, 15–28 [DOI] [PubMed] [Google Scholar]
- 6. Hargreaves A. D., Swain M. T., Hegarty M. J., Logan D. W., and Mulley J. F. (2014) Restriction and Recruitment—Gene Duplication and the Origin and Evolution of Snake Venom Toxins. Genome Biol. Evol. 6, 2088–2095 [DOI] [PMC free article] [PubMed] [Google Scholar]
- 7. Calvete J. J. (2013) Snake venomics: From the inventory of toxins to biology. Toxicon 75, 44–62 [DOI] [PubMed] [Google Scholar]
- 8. Fox J. W., and Serrano S. M. T. (2008) Exploring snake venom proteomes: multifaceted analyses for complex toxin mixtures. Proteomics 8, 909–920 [DOI] [PubMed] [Google Scholar]
- 9. Calvete J. J., Juárez P., and Sanz L. (2007) Snake venomics. Strategy and applications. J. Mass Spectrom. 42, 1405–1414 [DOI] [PubMed] [Google Scholar]
- 10. Juárez P., Sanz L., and Calvete J. J. (2004) Snake venomics: Characterization of protein families in Sistrurus barbouri venom by cysteine mapping, N-terminal sequencing, and tandem mass spectrometry analysis. Proteomics 4, 327–338 [DOI] [PubMed] [Google Scholar]
- 11. Melani R. D., Goto-Silva L., Nogueira F. C. S. N., Junqueira M., and Domont G. B. (2014) in Venom Genomics and Proteomics, eds Gopalakrishnakone P, Calvete JJ (Springer Netherlands, Netherlands: ), pp 1–12. 1st Ed. [Google Scholar]
- 12. Compton P. D., and Kelleher N. L. (2012) Spinning up mass spectrometry for whole protein complexes. Nat. Methods 9, 1065–1066 [DOI] [PubMed] [Google Scholar]
- 13. Smith L. M., and Kelleher N. L. (2013) Proteoform: a single term describing protein complexity. Nat. Methods 10, 186–187 [DOI] [PMC free article] [PubMed] [Google Scholar]
- 14. Bogdanov B., and Smith R. D. (2005) Proteomics by FTICR mass spectrometry: Top down and bottom up. Mass Spectrom. Rev. 24, 168–200 [DOI] [PubMed] [Google Scholar]
- 15. Perry R. H., Cooks R. G., and Noll R. J. (2008) Orbitrap mass spectrometry: Instrumentation, ion motion and applications. Mass Spectrom. Rev. 27, 661–699 [DOI] [PubMed] [Google Scholar]
- 16. Tran J. C., Zamdborg L., Ahlf D. R., Lee J. E., Catherman A. D., Durbin K. R., Tipton J. D., Vellaichamy A., Kellie J. F., Li M., Wu C., Sweet S. M. M., Early B. P., Siuti N., LeDuc R. D., Compton P. D., Thomas P. M., and Kelleher N. L. (2011) Mapping intact protein isoforms in discovery mode using top-down proteomics. Nature 480, 254–258 [DOI] [PMC free article] [PubMed] [Google Scholar]
- 17. Tran J. C., and Doucette A. A. (2008) Gel-Eluted Liquid Fraction Entrapment Electrophoresis: An Electrophoretic Method for Broad Molecular Weight Range Proteome Separation. Anal. Chem. 80, 1568–1573 [DOI] [PubMed] [Google Scholar]
- 18. Tran J. C., and Doucette A. A. (2008) Rapid and Effective Focusing in a Carrier Ampholyte Solution Isoelectric Focusing System: A Proteome Prefractionation Tool. J. Proteome Res. 7, 1761–1766 [DOI] [PubMed] [Google Scholar]
- 19. LeDuc R. D., Fellers R. T., Early B. P., Greer J. B., Thomas P. M., and Kelleher N. L. (2014) The C-Score: A Bayesian Framework to Sharply Improve Proteoform Scoring in High-Throughput Top Down Proteomics. J. Proteome Res. 13, 3231–3240 [DOI] [PMC free article] [PubMed] [Google Scholar]
- 20. Zamdborg L., LeDuc R. D., Glowacz K. J., Kim Y.-B., Viswanathan V., Spaulding I. T., Early B. P., Bluhm E. J., Babai S., and Kelleher N. L. (2007) ProSight PTM 2.0: improved protein identification and characterization for top down mass spectrometry. Nucleic Acids Res. 35, W701–W706 [DOI] [PMC free article] [PubMed] [Google Scholar]
- 21. Petras D., Heiss P., Süssmuth R. D., and Calvete J. J. (2015) Venom Proteomics of Indonesian King Cobra, Ophiophagus hannah: Integrating Top-Down and Bottom-Up Approaches. J. Proteome Res. 14, 2539–2556 [DOI] [PubMed] [Google Scholar]
- 22. Skinner O. S., Havugimana P. C., Haverland N. A., Fornelli L., Early B. P., Greer J. B., Fellers R. T., Durbin K. R., Do Vale L. H. F., Melani R. D., Seckler H. S., Nelp M. T., Belov M. E., Horning S. R., Makarov A. A., LeDuc R. D., Bandarian V., Compton P. D., and Kelleher N. L. (2016) An informatic framework for decoding protein complexes by top-down mass spectrometry. Nat. Methods advance online publication, [DOI] [PMC free article] [PubMed] [Google Scholar]
- 23. Belov M. E., Damoc E., Denisov E., Compton P. D., Horning S., Makarov A. A., and Kelleher N. L. (2013) From Protein Complexes to Subunit Backbone Fragments: A Multi-stage Approach to Native Mass Spectrometry. Anal. Chem. 85, 11163–11173 [DOI] [PubMed] [Google Scholar]
- 24. Rose R. J., Damoc E., Denisov E., Makarov A., and Heck A. J. R. (2012) High-sensitivity Orbitrap mass analysis of intact macromolecular assemblies. Nat. Methods 9, 1084–1086 [DOI] [PubMed] [Google Scholar]
- 25. Ganem B., Li Y. T., and Henion J. D. (1991) Detection of noncovalent receptor-ligand complexes by mass spectrometry. J. Am. Chem. Soc. 113, 6294–6296 [Google Scholar]
- 26. Li Y. T., Hsieh Y. L., Henion J. D., Senko M. W., McLafferty F. W., and Ganem B. (1993) Mass spectrometric studies on noncovalent dimers of leucine zipper peptides. J. Am. Chem. Soc. 115, 8409–8413 [Google Scholar]
- 27. Smith R. D., Light-Wahl K. J., Winger B. E., and Loo J. A. (1992) Preservation of non-covalent associations in electrospray ionization mass spectrometry: Multiply charged polypeptide and protein dimers. Org. Mass Spectrom. 27, 811–821 [Google Scholar]
- 28. Skinner O. S., Do Vale L. H. F., Catherman A. D., Havugimana P. C., de Sousa M. V., Compton P. D., and Kelleher N. L. (2015) Native GELFrEE: A New Separation Technique for Biomolecular Assemblies. Anal. Chem. 87, 3032–3038 [DOI] [PubMed] [Google Scholar]
- 29. Loo J. A. (1997) Studying noncovalent protein complexes by electrospray ionization mass spectrometry. Mass Spectrom. Rev. 16, 1–23 [DOI] [PubMed] [Google Scholar]
- 30. Doley R., and Kini R. M. (2009) Protein complexes in snake venom. Cell. Mol. Life Sci. 66, 2851–2871 [DOI] [PMC free article] [PubMed] [Google Scholar]
- 31. Roy A., Zhou X., Chong M. Z., D'hoedt D., Foo C. S., Rajagopalan N., Nirthanan S., Bertrand D., Sivaraman J., and Kini R. M. (2010) Structural and Functional Characterization of a Novel Homodimeric Three-finger Neurotoxin from the Venom of Ophiophagus hannah (King Cobra). J. Biol. Chem. 285, 8302–8315 [DOI] [PMC free article] [PubMed] [Google Scholar]
- 32. Faure G., Xu H., and Saul F. A. (2011) Crystal Structure of Crotoxin Reveals Key Residues Involved in the Stability and Toxicity of This Potent Heterodimeric β-Neurotoxin. J. Mol. Biol. 412, 176–191 [DOI] [PubMed] [Google Scholar]
- 33. Pawelek P. D., Cheah J., Coulombe R., Macheroux P., Ghisla S., and Vrielink A. (2000) The structure of l-amino acid oxidase reveals the substrate trajectory into an enantiomerically conserved active site. EMBO J. 19, 4204–4215 [DOI] [PMC free article] [PubMed] [Google Scholar]
- 34. Rao V. S., and Kini R. M. (2002) Pseutarin C, a prothrombin activator from Pseudonaja textilis venom: Its structural and functional similarity to mammalian coagulation factor Xa-Va complex. Thromb. Haemost. 88, 611–619 [PubMed] [Google Scholar]
- 35. Rappsilber J., Mann M., and Ishihama Y. (2007) Protocol for micro-purification, enrichment, pre-fractionation and storage of peptides for proteomics using StageTips. Nat. Protoc. 2, 1896–1906 [DOI] [PubMed] [Google Scholar]
- 36. Vonk F. J., Casewell N. R., Henkel C. V., Heimberg A. M., Jansen H. J., McCleary R. J. R., Kerkkamp H. M. E., Vos R. A., Guerreiro I., Calvete J. J., Wüster W., Woods A. E., Logan J. M., Harrison R. A., Castoe T. A., Koning A. P. J. de, Pollock D. D., Yandell M., Calderon D., Renjifo C., Currier R. B., Salgado D., Pla D., Sanz L., Hyder A. S., Ribeiro J. M. C., Arntzen J. W., Thillart G. E. E. J. M. van den, Boetzer M., Pirovano W., Dirks R. P., Spaink H. P., Duboule D., McGlinn E., Kini R. M., and Richardson M. K. (2013) The king cobra genome reveals dynamic gene evolution and adaptation in the snake venom system. Proc. Natl. Acad. Sci., 201314702 [DOI] [PMC free article] [PubMed] [Google Scholar]
- 37. Meng F., Cargile B. J., Miller L. M., Forbes A. J., Johnson J. R., and Kelleher N. L. (2001) Informatics and multiplexing of intact protein identification in bacteria and the archaea. Nat. Biotechnol. 19, 952–957 [DOI] [PubMed] [Google Scholar]
- 38. Catherman A. D., Durbin K. R., Ahlf D. R., Early B. P., Fellers R. T., Tran J. C., Thomas P. M., and Kelleher N. L. (2013) Large-scale Top-down Proteomics of the Human Proteome: Membrane Proteins, Mitochondria, and Senescence. Mol. Cell. Proteomics 12, 3465–3473 [DOI] [PMC free article] [PubMed] [Google Scholar]
- 39. Ntai I., Kim K., Fellers R. T., Skinner O. S., Smith A. D., Early B. P., Savaryn J. P., LeDuc R. D., Thomas P. M., and Kelleher N. L. (2014) Applying Label-Free Quantitation to Top Down Proteomics. Anal. Chem. 86, 4961–4968 [DOI] [PMC free article] [PubMed] [Google Scholar]
- 40. Wojcik R., Dada O. O., Sadilek M., and Dovichi N. J. (2010) Simplified capillary electrophoresis nanospray sheath-flow interface for high efficiency and sensitive peptide analysis. Rapid Commun. Mass Spectrom. 24, 2554–2560 [DOI] [PubMed] [Google Scholar]
- 41. Winkler R. (2010) ESIprot: a universal tool for charge state determination and molecular weight calculation of proteins from electrospray ionization mass spectrometry data. Rapid Commun. Mass Spectrom. 24, 285–294 [DOI] [PubMed] [Google Scholar]
- 42. Strohalm M., Kavan D., Novák P., Volný M., and Havlíček V. (2010) mMass 3: A cross-platform software environment for precise analysis of mass spectrometric data. Anal. Chem. 82, 4648–4651 [DOI] [PubMed] [Google Scholar]
- 43. Fellers R. T., Greer J. B., Early B. P., Yu X., LeDuc R. D., Kelleher N. L., and Thomas P. M. (2015) ProSight Lite: Graphical software to analyze top-down mass spectrometry data. PROTEOMICS, n/a–n/a [DOI] [PMC free article] [PubMed] [Google Scholar]
- 44. Melani R. D., Araujo G. D. T., Carvalho P. C., Goto L., Nogueira F. C. S., Junqueira M., and Domont G. B.. Seeing beyond the tip of the iceberg: A deep analysis of the venome of the Brazilian Rattlesnake, Crotalus durissus terrificus. EuPA Open Proteomics, [Google Scholar]
- 45. Xu T., Venable J., Park S. K., Cociorva D., Lu B., Liao L., Wohlschlegel J., Hewel J., and Yates J. III (2006) ProLuCID, a fast and sensitive tandem mass spectra-based protein identification program. Mol. Cell. Proteomics 5, S174 [Google Scholar]
- 46. Carvalho P. C., Fischer J. S. G., Xu T., Cociorva D., Balbuena T. S., Valente R. H., Perales J., Yates J. R., and Barbosa V. C. (2012) Search engine processor: Filtering and organizing peptide spectrum matches. Proteomics 12, 944–949 [DOI] [PMC free article] [PubMed] [Google Scholar]
- 47. Paoletti A. C., Parmely T. J., Tomomori-Sato C., Sato S., Zhu D., Conaway R. C., Conaway J. W., Florens L., and Washburn M. P. (2006) Quantitative proteomic analysis of distinct mammalian Mediator complexes using normalized spectral abundance factors. Proc. Natl. Acad. Sci. 103, 18928–18933 [DOI] [PMC free article] [PubMed] [Google Scholar]
- 48. Nirthanan S., and Gwee M. C. E. (2004) Three-Finger α-Neurotoxins and the Nicotinic Acetylcholine Receptor, Forty Years On. J. Pharmacol. Sci. 94, 1–17 [DOI] [PubMed] [Google Scholar]
- 49. Peng S.-S., Kumar T. K. S., Jayaraman G., Chang C.-C., and Yu C. (1997) Solution structure of toxin b, a long neurotoxin from the venom of the King Cobra (Ophiophagus hannah). J. Biol. Chem. 272, 7817–7823 [DOI] [PubMed] [Google Scholar]
- 50. Du X.-Y., and Clemetson K. J. (2002) Snake venom l-amino acid oxidases. Toxicon 40, 659–665 [DOI] [PubMed] [Google Scholar]
- 51. Zeng L., Sun Q.-Y., Jin Y., Zhang Y., Lee W.-H., and Zhang Y. (2012) Molecular cloning and characterization of a complement-depleting factor from king cobra, Ophiophagus hannah. Toxicon 60, 290–301 [DOI] [PubMed] [Google Scholar]
- 52. Guan H.-H., Goh K.-S., Davamani F., Wu P.-L., Huang Y.-W., Jeyakanthan J., Wu W., and Chen C.-J. (2010) Structures of two elapid snake venom metalloproteases with distinct activities highlight the disulfide patterns in the D domain of ADAMalysin family proteins. J. Struct. Biol. 169, 294–303 [DOI] [PMC free article] [PubMed] [Google Scholar]
- 53. Kini R. M., and Chan Y. M. (1999) Accelerated evolution and molecular surface of venom phospholipase A2 enzymes. J. Mol. Evol. 48, 125–132 [DOI] [PubMed] [Google Scholar]
- 54. Nakashima K., Nobuhisa I., Deshimaru M., Nakai M., Ogawa T., Shimohigashi Y., Fukumaki Y., Hattori M., Sakaki Y., and Hattori S. (1995) Accelerated evolution in the protein-coding regions is universal in crotalinae snake venom gland phospholipase A2 isozyme genes. Proc. Natl. Acad. Sci. U.S.A. 92, 5605–5609 [DOI] [PMC free article] [PubMed] [Google Scholar]
- 55. Fox J. W., Ma L., Nelson K., Sherman N. E., and Serrano S. M. T. (2006) Comparison of indirect and direct approaches using ion-trap and Fourier transform ion cyclotron resonance mass spectrometry for exploring viperid venom proteomes. Toxicon 47, 700–714 [DOI] [PubMed] [Google Scholar]
- 56. Chick J. M., Kolippakkam D., Nusinow D. P., Zhai B., Rad R., Huttlin E. L., and Gygi S. P. (2015) A mass-tolerant database search identifies a large proportion of unassigned spectra in shotgun proteomics as modified peptides. Nat. Biotechnol. 33, 743–749 [DOI] [PMC free article] [PubMed] [Google Scholar]
- 57. Fry B. G., Wüster W., Kini R. M., Brusic V., Khan A., Venkataraman D., and Rooney A. P. (2003) Molecular evolution and phylogeny of elapid snake venom three-finger toxins. J. Mol. Evol. 57, 110–129 [DOI] [PubMed] [Google Scholar]
- 58. Daltry J. C., Wüster W., and Thorpe R. S. (1996) Diet and snake venom evolution. Nature 379, 537–540 [DOI] [PubMed] [Google Scholar]
- 59. Heatwole H., and Poran N. S. (1995) Resistances of sympatric and allopatric eels to Sea Snake venoms. Copeia 1995, 136–147 [Google Scholar]
- 60. Pung Y. F., Kumar S. V., Rajagopalan N., Fry B. G., Kumar P. P., and Kini R. M. (2006) Ohanin, a novel protein from king cobra venom: Its cDNA and genomic organization. Gene 371, 246–256 [DOI] [PubMed] [Google Scholar]
- 61. Pung Y. F., Wong P. T. H., Kumar P. P., Hodgson W. C., and Kini R. M. (2005) Ohanin, a novel protein from King Cobra venom, induces hypolocomotion and hyperalgesia in mice. J. Biol. Chem. 280, 13137–13147 [DOI] [PubMed] [Google Scholar]
- 62. Portes-Junior J. A., Yamanouye N., Carneiro S. M., Knittel P. S., Sant'Anna S. S., Nogueira F. C. S., Junqueira M., Magalhães G. S., Domont G. B., and Moura-da-Silva A. M. (2014) Unraveling the processing and activation of snake venom metalloproteinases. J. Proteome Res. 13, 3338–3348 [DOI] [PubMed] [Google Scholar]
- 63. James Graham R. L., Graham C., McClean S., Chen T., O'Rourke M., Hirst D., Theakston D., and Shaw C. (2005) Identification and functional analysis of a novel bradykinin inhibitory peptide in the venoms of New World Crotalinae pit vipers. Biochem. Biophys. Res. Commun. 338, 1587–1592 [DOI] [PubMed] [Google Scholar]
- 64. Tashima A. K., Zelanis A., Kitano E. S., Ianzer D., Melo R. L., Rioli V., Sant'anna S. S., Schenberg A. C. G., Camargo A. C. M., and Serrano S. M. T. (2012) Peptidomics of three Bothrops snake venoms: insights into the molecular diversification of proteomes and peptidomes. Mol. Cell. Proteomics MCP 11, 1245–1262 [DOI] [PMC free article] [PubMed] [Google Scholar]
- 65. Compton P. D., Zamdborg L., Thomas P. M., and Kelleher N. L. (2011) On the scalability and requirements of whole protein mass spectrometry. Anal. Chem. 83, 6868–6874 [DOI] [PMC free article] [PubMed] [Google Scholar]
- 66. Lei W., Zhang Y., Yu G., Jiang P., He Y., Lee W., and Zhang Y. (2011) Cloning and sequence analysis of an Ophiophagus hannah cDNA encoding a precursor of two natriuretic pepide domains. Toxicon 57, 811–816 [DOI] [PubMed] [Google Scholar]
- 67. Chang H.-C., Tsai T.-S., and Tsai I.-H. (2013) Functional proteomic approach to discover geographic variations of king cobra venoms from Southeast Asia and China. J. Proteomics 89, 141–153 [DOI] [PubMed] [Google Scholar]
- 68. Tin-Myint, Rai-Mra, Maung-Chit, Tun-Pe, and Warrell D. (1991) Bites by the King Cobra (Ophiophagus hannah) in Myanmar: Successful treatment of severe neurotoxic envenoming. QJM 80, 751–762 [PubMed] [Google Scholar]
- 69. Veto T., Price R., Silsby J. F., and Carter J. A. (2007) Treatment of the first known case of king cobra envenomation in the United Kingdom, complicated by severe anaphylaxis. Anaesthesia 62, 75–78 [DOI] [PubMed] [Google Scholar]
- 70. Bordon K. C. F., Perino M. G., Giglio J. R., and Arantes E. C. (2012) Isolation, enzymatic characterization and antiedematogenic activity of the first reported rattlesnake hyaluronidase from Crotalus durissus terrificus venom. Biochimie 94, 2740–2748 [DOI] [PubMed] [Google Scholar]
- 71. Carvalho P. C., Junqueira M., Valente R. H., and Domont G. B. (2008) Caititu: A tool to graphically represent peptide sequence coverage and domain distribution. J. Proteomics 71, 486–489 [DOI] [PubMed] [Google Scholar]
Associated Data
This section collects any data citations, data availability statements, or supplementary materials included in this article.