

Unfortunately, the original version of this article [1] contained an error due to a typographical error in the computer code used. This meant the percentage improvement over baseline of the endpoints CMTNS, ONLS, 9HPT and DML was slightly increased. Therefore some of the values in Tables 3, 4, Additional file 4: Table S4 and Fig. 4 are incorrect.
Table 3.
Response to PXT3003 on efficacy outcomes in treatment groups, with comparisons of active doses versus Placebo (Full Analysis Set, n = 80)
| Mean % of improvement | PXT3003 LD versus Placebo | PXT3003 ID versus Placebo | PXT3003 HD versus Placebo | Dose-effect | ||||||||
|---|---|---|---|---|---|---|---|---|---|---|---|---|
| Placebo | PXT3003 LD | PXT3003 ID | PXT3003 HD | Estimate | P-value | Estimate | P-value | Estimate | P-value | Correlation | P-value | |
| (n = 19) | (n = 21) | (n = 21) | (n = 19) | |||||||||
| CMTNS | −0.25 (17.3) | −3.8 (20.4) | −5.8 (17.7) | 5.2 (12.5) | −2.6 (−11.9;7.6) | 0.67 | −3.1 (−11.0;5.4) | 0.74 | 5.5 (−3.4;15.2) | 0.16 | 0.54 | 0.30 |
| ONLS | −11.8 (33.7) | −12.7 (31.7) | 1.2 (16.7) | 6.8 (18.2) | −3.9 (−14.2;7.6) | 0.72 | 6.9 (−3.8;18.8) | 0.15 | 14.4 (0.55;30.2) | 0.043* | 0.28 | 0.006* |
| 6MWT (m) | 9.0 (8.3) | 6.2 (8.3) | 6.4 (9.4) | 9.9 (6.9) | −2.4 (−6.2;1.5) | 0.85 | −2.4 (−6.6;2.0) | 0.82 | 0.7 (−3.2;4.7) | 0.38 | 0.11 | 0.16 |
| 9HPT (s) | 3.6 (10.9) | −2.5 (12) | 4.4 (9.5) | 6.1 (10.6) | −4.6 (−10.3;1.5) | 0.89 | −0.2 (−5.3;5.2) | 0.52 | 0.3 (−5.7;6.6) | 0.47 | 0.15 | 0.092 |
| Ankle Dorsiflexion (Nm) | 20.2 (88.4) | −3.6 (43.0) | 81.5 (369.6) | 20.4 (64.1) | −4.0 (−21.7;17.8) | 0.63 | 11.4 (−15.4;46.8) | 0.26 | 8.2 (−13.8;35.9) | 0.28 | 0.11 | 0.16 |
| Grip (kg) | 9.9 (24.2) | 1.3 (15.6) | 4.7 (12.5) | 11.7 (18.1) | −7.1 (−15.6;2.1) | 0.90 | −3.6 (−11.8;5.4) | 0.75 | 1.6 (−7.7;11.9) | 0.39 | 0.12 | 0.15 |
| CMAP (milliV) | 34.4 (62.0) | 1.4 (38.7) | 22.9 (62.6) | 64.2 (208.5) | −25.1 (−44.8;1.5) | 0.94 | −9.2 (−27.3;13.5) | 0.77 | −5.1 (−27.1;23.6) | 0.63 | −0.001 | 0.50 |
| MCV (m/s) | 3.7 (8.5) | 3.0 (11.5) | 5.7 (12.3) | 9.0 (17.6) | −1.0 (−6.5;4.9) | 0.61 | 0.5 (−4.8;6.2) | 0.44 | 2.8 (−3.4;9.4) | 0.23 | 0.11 | 0.18 |
| DML (ms) | −0.33 (8.7) | 0.33 (16.1) | 8.3 (18.1) | 5 (15.2) | 3.4 (−4.3;11.7) | 0.24 | 13.8 (4.2;24.3) | 0.009* | 8.0 (0.59;16.0) | 0.038* | 0.21 | 0.035* |
| SNAP (microV) | 12.4 (121.7) | 11.5 (88.2) | 23.3 (128.4) | 5.2 (69.0) | −1.2 (−42.9;71.0) | 0.52 | 8.7 (−31.2;71.6) | 0.38 | 13.9 (−24.1;71.0) | 0.29 | 0.09 | 0.30 |
| SCV (m/s) | 3.4 (11.0) | 5.3 (11.2) | 29.5 (63.4) | 30.5 (10.0) | 1.5 (−5.8;9.4) | 0.36 | 17.5 (−5.5;46.2) | 0.11† | 26.6 (15.5;38.8) | 0.00037* | 0.42 | 0.01* |
Data are mean % (s.d.) of improvement for each treatment group. Differences between treatment groups were assessed by Analysis of Covariance (ANCOVA) on log-transformed values by adjusting for baseline values. Estimates were provided as mean percentage change over baseline (90 % CI). Dose-effect was tested through Spearman’s rank correlation. P-values are one-tailed. *P < 0.05; Shading = best improvement within dosages. CMTNS Charcot-Marie-Tooth Neuropathy Score, ONLS Overall Neuropathy Limitations Scale, 6MWT 6-Minute Walk Test, 9HPT 9-Hole Peg Test, CMAP Amplitudes of Compound Muscle Action Potentials, MCV Motor Conduction Velocity, DML Distal Motor Latency, SNAP Amplitudes of Sensory Nerve Action Potentials, SCV Sensitive Conduction Velocity
Table 4.
Response to PXT3003 on efficacy outcomes in HD and in PLI, with comparisons of HD versus PLI (Full Analysis Set, n = 80)
| Mean % of improvement | PXT3003 HD versus PLI | |||
|---|---|---|---|---|
| PLI | PXT3003 HD | Estimate | P-value | |
| (n = 61) | (n = 19) | |||
| CMTNS | −3.4 (18.4) | 5.2 (12.5) | 8.0 (0.4;16.2) | 0.042* |
| ONLS | −7.7 (28.5) | 6.8 (18.2) | 12.1 (2.0;23.2) | 0.024* |
| 6MWT (m) | 7.1 (8.6) | 9.9 (6.9) | 2.6 (−0.73;6.1) | 0.099 |
| 9HPT (s) | 1.8 (11.1) | 6.1 (10.6) | 1.2 (−3.4;6.0) | 0.33 |
| Ankle Dorsiflexion (Nm) | 33.1 (223.2) | 20.4 (64.1) | 5.5 (−12.8;27.7) | 0.32 |
| Grip (kg) | 5.1 (17.9) | 11.7 (18.1) | 6.0 (−1.2;13.7) | 0.088 |
| CMAP (milliV) | 19.6 (56.5) | 64.2 (208.5) | 6.6 (−15.8;35.1) | 0.33 |
| MCV (m/s) | 4.2 (10.9) | 9.0 (17.6) | 2.5 (−2.4;7.7) | 0.21 |
| DML (ms) | 3 (15.3) | 5 (15.2) | 2.2 (−5.1;10.0) | 0.31 |
| SNAP (microV) | 15.9 (110.2) | 5.2 (69.0) | 12.0 (−23.9;64.9) | 0.31 |
| SCV (m/s) | 12.7 (38.0) | 30.5 (10.0) | 20.1 (2.4;40.8) | 0.030* |
Data are mean % (s.d.) of improvement for HD and for PLI after 12 months. Differences between treatment groups were assessed by Analysis of Covariance (ANCOVA) on log-transformed values by adjusting for baseline values. Estimates were provided as mean percentage change over baseline (90 % CI). P-values are one-tailed. *P < 0.05; Shading = best improvement within groups. CMTNS Charcot-Marie-Tooth Neuropathy Score, ONLS Overall Neuropathy Limitations Scale, 6MWT 6-Minute Walk Test, 9HPT 9-Hole Peg Test, CMAP Amplitudes of Compound Muscle Action Potentials, MCV Motor Conduction Velocity, DML Distal Motor Latency, SNAP Amplitudes of Sensory Nerve Action Potentials, SCV Sensitive Conduction Velocity
Fig. 4.
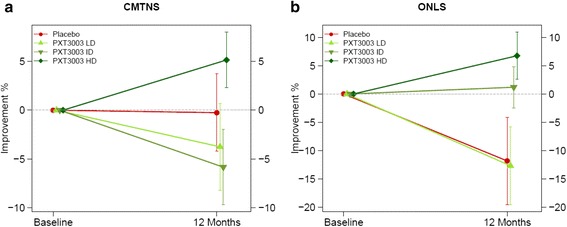
Response to PXT3003 on clinical scales (Full Analysis Set, n = 80). Mean % (s.e.m.) of improvement from baseline per group at 12 months for CMTNS (a) and ONLS (b). Sample sizes: Placebo (n = 19), LD (n = 21), ID (n = 21), HD (n = 19)
However this error has no bearing on statistical outcome of the study, the conclusions or text of the manuscript. Correct versions of Tables 3, 4 and Fig. 4 can be seen below and Additional file 4 accessed using the link below.
Additional file
Response to PXT3003 on efficacy outcomes (Full Analysis Set, n = 80). Data are mean (s.d.) baseline and final values, and % (s.d.) of improvement for each treatment group and PLI. Differences between treatment groups were assessed by Analysis of Covariance (Ancova) on log-transformed values by adjusting for baseline values. Estimates were provided as mean percentage change over baseline (90 % CI). Dose-effect was tested through Spearman’s rank correlation. P-values are one-tailed. CMTNS = Charcot-Marie-Tooth Neuropathy Score; ONLS = Overall Neuropathy Limitations Scale; 6MWT = 6-Minute Walk Test; 9HPT = 9-Hole Peg Test; CMAP = Amplitudes of Compound Muscle Action Potentials; MCV = Motor Conduction Velocity; DML = Distal Motor Latency; SNAP = Amplitudes of Sensory Nerve Action Potentials; SCV = Sensitive Conduction Velocity; VAS = Visual Analog Scale; CGI = Clinical Global Impression. (DOC 168 kb)
Footnotes
The online version of the original article can be found under doi:10.1186/s13023-014-0199-0.
References
- 1.Attarian S, Vallat JM, Magy L, Funalot B, Gonnaud PM, Lacour A, Péréon Y, Dubourg O, Pouget J, Micallef J, Franques J, Lefebvre MN, Ghorab K, Al-Moussawi M, Tiffreau V, Preudhomme M, Magot A, Leclair-Visonneau L, Stojkovic T, Bossi L, Lehert P, Gilbert W, Bertrand V, Mandel J, Milet A, Hajj R, Boudiaf L, Scart-Grès C, Nabirotchkin S, Guedj M, Chumakov I, Cohen D. An exploratory randomised double-blind and placebo-controlled phase 2 study of a combination of baclofen, naltrexone and sorbitol (PXT3003) in patients with Charcot-Marie-Tooth disease type 1A. Orphanet J Rare Dis. 2014;9:199. doi: 10.1186/s13023-014-0199-0. [DOI] [PMC free article] [PubMed] [Google Scholar]