

Abstract
Spatially distinct gene expression profiles in neural stem cells (NSCs) are a prerequisite to the formation of neuronal diversity, but how these arise from the regulatory interactions between chromatin accessibility and transcription factor activity has remained unclear. Here, we demonstrate that, despite their distinct gene expression profiles, NSCs of the mouse cortex and spinal cord share the majority of their DNase I hypersensitive sites (DHSs). Regardless of this similarity, domain-specific gene expression is highly correlated with the relative accessibility of associated DHSs, as determined by sequence read density. Notably, the binding pattern of the general NSC transcription factor SOX2 is also largely cell type specific and coincides with an enrichment of LHX2 motifs in the cortex and HOXA9 motifs in the spinal cord. Interestingly, in a zebrafish reporter gene system, these motifs were critical determinants of patterned gene expression along the rostral-caudal axis. Our findings establish a predictive model for patterned NSC gene expression, whereby domain-specific expression of LHX2 and HOX proteins act on their target motifs within commonly accessible cis-regulatory regions to specify SOX2 binding. In turn, this binding correlates strongly with these DHSs relative accessibility—a robust predictor of neighboring gene expression.
Distinct gene expression patterns in neural stem cells (NSCs) of different spatial locations are a prerequisite to the generation of neuronal diversity in the central nervous system (CNS), but how these arise from regulatory interactions between cell-type–specific chromatin profiles and transcription factor activity is less clear.
Genome-wide binding studies have revealed that transcription factors normally occupy less than a few percent of their consensus target sites present in the genome (Zaret and Carroll 2011). One important factor that affects the ability of transcription factors to bind their target motifs, and thus regulate gene expression, is the local status of chromatin compaction. The primary means of chromatin condensation is the wrapping of DNA around a histone octamer to form nucleosomes, which provide a steric hindrance to transcription factor binding (Iwafuchi-Doi and Zaret 2014). However, chromatin accessibility can also be increased in several ways, such as through shifting nucleosome positioning via ATP-dependent remodeling complexes (Boeger et al. 2003; Reinke and Hörz 2003), or via the modification of histone tail residues, which can result in the loosening of the DNA-histone interaction.
A unique feature of stem cells is their ability to activate gene expression programs of several different lineages. An important property that may facilitate this capacity is a relatively relaxed and dynamic chromatin state, which is permissive to the transcriptional machinery and thus gene activation (Meshorer et al. 2006). Examination of chromatin accessibility by mapping DNase I hypersensitive sites (DHSs) genome wide, in a large array of stem cells and their more committed progeny, has revealed that most DHSs are cell type specific. These studies have also shown that lineage specification and maturation are characterized by a general condensation of chromatin, paralleled by a selective de novo formation of open chromatin regions (Stergachis et al. 2013; Lara-Astiaso et al. 2014; Raposo et al. 2015). Interestingly, the resulting differences in the chromatin landscape that these changes bring can accurately cluster cells according to their lineage relationships (Song et al. 2011; Stergachis et al. 2013).
The transcription factor SOX2 has important regulatory roles in several stem cell populations (Sarkar and Hochedlinger 2013). Besides pluripotent stem cells, SOX2 is expressed by all NSCs in both the embryonic and adult CNS, where it has been shown to regulate fundamental processes such as stem cell maintenance, cell proliferation, and cell fate specification (Oosterveen et al. 2012; Sarkar and Hochedlinger 2013; Hagey and Muhr 2014; Nishi et al. 2015). However, despite the uniform expression of SOX2 in CNS precursor cells, its binding pattern differs substantially among different types of NSCs. For instance, less than one-quarter of the thousands of regulatory regions targeted by SOX2 in in vitro–derived NSCs are also bound by SOX2 in cortical NSCs (Hagey and Muhr 2014; Kondoh and Lovell-Badge 2015). This is likely because the binding pattern of SOX2 has been shown to be largely dependent on partner transcription factors for efficient binding to regulatory regions (Kondoh and Kamachi 2010), but how local differences in chromatin accessibility among NSCs affect and are affected by the ability of SOX2 to bind its targets is not known. In this paper, we have used genome-wide approaches to examine how chromatin accessibility and transcription factor binding control the establishment of specific gene expression in NSCs of the mouse cortex and the spinal cord.
Results
Similar chromatin patterns in cortical and spinal cord NSCs
To address how the chromatin landscape reflects gene expression differences between subpopulations of neural precursor cells, we began by characterizing the transcriptomes of NSCs from different axial levels of the neural tube. This was achieved by performing RNA sequencing and DNase I hypersensitivity mapping on CD133-sorted NSCs, isolated from the cortex or the thoracic level of the spinal cord from E11.5 mouse embryos (Fig. 1A; Supplemental Fig. S1A,B). The transcriptomes differed significantly between these axial positions of the CNS, and considering genes with an expression that differed more than threefold (P < 0.01), we confidently identified 356 genes with an expression specifically enriched in cortical NSCs, 801 genes with an expression specifically enriched in spinal cord NSCs, and 1155 genes that were commonly expressed in these two NSC populations (expression fold change difference below 1.1; P > 0.05) (Fig. 1B). Genome-wide profiling of accessible chromatin using the DFilter algorithm revealed 34,356 DHSs in cortical NSCs and 34,734 DHSs in spinal cord NSCs (Fig. 1C; Supplemental Table S1; for general statistics, see Supplemental Table S2). These are conservative numbers when compared to those identified by the alternative algorithm Fseq (Boyle et al. 2008b), which called 633,494 DHSs in cortical NSCs and 596,402 DHSs in spinal cord with default parameters (see Methods). The results were consistent with previous reported genome-wide data sets, as the vast majority of the open chromatin regions identified in cortical NSCs, and many of the open regions identified in spinal cord NSCs, have previously been identified in E14.5 mouse brain tissue (Supplemental Fig. S1C; Mouse ENCODE Consortium et al. 2012). The pattern of accessible chromatin overlapped extensively between the cortex and the spinal cord, and most of the identified DHSs (∼75%) were present in NSCs of both axial levels. Moreover, of the DHSs common to NSCs of the cortex and the spinal cord, we found that the majority were also overlapping with accessible chromatin regions in mouse endoderm, mesoderm, and ES cells (Fig. 1C,D; Supplemental Fig. S2A–C; Mouse ENCODE Consortium et al. 2012; Yue et al. 2014). In contrast, only a small minority of the cortex and spinal cord–specific DHSs were found in ES cells or progenitors of the other germ layers (Fig. 1C,D; Supplemental Fig. S2A). Also, of the DHSs specific to cortical and spinal cord NSCs, only a small number (∼5%) were within 1 kb from their closest transcriptional start sites (TSSs), whereas approximately one-third of the DHSs commonly present in NSCs and ES cells were found within 1 kb distance from promoter regions (Supplemental Fig. S2D; Song et al. 2011; Thurman et al. 2012). Together, these findings demonstrate that a substantial fraction of the DHSs that are common among the NSC subtypes are also present in ES cells and progenitors of the other germ layers. In contrast, DHSs that are specific to the cortex or spinal cord seem to have been largely formed de novo during the establishment of the nervous system, at distal chromatin regions.
Figure 1.

Chromatin landscapes in cortical and spinal cord NSCs. (A) Overview of the in vivo mRNA-seq and DNase-seq experiments. (B) Volcano plot representing genes commonly expressed (expression fold change differences ≤1.1; P ≥ 0.05) in cortical and spinal cord NSCs (black dots) and genes with differential expression (expression fold change difference ≥3; P ≤ 0.01) in NSCs of the cortex (Ctx; blue dots) and spinal cord (SC; red dots). (C) Venn diagram showing the number of total (within parentheses), unique, and overlapping DHSs in ES cells (ESC; green dashed circle), cortical NSCs (blue circle), and spinal cord NSCs (red circle). (D) Example DNase I cleavage density profiles for cortical NSCs (blue), spinal cord NSCs (red), and ES cells (green). (E) Venn diagram and bar graph comparing the enrichment of expression profiles from cortical NSCs (blue bar), spinal cord NSCs (red bar), or in both these cell types (white bar) with genes associated with region-specific (blue and red circle) or common DHSs (white region). (F) GO-enrichment specific term scores for genes associated with cortex (Ctx)-specific DHSs, spinal cord (SC)–specific DHSs, and common (ES cell, Ctx, and SC) DHSs. Light gray bars represent “Pallium development,” medium gray bars represent “Spinal cord development,” and black bars represent “Ribosome biogenesis.” (G) Scatter plot showing the number of sequence reads defining common DHSs in cortical and spinal cord NSCs, depending on whether they are associated with genes exclusively expressed in the cortex (blue dots) or spinal cord (red dots). The specific relationship between chromatin accessibility and gene expression is reflected by angle differences of the group-specific regression lines. The P-value associated with the cortex-specific data, assuming a null hypothesis where the cortex-specific and spinal cord–specific data come from the same distribution, is P < 2.2 × 10⁻¹⁶, whereas for the spinal cord–specific data, P = 2.5 × 10⁻¹⁰. Gene expression specificity, expressed versus not expressed, was defined by an RPKM-cutoff of greater than 5 and less than 1, respectively. (***) P < 0.001.
A comparison with our gene expression analysis revealed that specific, but not common, DHSs were significantly enriched around genes (within 50 kb of TSSs) with an expression pattern restricted to the corresponding tissue (Fig. 1E). Despite this, genes expressed specifically in cortical or spinal cord NSCs were highly enriched for gene ontology (GO) terms such as “pallium development” and “spinal cord development” (Supplemental Fig. S2E); the genes associated with cortex or spinal cord–specific DHSs did not get consistent fold enrichment values for these particular GO terms (Fig. 1F). However, although genes associated with cortex- and spinal cord–specific DHSs were enriched for the aforementioned terms defining CNS development, genes associated with DHSs commonly represented in NSCs and ES cells were instead enriched for terms implicated in cellular housekeeping functions, including “ribosome biogenesis” and “DNA-repair” (Fig. 1F; Supplemental Fig. S2F). Thus, the distribution of DHSs that are specific to one axial level of the CNS, but not those common to both, correlate with the expression pattern, and to some extent also with the function, of the associated genes. In line with this finding, of the enhancers represented in the VISTA Enhancer Browser (Visel et al. 2007) capable of driving transgene expression in the developing mouse CNS, the majority (78%) were overlapping with our identified DHSs, and most of these could drive transgene expression in the appropriate tissue (Supplemental Fig. S2G).
Despite the significant relationship between DHSs found only at a certain axial level of the CNS and gene expression pattern, it should be noted that genes, regardless of their specific expression pattern in the CNS, were most often associated with DHSs present both in the cortex and spinal cord (Supplemental Fig. S2H). Notably, if common DHSs were taken into account, the chromatin landscapes in cortical and spinal cord NSCs no longer mirrored the gene expression patterns of these cell types (Supplemental Fig. S2I). The abundance of common DHSs around genes with specific expression patterns raises the question of whether these exhibit quantitative differences that better reflect the activity of their associated genes. Indeed, in hematopoietic cells, the number of sequence reads defining DHSs at TSSs has previously been shown to be higher around expressed genes compared to silent genes (Boyle et al. 2008a). To examine this relationship, we analyzed the number of sequence reads defining shared DHSs associated with genes with an exclusive expression pattern in cortical or spinal cord NSCs. Interestingly, this characterization revealed a strong relationship between the number of sequence reads defining DHSs in each tissue, independent of their distance to TSS, and the specific expression pattern of their associated genes (Fig. 1G; Supplemental Fig. S2J). Hence, although the majority of open chromatin regions are represented in both cortical and spinal cord NSCs, their degree of accessibility is a significant, and better, predictor of the associated genes expression than the mere presence of DHSs.
SOX2 binds to common DHSs in a cell-type–specific manner
Because gene expression is dependent on the successful assembly of transcriptional activators at regulatory regions, we next examined how transcription factor binding correlated with axial differences in the chromatin profile. To address this issue, we focused on the key stem cell transcription factor, SOX2, both because it is highly and commonly expressed in cortical and spinal cord NSCs and because a highly related SOX binding motif was the second most commonly enriched in both cortical and spinal cord DHSs (Supplemental Fig. S3A).
To proceed, we first characterized the binding pattern of SOX2 in NSCs from either the E11.5 mouse cortex or spinal cord and compared these to the binding pattern of SOX2 in mouse ES cells. Chromatin immunoprecipitation sequencing (ChIP-seq) experiments, performed in duplicate, on spinal cord NSCs revealed thousands of bound regions (peaks), with a SOX binding sequence as the most centrally enriched motif (Fig. 2A,B; Supplemental Fig. S3B; Supplemental Tables S2, S3). The SOX motif was highly similar to the SOX2 motif that was previously identified de novo in cortical NSCs (Hagey and Muhr 2014) and ES cells (Fig. 2A; Chen et al. 2008). However, despite the sequence similarities of SOX2 target motifs in these three cell types, most of its binding was cell type specific. Of the chromatin regions targeted by SOX2 in the spinal cord, fewer than half were also bound in the cortex (Fig. 2B,C; Supplemental Fig. S3C) and only a minority (16%) of the chromatin regions bound by SOX2 in ES cells were also targeted in cortical and spinal cord NSCs (Fig. 2B,C; Supplemental Fig. S3C).
Figure 2.

Differential SOX2 binding pattern in cortical and spinal cord NSCs. (A) Centrally enriched SOX motifs in ChIP-seq peaks. P-values of best matching motifs are shown. (B) Venn diagram showing overlap in SOX2 target site selection in the cortex (blue), spinal cord (red), and ES cells (green). (C) Heatmaps of reads from replicate spinal cord SOX2 ChIP-seqs and merged SOX2 ChIP-seqs in the cortex and ES cells. (D) Venn diagram and bar graph comparing the enrichment of expression profiles from the cortex (blue bar), spinal cord (red bar), or in both these tissues (white bar) with genes associated with cell-type–specific (blue and red circle) or common SOX2 ChIP-seq peaks (white region). (E) Specific term GO enrichment scores for genes associated with cortex (Ctx)-specific SOX2 peaks, spinal cord (SC)–specific SOX2 peaks, and ES cell–specific SOX2 peaks. Light gray bars represent “Pallium development,” medium gray bars represent “Spinal cord development,” and black bars represent “In utero development.” (F) Venn diagram and bar graph showing the distribution of cortical (blue circle), spinal cord (red circle), or common (white region) SOX2 ChIP-seq peaks within regions of specific (blue and red bars) and common DHSs (white bar). (G) Read density tracks show representative examples of cell-type–specific and common SOX2 peaks and their distribution within common DHSs, found both in cortical (blue) and spinal cord (red) NSCs. (H) Scatter plot showing the number of sequence reads defining shared DHSs in the cortex and spinal cord in relation to the cellular distribution of SOX2 peaks. DHSs bound by SOX2 in cortical NSCs are shown in blue (Ctx), in spinal cord NSCs in red (SC), and in both these cell types in gray. The specific relationship between SOX2 binding and chromatin accessibility is reflected by angle differences of the group-specific regression lines compared to the regression line for all data points. The P-values are <2.2 × 10⁻¹⁶ for both the regression lines defining SOX2-bound DHSs in the cortex and the spinal cord, assuming a null hypothesis in which all points come from the same distribution. (I) Enrichment of transcription factor binding motifs in DNA regions specifically bound by SOX2 in the cortex or spinal cord. (J) Example genomic regions identified with neighboring SOX2 and LHX2 (cortex SOX2 ChIP-seq and DNase-seq data shown in blue), or SOX2 and HOXA9 (spinal cord SOX2 ChIP-seq and DNase-seq data shown in red), motif containing DNase-seq footprints. Dashed lines indicate SOX, LHX2, and HOXA9 motifs. Percentage of all neighboring footprinted motifs found with specific base pair (bp) spacing between SOX2 and LHX2 (blue; in cortex), or HOXA9 (red; in spinal cord). (***) P < 0.001.
The specific binding patterns of SOX2 in the cortex and spinal cord reflected the expression patterns and functions of the targeted genes in each tissue very well, such that genes specifically bound by SOX2 in the cortex were primarily expressed in the cortex and were significantly enriched for the GO term “Pallium development” (Fig. 2D,E). This was in contrast to genes specifically bound by SOX2 in the spinal cord, which were primarily expressed in the spinal cord and showed significant GO enrichment for the term “Spinal cord development” (Fig. 2D,E). SOX2 peaks represented both in the cortex and the spinal cord were not significantly enriched around genes with a common or specific expression pattern (Fig. 2D).
To examine if there is interdependence between the specific binding pattern of SOX2 in cortical and spinal cord NSCs and the axial differences in chromatin accessibility, we next examined the overlap between SOX2 peaks and DHSs. Although chromatin regions commonly bound by SOX2 in cortical and spinal cord NSCs were, as expected, almost exclusively overlapping with commonly represented DHSs (Fig. 2F,G), most of the cortex-specific, and a substantial fraction of the spinal cord–specific, SOX2 peaks were also overlapping with common represented DHSs (Fig. 2F,G). Notably, although cell-type–specific SOX2 peaks were often overlapping with DHSs common to the cortex and spinal cord, by measuring the number of sequence reads defining the common DHSs, we found a significant relationship between SOX2 binding and the degree of chromatin accessibility in each tissue (Fig. 2H).
That the axial distribution of DHSs was unable to explain the region-specific binding pattern of SOX2 raises the possibility that its binding profile is instead dictated by the restricted expression of necessary partner factors. To address this idea, we examined DNA regions specifically bound by SOX2 in the cortex or spinal cord for their distinct enrichment of transcription factor binding motifs. In the cortex, we identified a strong enrichment of LHX2 motifs in SOX2-bound regions (46% of SOX2 peaks) (Fig. 2I), although these were negatively enriched in regions bound by SOX2 in the spinal cord (Supplemental Fig. S3D). In these regions, we instead identified an enrichment of HOXA9 motifs (22% of SOX2 peaks) (Fig. 2I), which were then underrepresented in SOX2-bound regions in the cortex (Supplemental Fig. S3D). In line with these findings, LHX2 is specifically expressed in NSCs of the cortex, whereas HOXA9 is specifically expressed in the spinal cord (Supplemental Fig. S3E,F). Thus, the specific target selection of SOX2 in the cortex and spinal cord strongly correlates with the presence of LHX2 and HOXA9 motifs, respectively. Interestingly, by analyzing the nuclease cleavage profiles in our DNase-seq data sets, we identified pairs of nuclease resistant SOX and LHX motifs in cortical NSCs, and protected pairs of SOX and HOX motifs in the spinal cord NSC data, each with a distinct pattern of motif spacing (Fig. 2J). Hence, these footprint signatures imply that SOX and LHX2 motifs and SOX and HOXA9 motifs can be simultaneously and stably bound by their corresponding transcription factors in cortical and spinal cord NSCs, respectively.
LHX2 and HOXA9 motifs confer cell-type–specific enhancer activity to SOX2-bound chromatin
That DNA elements specifically bound by SOX2 in the cortex or spinal cord are enriched for binding motifs of transcription factors that are restricted to distinct areas of the CNS, indicates that these genomic regions may be involved in activating gene expression at specific axial levels of the neural tube. To address this possibility, a selection of SOX2-bound DNA regions, conserved from zebrafish to human, were inserted into GFP reporter constructs that were subsequently injected into zebrafish eggs (for selection and genomic locations of SOX2-bound regions, see Methods) (Fig. 3A; Supplemental Fig. S4A,B). Of the reporters containing regulatory regions commonly bound by SOX2 in the cortex and spinal cord (Fig. 3B), seven of eight activated GFP expression throughout the rostro-caudal axis of the neural tube 50–55 h after injection (Fig. 3B; Supplemental Fig. S4A). In contrast, of the genomic regions selectively bound by SOX2 in the cortex, a majority (34 of 42) reliably activated GFP expression specifically in the forebrain (Fig. 3C; Supplemental Fig. S4B), whereas most of the regulatory regions specifically bound by SOX2 in the spinal cord (17 out of 22) exclusively activated GFP expression in the caudal neural tube (Fig. 3D; Supplemental Fig. S4A). Together, these findings demonstrate that genomic elements bound by SOX2 in the mouse cortex or spinal cord can robustly function as enhancers that drive gene expression at the corresponding anterior–posterior level of the zebrafish neural tube.
Figure 3.

SOX2 acts with LHX2 and HOX factors to specify regionalized gene expression. (A) Overview of GFP reporter experiments in zebrafish embryos. (B–D) Representative examples of resulting transgenic zebrafish embryos after the injection of GFP reporters containing enhancer elements commonly (B) or specifically bound by SOX2 in the mouse cortex (C) or spinal cord (D). Spatial activity of transgenic enhancers is reported by GFP expression (white staining). Tracks depict SOX2 ChIP-seq reads in the cortex (blue) and spinal cord (red). (E) Activity of a transgenic enhancer bound by SOX2 in the mouse cortex upon mutation of SOX or LHX motifs (stars). (F) Transgenic activity of an enhancer bound by SOX2 in the mouse spinal cord upon mutation of SOX or HOX motifs (stars). (G) Activity of GFP reporters containing either a wild-type enhancer active in the forebrain, its synthetic version in which the nucleotide sequence, apart from the intact LHX and SOX motifs, have been randomized, or a version in which the LHX motif was swapped for HOX, PBX, and MEIS motifs. (H) Activity of GFP reporters containing either a wild-type enhancer active in the caudal neural tube, its synthetic version in which the nucleotide sequence, apart from the intact HOX, PBX, MEIS, and SOX motifs, has been randomized, or an enhancer version in which its HOX, PBX, and MEIS motifs were swapped for LHX motifs. (I,J) Luciferase reporter assay in P19 cells. Luciferase reporters containing either wild-type enhancers active in the forebrain (I) or in the caudal neural tube (J) were cotransfected with different combinations of vectors expressing SOX2, LHX2, HOXB6, PBX3, or MEIS1 proteins (I,J). Other enhancers examined consisted of variants in which either the transcription factor binding motifs or their flanking sequences were mutated, or variants in which the LHX motifs and HOX, PBX, and MEIS motifs had been interchanged. (*) 0.05 > P > 0.01; (**) 0.01 > P > 0.001.
To examine how SOX2-bound regulatory elements achieved their spatial specificity in the neural tube, we mutated their SOX motifs, LHX motifs in forebrain enhancers, or HOX, PBX, and MEIS motifs in enhancers active in the caudal neural tube. Importantly, mutations of LHX motifs or HOX, PBX, and MEIS motifs ablated most enhancer activity in both the forebrain and caudal neural tube, respectively (Fig. 3E,F; Supplemental Fig. S5A,B). The enhancers active in the caudal neural tube were generally less dependent on the presence of SOX motifs because only one of four enhancers lost its ability to activate reporter expression in the absence of intact SOX motifs (Fig. 3F; Supplemental Fig. S5B) compared to four of four forebrain enhancers with mutated SOX motifs (Fig. 3E; Supplemental Fig. S5A). Despite this, morpholinos targeting Sox2, together with its SoxB1 homolog Sox3, completely blocked the activity of the coinjected reporters, both in the forebrain and in the caudal part of the neural tube (Supplemental Fig. S5A,B).
To examine whether these transcription factor binding motifs were also sufficient to drive specific enhancer activity, we generated reporters containing enhancers in which all nucleotide sequences apart from the SOX and LHX motifs or SOX, HOX, PBX, and MEIS motifs had been randomized (synthetic) (Fig. 3G,H). Indeed, SOX motifs together with LHX motifs, or together with HOX, PBX, and MEIS motifs, were sufficient to endow the synthetic enhancers with forebrain or caudal neural tube activity, respectively (Fig. 3G,H; Supplemental Fig. S5A,B). Moreover, by replacing LHX motifs in forebrain enhancers with HOX, PBX, and MEIS motifs, and vice versa in caudal enhancers (swap) (Fig. 3G,H), the activities of the enhancers along the rostral-caudal axis were completely re-specified (Fig. 3G,H; Supplemental Fig. S5A,B). Thus, these experiments demonstrate that SOX and LHX motifs, as well as SOX, HOX, PBX, and MEIS motifs, are not only necessary, but also sufficient to specify cell-type–specific gene expression in the developing CNS. However, it is important to point out that because the examined DNA elements are conserved from zebrafish to human, they are likely to contain other motifs than just these for LHX and HOX that are important for robust enhancer activity. Consistent with this, although the synthetic enhancers maintained the integrity of the SOX, LHX, and HOX motifs, they had a reduced ability to activate reporter expression in the zebrafish brain and spinal cord in comparison with their unmodified enhancer counterparts.
Although the enhancer analysis in zebrafish embryos argues for interdependence between the SOX and LHX motifs and between SOX and HOX motifs, we next conducted immunoprecipitation (IP) experiments to examine whether SOX2 could physically interact with LHX2 and HOXB6 proteins; a HOX chosen for its broad expression, which better matched that of our reporters than HOXA9 (Mallo and Alonso 2013; Philippidou and Dasen 2013). Indeed, SOX2 interacted efficiently with both LHX2 and HOXB6 in transfected HEK293 cells (Supplemental Fig. S6). Consistent with these findings, luciferase reporter assays in the mouse embryonic carcinoma cell line P19 demonstrated that an enhancer active in the zebrafish forebrain could be induced specifically and in an additive manner by SOX2 or LHX2 proteins (Fig. 3I). In contrast, an enhancer active in the caudal neural tube was instead induced by SOX2 and HOXB6, in combination with its partner factors PBX3 and MEIS1 (Fig. 3J). Mutation of SOX and LHX motifs in the forebrain enhancer decreased the ability of SOX2 and LHX2 to activate luciferase expression (Fig. 3I). However, although mutation of the HOX motifs in the caudal enhancer reduced the capacity of HOXB6 to induce luciferase expression, mutation of the SOX motifs had, similar to the situation in the zebrafish embryo, only a limited effect on the reporter activation (Fig. 3J). Moreover, the synthetic versions of the forebrain and caudal enhancers could be specifically activated by a combination of SOX2/LHX2 and SOX2/HOXB6, respectively (Fig. 3I,J), and swapping LHX for HOX motifs, and vice versa, altered the response of the mutated enhancers to LHX2 and HOXB6 proteins in a consistent manner (Fig. 3I,J). Thus, although the enhancer active in the zebrafish forebrain responds specifically to SOX2 and LHX2 proteins, the enhancer active in the caudal part of the neural tube was instead activated by SOX2 and HOXB6 proteins in combination with its partner factors PBX3 and MEIS1.
Quantitative differences in chromatin accessibility predicts gene activity
Our findings argue that the cell-type–specific binding pattern of SOX2, within a permissive chromatin landscape, can be explained by the specific distribution of SOX2 partner factors. In turn, these findings raise the possibility that the redistribution of HOX expression would be sufficient to induce an ectopic transcriptional profile in cortical NSCs. To address this issue, we used in utero electroporation to misexpress HOXB6 or HOXA9 in NSCs of E13.5 cortices. After 16–20 h, electroporated cortices were processed for fluorescent-activated cell sorting (FACS) and RNA-seq, or immunohistochemistry (Fig. 4A). In comparison with GFP, misexpression of HOXB6 resulted in up-regulation of 54 genes and down-regulation of 49 genes more than fourfold (Fig. 4B). Interestingly, the up-regulated genes were significantly enriched for spinal cord–specific genes (Fig. 4C; Supplemental Fig. S7A), whereas the down-regulated genes were significantly enriched for cortex genes (Fig. 4C; Supplemental Fig. S7A). Moreover, immunohistochemistry analysis, using antibodies targeting proteins encoded by the spinal cord–specific Ascl1 and Prdm12 genes, revealed that >80% of the Hoxb6- or Hoxa9-electroporated cortical cells up-regulated ectopic expression of proteins predominantly expressed in the spinal cord (Fig. 4D; Supplemental Fig. S7B).
Figure 4.
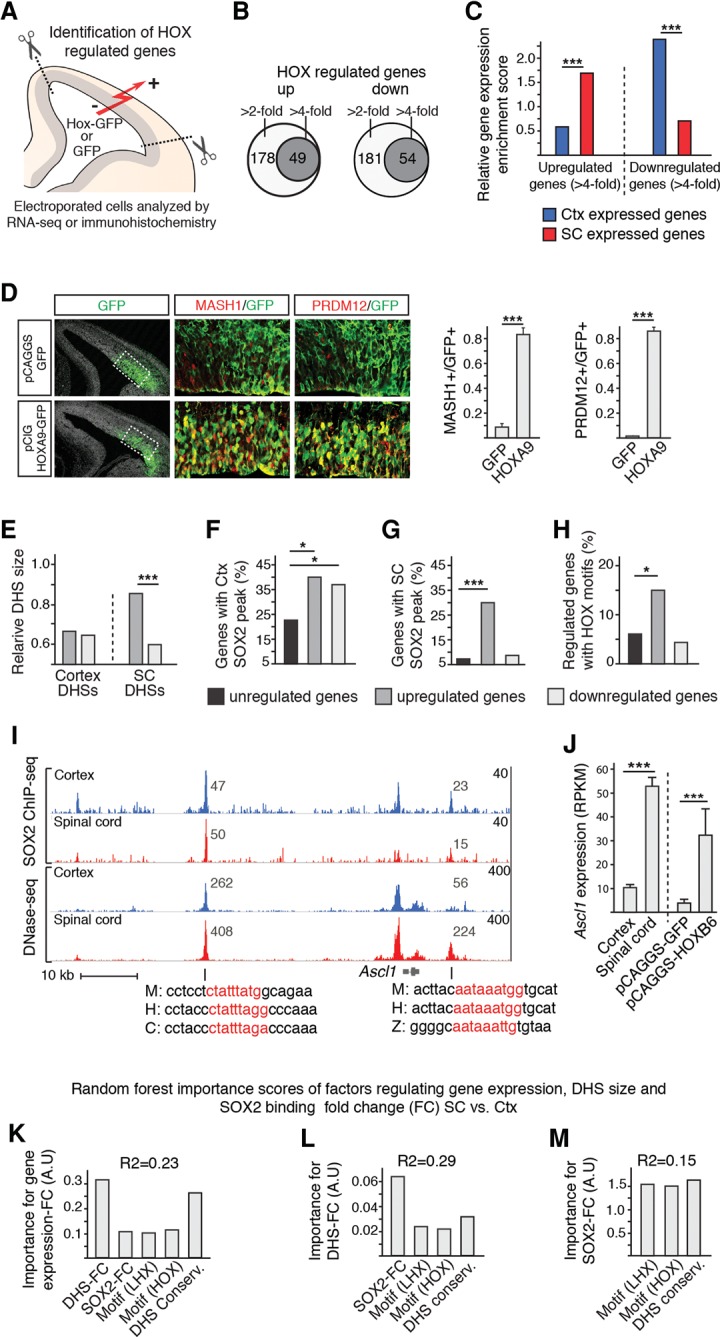
Prediction of gene expression specificity in cortical and spinal cord NSCs. (A) Overview of experimental design for identification of HOX regulated genes in E13.5 mouse cortex. (B) Venn diagrams showing the number of genes up- and down-regulated more than two- and fourfold in cortical NSCs after Hoxb6 electroporation. (C) Bar graph showing, as relative gene expression enrichment scores, that spinal cord genes are predominantly up-regulated and that cortex genes are predominantly down-regulated in cortical NSCs upon Hoxb6 electroporation. (D) Immunohistochemical analysis of Hoxa9-electroporated cortices demonstrates a broad up-regulation of MASH1 and PRDM12, which are normally expressed predominantly in the spinal cord. (E) Relative size, as defined as number of sequence reads, of cortical and spinal cord DHSs associated with genes up- and down-regulated more than fourfold. (F,G) Enrichment of cortex (F) and spinal cord (G) SOX2 peaks around genes up- and down-regulated more than fourfold by HOXB6 misexpression. Genes that change <1.1-fold are defined as unregulated. (H) Percentage of genes, up- and down-regulated more than fourfold, associated with accessible chromatin in the cortex and containing HOX motifs. (I) Tracks around the ectopically up-regulated Ascl1 gene. Tracks show overlapping SOX2 peaks and DHSs containing conserved HOX motifs (red letters in mouse [M], human [H], chicken [C], and zebrafish [Z] sequences) in the cortex (blue tracks) and spinal cord (red tracks). Note size differences (read values inset) of DHSs in the cortex and spinal cord. (J) Bar graph shows RPKM values of Ascl1 in cortical and spinal cord NSCs under normal conditions and in cortical NSCs after GFP or Hoxb6 electroporation. (K–M) Random forest importance scores of regulatory features controlling gene expression fold change (FC) (K), DHS-FC (L), and SOX2-FC (M) in spinal cord versus cortical NSCs. (*) 0.05 > P > 0.01; (***) P < 0.001.
To gain insights into the mechanism by which the ectopically expressed genes were deregulated, we analyzed their associated regulatory features, including DHS profiles, SOX2 binding, and enrichment of HOX motifs. Although all of the up-regulated genes were associated with DHSs within 50 kb of TSS in the cortex and spinal cord (Supplemental Fig. S7C), the size of their DHSs was significantly larger in the spinal cord (Fig. 4E). In contrast to the down-regulated genes, the up-regulated genes were also enriched for SOX2 binding in both the cortex and spinal cord (Fig. 4F,G; Supplemental Fig. S7D), although they were underrepresented for cortex-specific SOX2 binding (Supplemental Fig. S7E). Moreover, of the genes deregulated upon HOX misexpression, mostly the up-regulated genes were associated with HOX motifs (Fig. 4H; Supplemental Fig. S7F). Thus, although all of the genes up- or down-regulated by HOX are associated with open chromatin in the cortex, only the activated genes are enriched for HOX motifs and SOX binding both in the cortex and the spinal cord. To illustrate, of the spinal cord–specific genes ectopically up-regulated in the cortex (Fig. 4I,J; Supplemental Fig. S7G), all were associated with common DHSs, which were bound by SOX2 in both the cortex and spinal cord, and contained conserved HOX motifs.
Finally, to identify features important for the establishment of gene expression differences in the CNS, we took advantage of our genome-wide data sets to generate a statistical model for gene expression in cortical and spinal cord NSCs. To achieve this, random forest and linear regression models were derived from a training set of SOX2-bound genes and used to predict gene expression in the remaining test set. These data sets revealed a hierarchical model in which the fold change (FC) values of sequence reads defining DHS size in the spinal cord versus the cortex (DHS-FC) had by far the greatest predictive power for gene expression in the spinal cord versus the cortex (expression-FC) (Fig. 4K). In turn, DHS-FC was most dependent on relative SOX2 binding (SOX2-FC), which in the cortex could be predicted by the abundance of LHX2 motifs, and by the abundance of HOX motifs in the spinal cord (Fig. 4L,M; Supplemental Fig. S8). Interestingly, sequence conservation was consistently a strong predictor of all of these features, possibly indicating the importance of undefined features within the open chromatin regions. Together, these findings resulted in a formulation whereby the relative values for DHS size, DHS conservation, SOX2 binding, and LHX and HOX motifs were the most relevant features for predicting gene expression specificity in NSCs of the anterior–posterior CNS (Supplemental Fig. S8).
Discussion
Spatially distinct gene expression in NSCs is essential for the formation of a functional CNS, but how this arises from the regulatory interactions between chromatin profiles and transcription factor activity has remained elusive. Here, we have addressed this issue by characterizing the accessibility of cis-regulatory regions and the binding of the key stem cell transcription factor SOX2. Our data provide insights into how distinct transcription factor complexes can act on a permissive chromatin landscape to establish distinct gene expression patterns in CNS stem cells.
Previous studies that have characterized the chromatin profile in cells of different lineages and of different developmental stages have revealed that the majority of the identified DHSs are cell type specific (Thurman et al. 2012; Stergachis et al. 2013). In fact, used as a fingerprint, the distribution of open chromatin efficiently separates cells according to their lineage relationships (Song et al. 2011; Stergachis et al. 2013). These cell-type–specific chromatin landscapes are the combined result of extensive heterochromatinization and establishment of de novo DHSs during lineage specification and cell maturation (Stergachis et al. 2013; Lara-Astiaso et al. 2014). For instance, a comparison of the accessible chromatin present in a mature cell type to that in ES cells indicates that approximately one-third of DHSs are retained from pluripotent stem cell stages (Stergachis et al. 2013). In our analysis, rather than comparing different cellular lineages or cells of different maturation stages, we focused on NSCs with distinct positional identities in the cortex and spinal cord. We found that the majority of the accessible DNA regions are present in both of these NSC populations, and most of these can be already identified in ES cells. In contrast, open chromatin regions specifically found in the cortex and the spinal cord appear to have been mostly newly formed during CNS development. Moreover, although DHSs specific to rostral or caudal NSCs were significantly more associated with genes expressed at the corresponding level of the CNS, shared DHSs were evenly distributed among genes with a specific and nonspecific expression pattern. Thus, as a consequence of the high number of common DHSs, the overall pattern of open chromatin found in cortical and spinal cord NSCs failed to reflect region-specific gene expression profiles.
By analyzing DHSs in more than 100 different cell types, it has previously been demonstrated that the vast majority (∼95%) of these are located distally (>2.5 kb) to TSSs (Song et al. 2011; Thurman et al. 2012), and distal DHSs, in comparison with promoter DHSs, are largely cell type specific (Song et al. 2011; Thurman et al. 2012). In this respect, it is interesting to note that >35% of the DHSs commonly represented in NSCs and in ES cells were located proximal (within 1 kb) to TSSs, ∼55% were found within 10 kb of TSSs, but DHSs found specifically in the cortical or spinal cord NSCs were almost exclusively located more distally. One possibility is that common DHSs, of which many were already present in pluripotent stem cells, are more important for general cellular functions in the newly formed CNS. In contrast, distally located DHSs, of which a large portion have been generated de novo specifically in the developing cortex and spinal cord, may be more essential to neural cell fate decisions. Consistent with this idea, although genes associated with common DHSs gave high GO enrichment scores for general cellular terms such as “ribosome biogenesis” and “DNA repair,” genes associated with cell-type–specific DHSs gave high enrichment scores for terms such as “pallium development” and “spinal cord development.” Moreover, previous ChIP-seq experiments in neural cells have demonstrated that the SOX2 homolog, SOX3, primarily binds genes regulating neural development and neural fate decisions through distal chromatin regions, whereas genes involved in cellular “housekeeping” functions are bound via more proximal regions (Bergsland et al. 2011).
Although SOX proteins generally depend on an interaction with partner transcription factors (Kondoh and Kamachi 2010) to increase their binding stability to DNA, partner factor interactions are anticipated to also specify their target selection and gene regulatory functions. Thus, the cell-type–specific binding and activity of SOX proteins are likely to some extent be ascribed to the spatial distribution of their partner factors. For instance, despite its uniform expression in NSCs, SOX2 has been implicated in specifying positional identities along the dorsal–ventral axis of the spinal cord (Oosterveen et al. 2012; Peterson et al. 2012). Furthermore, genome-wide binding studies suggest that the role of SOX2 in neural pattern formation may be mediated through an interaction with different cell fate specifying homeodomain and bHLH transcription factors, which are expressed in discrete domains of the ventricular zone (Nishi et al. 2015). Furthermore, in this study, we have demonstrated that SOX2 is also involved in specifying positional identities along the anterior–posterior axis of the CNS. Our data indicate that differences in the binding pattern and function of SOX2 in NSCs of the cortex and spinal cord are not primarily explained by variations in chromatin accessibility. Rather, differences in the binding pattern and function of SOX2 appear to be achieved through an interaction with LHX2 in the cortex and with HOX proteins in the caudal CNS. Consistently, LHX2 has previously been assigned an important role in specifying cortical identities in NSCs (Mangale et al. 2008), whereas HOX proteins can induce caudal properties in neural cells (Philippidou and Dasen 2013). Supportive of the idea that LHX2 and HOXA9 proteins promote the specific binding patterns of SOX2, our statistical model revealed that the enrichment of LHX2 and HOX motifs was important for predicting SOX2 binding in the cortex and the spinal cord. However, shared chromatin landscapes between cells with distinct gene expression profiles are not unique to the developing CNS. For instance, in regulatory T cells, the late acting lineage specifying transcription factor, FOXP3, has been shown to exploit open chromatin regions that are established during previous differentiation stages and that are maintained by prebinding partner factors (Samstein et al. 2012). Moreover, the dependence of partner factors in defining a cell-type–specific binding pattern and function in the developing CNS is not only a characteristic of SOX proteins. For example, although the motor neuron determinant ISL1 promotes the generation of spinal motor neurons when misexpressed in conjunction with NGN2 and LHX3 in ES cells (Mazzoni et al. 2013), replacing LHX3 with PHOX2A does not only alter the binding pattern of ISL1, but alters also the subtype of the neurons generated from spinal to cranial motor neurons (Mazzoni et al. 2013).
Our findings have resulted in an equation that attempts to explain gene expression differences between NSCs in the cortex and the spinal cord. According to this statistical model, fold change differences in the number of sequence reads defining DHS size is the most important feature in explaining expression differences of associated genes, followed by conservation of DNA regions, fold change differences in SOX2 binding, and finally enrichment of LHX2 and HOXA9 motifs. One possible explanation for the importance of quantitative differences of DHSs in predicting gene expression specificity is that it reflects the collective binding of factors necessary to drive the expression of the nearby gene. It is interesting that when analyzing the regulatory regions around genes ectopically up-regulated in the cortex upon HOX misexpression, we observed that these genes were associated with accessible chromatin in the cortex, which was also targeted by SOX2 and enriched for HOX motifs. Thus, a commonality among the genes that were up-regulated by HOX is that they are associated with regulatory features resembling those found in the environment in which they are normally expressed. Finally, although this study focuses on NSCs with distinct positional identities, common regulatory landscapes have, as mentioned above, been described for cell types of other lineages (Wu et al. 2011; Samstein et al. 2012), and the spatial distribution of cofactors has also been shown to influence the binding pattern of more ubiquitously expressed transcription factors (Mazzoni et al. 2013). Thus, it is likely that our findings regarding chromatin accessibility and transcription factor activity can be applied to gene expression specification in stem cell populations outside the CNS.
Methods
ChIP-seq
Approximately 50 thoracic region spinal cords from E11.5 mouse embryos were used as input for the ChIP-seq protocol, which was performed according to Hagey and Muhr (2014). Experiments were performed in duplicate. Peak calling from ChIP-seq data for identifying potential SOX2 binding sites was done with SISSRS (version from 2009-02-19) (Jothi et al. 2008). The further characterization of SOX2 binding in the different cell types was based on consensus SOX2 peak sets.
DNase-seq
Cortices or thoracic region spinal cords from E11.5 mouse embryos were dissociated using Neural Tissue Dissociation Kits (P) according to the manufacturer's protocol (Miltenyi Biotec). Approximately 30 million NSCs were isolated by MACS using anti-Prominin-1 microbeads. After three rounds of NSC purification, nuclei extraction and DNase I (60 U/mL) digestion were performed according to Ling and Waxman (2013a,b). Separation of DNA fragment ß was performed on a continuous sucrose gradient (10%–40%). After fractionation and qPCR analyses, libraries were prepared and sequenced on an Illumina Genome Analyzer IIx. Identification of open chromatin regions from DNase-seq data (peak calling) was done using DFilter (v 1.0) (Kumar et al. 2013) with settings “-refine -std=4.” The same settings were used to identify DHSs in duplicate endoderm, mesoderm, and ES cells DNase-seq experiments, with consensus DHS sets used for further downstream analysis. When identifying DHSs with Fseq (Boyle et al. 2008b), default parameters were used except for “-f 0,” which is recommended for DHS peak calling.
RNA-seq
Cortices or thoracic region spinal cords from E11.5 mouse embryos were dissociated using Neural Tissue Dissociation Kits (P) according to the manufacturer's protocol (Miltenyi Biotec). NSCs were isolated by MACS using anti-Prominin-1 microbeads. After three rounds, mRNA was extracted using RNeasy mini kit (Qiagen), libraries were prepared, and sequenced on Illumina Genome Analyzer IIx. Sequencing reads were mapped to the mm9 genome assembly with STAR (v. 2.3) (Dobin et al. 2013), and gene-level quantification was done using Ensembl 67 gene annotations with HTSeq (v. 0.5.1) (Anders et al. 2015) for read counts and rpkmforgenes.py (Ramsköld et al. 2009) for RPKM values. Differential expression analysis to identify genes preferentially expressed in either spinal cord or cortex was done with DESeq2 (Love et al. 2014). The RNA-seq experiments are based on biological triplicates.
Peak overlapping, Centrimo, and heatmaps
DHS and SOX2 ChIP-seq regions were operated on using the Galaxy tools (Blankenberg et al. 2001; Giardine et al. 2005; Goecks et al. 2010) available at https://usegalaxy.org. SOX2 ChIP-seq peak regions were extended by 100 bp in both directions, and FASTA files of these regions were used as input into MEME-ChIP 4.10.2 (Machanick and Bailey 2011). Spinal cord SOX2 ChIP-seq peak regions were checked for read enrichment in each biological replicate, as well as in the cortex and ESC SOX2 ChIP-seq data sets using SeqMiner1.2 (Ye et al. 2011).
Zebrafish and luciferase experiments
To select putative tissue-specific enhancers for zebrafish and luciferase assays, we first defined SOX2 ChIP-bound regions enriched in either tissue using DiffBind (Ross-Innes et al. 2012) on output from SISSRS. We further required that the regions be conserved from zebrafish to human according to the phylop30way track in the UCSC Genome Browser (Karolchik et al. 2004). Regions were then manually selected based on RNA-seq log fold change and statistical significance as reported by DESeq2. Regions were synthesized by Genscript between BglII and XhoI sites, with orientation to TSS. These were then subcloned into an E1b-GFP-Tol2 vector (Birnbaum et al. 2012) or TKmax-luciferase reporters. Transposase mRNA was transcribed in vitro from linearized (NotI) pCS2-Transposase vector (Clark et al. 2011) using mMessage mMachine SP6 kit (Ambion). Zebrafish fertilized eggs were injected with 1–2 nL of solution (50 ng/µL plasmid DNA and 20 ng/µL transposase mRNA) at the one-cell stage. GFP expression was observed at 50–55 h after injection, and the number of live and GFP positive embryos were recorded. Motif mutations were achieved through 2-nt exchange of SOX, HOX, LHX, PBX, or MEIS core motifs. Enhancer DNA was randomized using this website: http://www.faculty.ucr.edu/~mmaduro/random.htm. Morpholinos were obtained from Gene Tools LLC, and morpholino knockdown experiments were performed as previously described (Okuda et al. 2010). Luciferase experiments were performed in P19 cells essentially as described in Bergsland et al. (2011).
Data access
Sequence data generated for this study have been submitted to the NCBI Sequence Read Archive (SRA; http://www.ncbi.nlm.nih.gov/sra) under accession number SRP069283.
Acknowledgments
We thank T. Perlmann and J. Holmberg for comments on the manuscript and members of the Muhr laboratories for fruitful discussions and advice. This research was supported by grants from the Swedish Research Council, The Swedish Cancer Foundation, and The Knut and Alice Wallenberg Foundation.
Footnotes
[Supplemental material is available for this article.]
Article published online before print. Article, supplemental material, and publication date are at http://www.genome.org/cgi/doi/10.1101/gr.203513.115.
References
- Anders S, Pyl PT, Huber W. 2015. HTSeq—a Python framework to work with high-throughput sequencing data. Bioinformatics 31: 166–169. [DOI] [PMC free article] [PubMed] [Google Scholar]
- Bergsland M, Ramsköld D, Zaouter C, Klum S, Sandberg R, Muhr J. 2011. Sequentially acting Sox transcription factors in neural lineage development. Genes Dev 25: 2453–2464. [DOI] [PMC free article] [PubMed] [Google Scholar]
- Birnbaum RY, Clowney EJ, Agamy O, Kim MJ, Zhao J, Yamanaka T, Pappalardo Z, Clarke SL, Wenger AM, Nguyen L, et al. 2012. Coding exons function as tissue-specific enhancers of nearby genes. Genome Res 22: 1059–1068. [DOI] [PMC free article] [PubMed] [Google Scholar]
- Blankenberg D, Kuster GV, Coraor N, Ananda G, Lazarus R, Mangan M, Nekrutenko A, Taylor J. 2001. Galaxy: a web-based genome analysis tool for experimentalists. Wiley, Hoboken, NJ. [DOI] [PMC free article] [PubMed] [Google Scholar]
- Boeger H, Griesenbeck J, Strattan JS, Kornberg RD. 2003. Nucleosomes unfold completely at a transcriptionally active promoter. Mol Cell 11: 1587–1598. [DOI] [PubMed] [Google Scholar]
- Boyle AP, Davis S, Shulha HP, Meltzer P, Margulies EH, Weng Z, Furey TS, Crawford GE. 2008a. High-resolution mapping and characterization of open chromatin across the genome. Cell 132: 311–322. [DOI] [PMC free article] [PubMed] [Google Scholar]
- Boyle AP, Guinney J, Crawford GE, Furey TS. 2008b. F-Seq: a feature density estimator for high-throughput sequence tags. Bioinformatics 24: 2537–2538. [DOI] [PMC free article] [PubMed] [Google Scholar]
- Chen X, Xu H, Yuan P, Fang F, Huss M, Vega VB, Wong E, Orlov YL, Zhang W, Jiang J, et al. 2008. Integration of external signaling pathways with the core transcriptional network in embryonic stem cells. Cell 133: 1106–1117. [DOI] [PubMed] [Google Scholar]
- Clark KJ, Urban MD, Skuster KJ, Ekker SC. 2011. Transgenic zebrafish using transposable elements. Methods Cell Biol 104: 137–149. [DOI] [PMC free article] [PubMed] [Google Scholar]
- Dobin A, Davis CA, Schlesinger F, Drenkow J, Zaleski C, Jha S, Batut P, Chaisson M, Gingeras TR. 2013. STAR: ultrafast universal RNA-seq aligner. Bioinformatics 29: 15–21. [DOI] [PMC free article] [PubMed] [Google Scholar]
- Giardine B, Riemer C, Hardison RC, Burhans R, Elnitski L, Shah P, Zhang Y, Blankenberg D, Albert I, Taylor J, et al. 2005. Galaxy: a platform for interactive large-scale genome analysis. Genome Res 15: 1451–1455. [DOI] [PMC free article] [PubMed] [Google Scholar]
- Goecks J, Nekrutenko A, Taylor J, Galaxy Team T. 2010. Galaxy: a comprehensive approach for supporting accessible, reproducible, and transparent computational research in the life sciences. Genome Biol 11: R86. [DOI] [PMC free article] [PubMed] [Google Scholar]
- Hagey DW, Muhr J. 2014. Sox2 acts in a dose-dependent fashion to regulate proliferation of cortical progenitors. Cell Rep 9: 1908–1920. [DOI] [PubMed] [Google Scholar]
- Iwafuchi-Doi M, Zaret KS. 2014. Pioneer transcription factors in cell reprogramming. Genes Dev 28: 2679–2692. [DOI] [PMC free article] [PubMed] [Google Scholar]
- Jothi R, Cuddapah S, Barski A, Cui K, Zhao K. 2008. Genome-wide identification of in vivo protein–DNA binding sites from ChIP-Seq data. Nucleic Acids Res 36: 5221–5231. [DOI] [PMC free article] [PubMed] [Google Scholar]
- Karolchik D, Hinrichs AS, Furey TS, Roskin KM, Sugnet CW, Haussler D, Kent WJ. 2004. The UCSC Table Browser data retrieval tool. Nucleic Acids Res 32: D493–D496. [DOI] [PMC free article] [PubMed] [Google Scholar]
- Kondoh H, Kamachi Y. 2010. SOX–partner code for cell specification: regulatory target selection and underlying molecular mechanisms. Int J Biochem Cell Biol 42: 391–399. [DOI] [PubMed] [Google Scholar]
- Kondoh H, Lovell-Badge R. 2015. Sox2: biology and role in development and disease. Elsevier Science, New York. [Google Scholar]
- Kumar V, Muratani M, Rayan NA, Kraus P, Lufkin T, Ng H-H, Prabhakar S. 2013. Uniform, optimal signal processing of mapped deep-sequencing data. Nat Biotechnol 31: 615–622. [DOI] [PubMed] [Google Scholar]
- Lara-Astiaso D, Weiner A, Lorenzo-Vivas E, Zaretsky I, Jaitin DA, David E, Keren-Shaul H, Mildner A, Winter D, Jung S, et al. 2014. Immunogenetics. Chromatin state dynamics during blood formation. Science 345: 943–949. [DOI] [PMC free article] [PubMed] [Google Scholar]
- Ling G, Waxman DJ. 2013a. DNase I digestion of isolated nulcei for genome-wide mapping of DNase hypersensitivity sites in chromatin. Methods Mol Biol 977: 21–33. [DOI] [PMC free article] [PubMed] [Google Scholar]
- Ling G, Waxman DJ. 2013b. Isolation of nuclei for use in genome-wide DNase hypersensitivity assays to probe chromatin structure. Methods Mol Biol 977: 13–19. [DOI] [PMC free article] [PubMed] [Google Scholar]
- Love MI, Huber W, Anders S. 2014. Moderated estimation of fold change and dispersion for RNA-seq data with DESeq2. Genome Biol 15: 550. [DOI] [PMC free article] [PubMed] [Google Scholar]
- Machanick P, Bailey TL. 2011. MEME-ChIP: motif analysis of large DNA datasets. Bioinformatics 27: 1696–1697. [DOI] [PMC free article] [PubMed] [Google Scholar]
- Mallo M, Alonso CR. 2013. The regulation of Hox gene expression during animal development. Development 140: 3951–3963. [DOI] [PubMed] [Google Scholar]
- Mangale VS, Hirokawa KE, Satyaki PRV, Gokulchandran N, Chikbire S, Subramanian L, Shetty AS, Martynoga B, Paul J, Mai MV, et al. 2008. Lhx2 selector activity specifies cortical identity and suppresses hippocampal organizer fate. Science 319: 304–309. [DOI] [PMC free article] [PubMed] [Google Scholar]
- Mazzoni EO, Mahony S, Closser M, Morrison CA, Nedelec S, Williams DJ, An D, Gifford DK, Wichterle H. 2013. Synergistic binding of transcription factors to cell-specific enhancers programs motor neuron identity. Nat Neurosci 16: 1219–1227. [DOI] [PMC free article] [PubMed] [Google Scholar]
- Meshorer E, Yellajoshula D, George E, Scambler PJ, Brown DT, Misteli T. 2006. Hyperdynamic plasticity of chromatin proteins in pluripotent embryonic stem cells. Dev Cell 10: 105–116. [DOI] [PMC free article] [PubMed] [Google Scholar]
- Mouse ENCODE Consortium, Stamatoyannopoulos JA, Snyder M, Hardison R, Ren B, Gingeras T, Gilbert DM, Groudine M, Bender M, Kaul R, et al. 2012. An encyclopedia of mouse DNA elements (Mouse ENCODE). Genome Biol 13: 418. [DOI] [PMC free article] [PubMed] [Google Scholar]
- Nishi Y, Zhang X, Jeong J, Peterson KA, Vedenko A, Bulyk ML, Hide WA, McMahon AP. 2015. A direct fate exclusion mechanism by Sonic hedgehog-regulated transcriptional repressors. Development 142: 3286–3293. [DOI] [PMC free article] [PubMed] [Google Scholar]
- Okuda Y, Ogura E, Kondoh H, Kamachi Y. 2010. B1 SOX coordinate cell specification with patterning and morphogenesis in the early zebrafish embryo. PLoS Genet 6: e1000936. [DOI] [PMC free article] [PubMed] [Google Scholar]
- Oosterveen T, Kurdija S, Alekseenko Z, Uhde CW, Bergsland M, Sandberg M, Andersson E, Dias JM, Muhr J, Ericson J. 2012. Mechanistic differences in the transcriptional interpretation of local and long-range Shh morphogen signaling. Dev Cell 23: 1006–1019. [DOI] [PubMed] [Google Scholar]
- Peterson KA, Nishi Y, Ma W, Vedenko A, Shokri L, Zhang X, McFarlane M, Baizabal J-M, Junker JP, van Oudenaarden A, et al. 2012. Neural-specific Sox2 input and differential Gli-binding affinity provide context and positional information in Shh-directed neural patterning. Genes Dev 26: 2802–2816. [DOI] [PMC free article] [PubMed] [Google Scholar]
- Philippidou P, Dasen JS. 2013. Hox genes: choreographers in neural development, architects of circuit organization. Neuron 80: 12–34. [DOI] [PMC free article] [PubMed] [Google Scholar]
- Ramsköld D, Wang ET, Burge CB, Sandberg R. 2009. An abundance of ubiquitously expressed genes revealed by tissue transcriptome sequence data. PLoS Comput Biol 5: e1000598. [DOI] [PMC free article] [PubMed] [Google Scholar]
- Raposo AASF, Vasconcelos FF, Drechsel D, Marie C, Johnston C, Dolle D, Bithell A, Gillotin S, van den Berg DLC, Ettwiller L, et al. 2015. Ascl1 coordinately regulates gene expression and the chromatin landscape during neurogenesis. Cell Rep 10: 1544–1556. [DOI] [PMC free article] [PubMed] [Google Scholar]
- Reinke H, Hörz W. 2003. Histones are first hyperacetylated and then lose contact with the activated PHO5 promoter. Mol Cell 11: 1599–1607. [DOI] [PubMed] [Google Scholar]
- Ross-Innes CS, Stark R, Teschendorff AE, Holmes KA, Ali HR, Dunning MJ, Brown GD, Gojis O, Ellis IO, Green AR, et al. 2012. Differential oestrogen receptor binding is associated with clinical outcome in breast cancer. Nature 481: 389–393. [DOI] [PMC free article] [PubMed] [Google Scholar]
- Samstein RM, Arvey A, Josefowicz SZ, Peng X, Reynolds A, Sandstrom R, Neph S, Sabo P, Kim JM, Liao W, et al. 2012. Foxp3 exploits a pre-existent enhancer landscape for regulatory T cell lineage specification. Cell 151: 153–166. [DOI] [PMC free article] [PubMed] [Google Scholar]
- Sarkar A, Hochedlinger K. 2013. The sox family of transcription factors: versatile regulators of stem and progenitor cell fate. Cell Stem Cell 12: 15–30. [DOI] [PMC free article] [PubMed] [Google Scholar]
- Song L, Zhang Z, Grasfeder LL, Boyle AP, Giresi PG, Lee B-K, Sheffield NC, Gräf S, Huss M, Keefe D, et al. 2011. Open chromatin defined by DNaseI and FAIRE identifies regulatory elements that shape cell-type identity. Genome Res 21: 1757–1767. [DOI] [PMC free article] [PubMed] [Google Scholar]
- Stergachis AB, Neph S, Reynolds A, Humbert R, Miller B, Paige SL, Vernot B, Cheng JB, Thurman RE, Sandstrom R, et al. 2013. Developmental fate and cellular maturity encoded in human regulatory DNA landscapes. Cell 154: 888–903. [DOI] [PMC free article] [PubMed] [Google Scholar]
- Thurman RE, Rynes E, Humbert R, Vierstra J, Maurano MT, Haugen E, Sheffield NC, Stergachis AB, Wang H, Vernot B, et al. 2012. The accessible chromatin landscape of the human genome. Nature 489: 75–82. [DOI] [PMC free article] [PubMed] [Google Scholar]
- Visel A, Minovitsky S, Dubchak I, Pennacchio LA. 2007. VISTA Enhancer Browser—a database of tissue-specific human enhancers. Nucleic Acids Res 35: D88–D92. [DOI] [PMC free article] [PubMed] [Google Scholar]
- Wu W, Cheng Y, Keller CA, Ernst J, Kumar SA, Mishra T, Morrissey C, Dorman CM, Chen KB, Drautz D, et al. 2011. Dynamics of the epigenetic landscape during erythroid differentiation after GATA1 restoration. Genome Res 21: 1659–1671. [DOI] [PMC free article] [PubMed] [Google Scholar]
- Ye T, Krebs AR, Choukrallah MA, Keime C, Plewniak F, Davidson I, Tora L. 2011. seqMINER: an integrated ChIP-seq data interpretation platform. Nucleic Acids Res 39: e35. [DOI] [PMC free article] [PubMed] [Google Scholar]
- Yue F, Cheng Y, Breschi A, Vierstra J, Wu W, Ryba T, Sandstrom R, Ma Z, Davis C, Pope BD, et al. 2014. A comparative encyclopedia of DNA elements in the mouse genome. Nature 515: 355–364. [DOI] [PMC free article] [PubMed] [Google Scholar]
- Zaret KS, Carroll JS. 2011. Pioneer transcription factors: establishing competence for gene expression. Genes Dev 25: 2227–2241. [DOI] [PMC free article] [PubMed] [Google Scholar]