

Abstract
We have evaluated the effect of peripheral insulin deficiency on brain insulin pathway activity in a mouse model of type-1 diabetes, the parallels with Alzheimer’s disease (AD) and the effect of treatment with insulin.
Nine weeks of insulin-deficient diabetes significantly impaired the learning capacity of mice, significantly reduced IDE protein expression and significantly reduced phosphorylation of the insulin-receptor and AKT. Phosphorylation of GSK3 was also significantly decreased, indicating increased GSK3 activity. This evidence of reduced insulin-signaling was associated with a concomitant increase in tau phosphorylation and amyloid β protein levels. Changes in phosphorylation levels of insulin receptor, GSK3 and tau were not observed in the brain of db/db mice, a model of type-2 diabetes, after a similar duration (8 weeks) of diabetes. Treatment with insulin from onset of diabetes partially restored the phosphorylation of insulin receptor and of GSK3, partially reduced the level of phosphorylated tau in the brain and partially improved learning ability in insulin-deficient diabetic mice.
Our data indicate that mice with systemic insulin deficiency display evidence of reduced insulin-signaling pathway activity in the brain that is associated with biochemical and behavioral features of AD, and that it can be corrected by insulin treatment.
Keywords: Brain, Diabetes, Insulin pathway, Tau, Amyloid β
Introduction
Insulin signal transduction involves the phosphatidylinositol 3-kinase (PI3K)-protein kinase B (PKB or AKT) pathway with the downstream involvement of glycogen synthase kinase-3 (GSK3), an enzyme whose activity is down-regulated by phosphorylation at serine 21 of GSK3α and serine 9 of the GSK3β isoform (Cross et al. 1995; Sutherland et al. 1993). There is emerging evidence that insulin-signaling pathways are impaired in the brain of Alzheimer’s disease (AD) patients, with reduced expression of insulin receptor and insulin-degrading enzyme (IDE), and increased GSK3 activity (Cook et al. 2003; Frolich et al. 1998; Perez et al. 2000; Steen et al. 2005). Dysregulation of GSK3 activity has been linked to several pathologies (Jope and Johnson 2004), including accumulation of amyloid β and hyperphosphorylated tau, both of which are hallmarks of AD.
Impaired insulin-signaling is also fundamental to the development of diabetes mellitus and can arise either from insulin deficiency (type-1 diabetes) or insulin resistance (type-2 diabetes). There is an increasing awareness that diabetes has an impact on the central nervous system, with reports of impaired learning, memory, mental flexibility and problem solving being more common in both type-1 and type-2 diabetic subjects than in the general population (Biessels et al. 2008; Cukierman et al. 2005; Desrocher and Rovet 2004; Manschot et al. 2006; McCarthy et al. 2002; Reaven et al. 1990; Ryan et al. 1985; Ryan and Williams 1993). Autopsy studies have also noted degeneration of the cerebral cortex (Araki et al. 1994; Reske-Nielsen and Lundbaek 1968) and neuronal loss (DeJong 1977) in diabetic patients, and diabetes has been associated with an increase risk of developing AD (Leibson et al. 1997; Ott et al. 1996; Peila et al. 2002; Yoshitake et al. 1995).
There is currently substantial interest in the potential for insulin resistance in the brain to contribute to impaired insulin-signaling and downstream pathological events (Cole et al. 2007; de la Monte and Wands 2005; Reagan 2007), but the potential for systemic insulin deficiency during type-1 diabetes to also disrupt insulin-signaling in the CNS has not been explored to the same extent. We therefore investigated whether biochemical disorders identified in the brain of animal models of AD were also present in mice with streptozotocin (STZ)-induced, insulin-deficient diabetes and compared them to db/db mice, a model of type-2 diabetes. We measured the expression and phosphorylation (indicative of activation state) of elements of the insulin-signaling pathway, the expression of IDE, and also expanded our study to include well-recognized hallmarks of AD such as amyloid β accumulation and increased tau phosphorylation. Learning and memory abilities were also assessed using the Barnes maze test. In addition, to determine whether any effects on the insulin-signaling pathway in the CNS were due to hypoinsulinemia and not to STZ toxicity, we examined key elements of the insulin-signaling pathway in the brain of diabetic mice treated with low levels of insulin that did not reverse hyperglycemia..
Materials and methods
Animals
All studies were performed using adult male Swiss Webster or db/db mice (Harlan Industries, San Diego CA, USA). Animals were housed 4–5 per cage with free access to food and water and maintained in a vivarium approved by the American Association for the Accreditation of Laboratory Animal Care. All animal studies were carried out according to protocols approved by the Institutional Animal Care and Use Committee of the University of California San Diego. Seven to 11 mice were used per group.
Induction of diabetes
Insulin-deficient diabetes was induced following an overnight fast by i.p. injection of streptozotocin (STZ, Sigma. St, Louis, MO) at 90 mg/kg dissolved in 0.9% sterile saline on 2 successive days. Hyperglycemia was confirmed using a strip-operated reflectance meter in a blood sample obtained by tail prick four days after STZ injection and in another sample collected at the conclusion of the study. db/db mice develop spontaneous hyperglycemia after 4–8 weeks of age.
Accelerating rotarod task
Mice were place on a rotarod (TSE systems, Midland, MI, USA) that accelerated from 4 to 40 rpm over 5 minutes. Latency to loss of balance was recorded. The test was performed at 8 weeks of diabetes, prior to the Barnes circular maze task.
Barnes circular maze task
The Barnes circular maze consists of an illuminated white circular platform with 20 holes (5 cm diameter) equally spaced and located 5 cm from the perimeter. A black escape box was placed under one of the holes. A cue was placed behind the hole with the escape box. On the first day of training, the mouse was placed in the escape box for one minute before the trial began. The mouse was then placed in the middle of the platform and allowed to explore the maze. Timing of the session ended when the mouse found the box or after 5 minutes had elapsed. At the end of the session, the mouse was left or placed in the escape box for one additional minute. Mice were trained to find the escape box for 5 days and then left untested for 4 weeks. At 8 weeks of diabetes, the testing session started with the escape box in a different location (2nd location) than in the training sessions 4 weeks earlier and was identified with a new, distinct cue. The original cue still marked the location of the original box (1st location). Times to find the 1st and 2nd box location were recorded. The session was repeated for 5 consecutive days.
In the insulin treatment study, mice were not exposed to the maze until 8 weeks of diabetes. Learning to find the location of the escape box was tested over 5 consecutive days at 8 weeks of diabetes.
Treatment
Insulin was administered to a group of STZ-diabetic Swiss Webster mice via slowly dissolving insulin implants (Linshin, Scarborough, Canada) placed subcutaneously. Mice received constant exposure to 0.3U insulin/24hr from onset of diabetes.
Tissue preparation
After 9 weeks of diabetes, mice were sacrificed by decapitation under isoflurane anesthesia. Caution was taken to remove the brain within a minute of decapitation to preserve phosphorylation. Brains (without cerebellum) were then homogenized in buffer (50 mM Tris-HCl pH7.4, 150 mM NaCl, 0.5% Triton X, 1 mM EDTA, protease inhibitor cocktail) and stored in aliquots at −80°C. A fraction of the homogenate was boiled for 5 minutes under detergent-free conditions, and insoluble material removed from the heat-stable supernatant by centrifugation for 30 minutes. Heat-stable supernatants (about 7µg protein) were prepared with an equal volume of Laemmli SDS sample buffer for Western-blotting for tau. Protein concentration was assessed using the bicinchoninic acid method (BCA protein assay kit, Pierce, Rockford, IL, USA).
Western blotting
Brain tissue homogenates were centrifuged (14,000 × g) and aliquots of the clear extract boiled in Laemmli LDS sample buffer (Invitrogen, Carlsbad, CA, USA). Seven to 15 µg of total extract protein were separated on 4–12% SDS-PAGE Tris-glycine gels (Novex, Invitrogen, Carlsbad, CA, USA) and immunoblotted on nitrocellulose. Blots were incubated with antibodies against phospho-insulin receptor (phosphorylated Ser 972, 1/1200, Upstate, Temecula, CA, USA), insulin receptor (1/200, Chemicon International, Temecula, CA, USA), PI3K (p85 subunit, 1/5000, Upstate, Temecula, CA, USA), PDK1 (1/1000, Cell Signaling technology, MA, USA), phospho-AKT (phosphorylated Ser 473) and AKT (1/1000, Cell Signaling technology, MA, USA), phospho-GSK3β and phospho GSK3 α/β (phospho-Ser9 and phospho Ser21/Ser9; 1/1000, Cell Signaling technology, USA), GSK3α/β (1/5000, Chemicon International, Temecula, CA, USA), CDK5 (1/200, Santa Cruz Biotechnology, Inc., CA, USA), PHF-1 (1/1000, generously provided by Dr. Peter Davies, Albert Einstein Institute), phospho-tau and Tau-5 (phospho-Thr 231, 1/3000, Biosource, Camarillo, CA, USA), full-length (FL) APP (mouse monoclonal, clone 22C11, 1/20,000, Chemicon International, Temecula, CA, USA), Aβ (mouse monoclonal, clone 6E10, 1/1000, Signet Laboratories, Dedham, MA, USA), APP C-terminal fragments (CTFs, rabbit polyclonal CT15, 1/2500, courtesy of Dr. E. Koo, UCSD), followed by secondary antibodies tagged with horseradish peroxidase (HRP, 1/5000 or 1/10000, Santa Cruz Biotechnology, Inc., CA, USA). Blots were developed using an ECL Western-blotting protocol (Enhanced Chemiluminescence, Amersham Pharmacia Biotech, UK). For sequential analysis of Western-blot membranes, previously bound antibodies were removed with stripping buffer (Pierce, Rockford, IL, USA). Quantification of immunoreactivity was performed by densitometric scanning using Quantity One software (BioRad, San Diego, CA, USA). For each animal, band intensities were normalized by calculating the ratio of the intensity of the band corresponding to primary antigen of interest to the intensity of the band corresponding to total protein (non-phosphorylated) and/or to actin. To allow grouping of samples run on different gels, actin-normalized densitometric measures of band intensity for each animal were then expressed as a percentage of the group mean of all samples from control mice present on the same gel.
HBA1c and insulin levels
Glycemic control was tested by measuring HbA1c levels in dry blood (Biosafe Laboratories Inc., Chicago) and plasma insulin levels were measured using an ELISA kit (Mouse insulin, Mercodia, Sweden).
Statistical analysis
Behavioral data are expressed as group median ± interquartiles and the difference between groups was analyzed using Wilcoxon rank test for non-parametric data. All other data are expressed as group mean ± SEM and differences between groups were analyzed using unpaired t tests between control and diabetic groups and using one-way Anova followed by Bonferronni’s post-hoc test for more than 2 groups comparison.
Results
Diabetes
Swiss Webster diabetic mice exhibited hyperglycemia (blood sugar >270 mg/dl) 4 days after STZ-injection and were uniformly above the upper limit of detection (600 mg/dl) at sacrifice (Table 1). Insulin levels were uniformly under the limit of detection of our assay (0.1 µg/l) for STZ-diabetic mice. db/db diabetic mice exhibited hyperglycemia by 40 days of age (353 ± 30 mg/dl) and at termination, about 8 weeks later (351±26 mg/dl).
Table 1.
Physiologic parameters of control and diabetic Swiss-Webster mice after 9 weeks of diabetes.
| N | Weight (g) |
Blood glucose (mg/dl) |
Rotarod (time to fall in s) |
|
|---|---|---|---|---|
| Control | 8 | 35 ± 0.5 | 128 ± 6 | 300 (297–300) |
| STZ-Diabetic | 7 | 28 ± 0.8*** | > 600 | 294 (236–300) |
p< 0.01,
p<0.001, by unpaired t test versus control.
Weight and blood glucose values are given as mean ± sem and Rotarod data are given as median (25%–75% percentile).
Rotarod task
After 8 weeks of diabetes, no significant difference in motor ability was observed in the rotarod task between control and STZ-diabetic mice (Table 1).
Barnes circular maze task
Control and STZ-diabetic Swiss Webster mice were initially trained for 5 consecutive days following 4 weeks of diabetes. On the first day of the training session, both control and diabetic mice visited the same number of holes during exploration of the maze (control = 36±7 vs diabetic = 31±5 holes visited) and by day 5, the median time to find the escape box was similar between the two groups (Figure 1B, day 5). Mice were untested for 4 further weeks before being tested for 5 consecutive days after 8 weeks of diabetes. The location of the escape box was changed (2nd location) and marked by a new distinct cue. The original cue remained at the location to which mice had been trained at 4 weeks (1st location). The time to find the 1st and the 2nd location was recorded to give an indice of long-term memory and ability to learn a new task, respectively. With this paradigm, on the first day of testing (day 40), the median time to find the 1st location by control mice remained similar to that seen at the end of the training period (day 5), indicating retention of both procedural and spatial memory. After 8 weeks of diabetes, diabetic mice showed an impaired ability to find the 1st location of the escape box (Figure 1B, day 40). However, by the second day of testing (day 41), diabetic mice found the 1st location of the escape box with a similar time than that of control (Figure 1B, dotted lines), suggesting that spatial memory of the 1st location remained, but that diabetic mice had to be reminded of the procedure. When analyzing the time to find the 2nd location of the escape box, diabetic mice showed a significant reduced capacity to learn the new location (Figure 1B, solid lines). The time to find the 2nd location of the box for diabetic mice was similar to that of control mice only after 4 days of testing (Figure 1B, day 43). This was not due to lack of exploration, as the rate of holes visited was similar in control and diabetic mice (control = 9 holes/min vs diabetic = 8 holes/min).
Figure 1.

Time to find the escape box in the Barnes circular maze task for control (squares) and diabetic (triangles) mice. Time to find the location of the original box (1st location) is represented by the dotted lines and time to find the second location of the box is represented by solid lines. Data are represented as Median ± interquartiles for non-parametric data. *p<0.05, **p<0.01 by Wilcoxon rank test versus control.
Insulin receptor phosphorylation
Total insulin receptor protein was not affected by diabetes, whereas phosphorylation levels of insulin receptor at serine 972 (upper band) were reduced at 4 weeks of diabetes and further significantly (p<0.01) reduced in the brain of diabetic mice after 9 weeks of diabetes (Figure 2). The lower band observed on the western blot for pIR may represent Insulin Growth Factor-1 receptor as there is high sequence homology with the insulin receptor and cross-reactivity cannot be discounted using our pIR antibody. This band was not quantified.
Figure 2.

Effects of diabetes on insulin receptor phosphorylation. (A) Western blots of brain homogenates from mice diabetic for 9 weeks for phosphorylated insulin receptor (pIR, upper band), insulin receptor (IR) and actin. (B) Intensity of bands corresponding to phosphorylated and total insulin receptor. Data for control (C) mice are represented by white bars, for diabetic (D) mice at 4 weeks (4w) of diabetes by grey bars and at 9 weeks (9w) of diabetes by black bars. Data are mean+SEM, n=7/group. pIR/IR is the ratio of the intensity of the bands corresponding to phosphorylated insulin receptor over the intensity of the bands corresponding to total insulin receptor. pIR/Actin is the ratio of the intensity of the bands corresponding to phosphorylated insulin receptor over the intensity of the bands corresponding to actin. IR/Actin is the ratio of the intensity of the bands corresponding to total insulin receptor over the intensity of the bands corresponding to actin. *p<0.05; **p<0.01 by one-way Anova versus control, followed by Bonferronni’s post-hoc test.
PI3K/AKT/GSK3 signaling pathway
Immunoblot analysis showed that PI3K protein expression was not significantly different from control levels after 9 weeks of diabetes but tended to decrease (Figure 3) while the other downstream elements of the signaling pathway, such as PDK1 expression and AKT phosphorylation were significantly (p< 0.05 vs control) reduced after 9 weeks of diabetes (Figure 3). Phosphorylation of GSK3α and β was reduced at 4 weeks of diabetes and further reduced to a significant level (p<0.05 vs control) in diabetic mice brain after 9 weeks of diabetes, while total GSK3 protein levels were unchanged (Figure 4).
Figure 3.

Effects of diabetes on PI3K/AKT signaling pathway. (A) Western blots of mouse brain homogenates for PI3K, PDK1, phosphorylated AKT (p-AKT), total AKT (AKT) and actin. (B) Intensity of bands corresponding to PI3K, PDK1 and phosphorylated AKT. Data for control mice are represented by white bars and for diabetic mice after 9 weeks of diabetes by black bars. Data are mean+SEM, n=5/group. *p<0.05 by unpaired t test versus control.
Figure 4.

Effect of diabetes on GSK3α and GSK3β phosphorylation. (A) Western blots and intensity of bands from mouse brain homogenates for phosphorylated GSK3α at serine 21(p-GSK3α) and total GSK3α (GSK3α). (B) Western blots and intensity of bands from mouse brain homogenates for phosphorylated GSK3β at serine 9 (p-GSK3β) and total GSK3β (GSK3β). Phosphorylation of serine 21 and serine 9 of GSK3α and GSK3β isoforms, respectively, results in inactivation of the enzyme.
pGSK3/GSK3 is the ratio of the intensity of the bands corresponding to phosphorylated GSK3 over the intensity of the bands corresponding to total GSK3. pGSK3/Actin is the ratio of the intensity of the bands corresponding to phosphorylated GSK3 over the intensity of the bands corresponding to actin. GSK3/Actin is the ratio of the intensity of the bands corresponding to total GSK3 over the intensity of the bands corresponding to actin. Western blots were performed with brain homogenates obtained from control and STZ-diabetic mice that were diabetic for 9 weeks. Data for control (C) mice are represented by white bars, for diabetic (D) mice at 4 weeks (4w) of diabetes by grey bars and at 9 weeks (9w) of diabetes by black bars. Data are mean+SEM, n=7/group. *p<0.05; **p<0.01 by one-way Anova versus control, followed by Bonferronni’s post-hoc test.
Tau phosphorylation
Diabetes induced a gradual increase of tau phosphorylation, as detected by antibodies directed at the phosphorylated threonine 231 site, that reached significance after 9 weeks of diabetes (p<0.05, Figure 5). A similar increase in tau phosphorylation was detected using the PHF-1 antibody (data not shown), while phosphorylation at serine 262 was unchanged (data not shown).
Figure 5.

Effect of diabetes on tau phosphorylation. (A) Western blots of brain homogenates from mice diabetic for 9 weeks for phosphorylated tau at threonine 231 and total tau. (B) Intensity of bands corresponding to phosphorylated tau. Data for control (C) mice are represented by white bars, for diabetic (D) mice at 4 weeks (4w) of diabetes by grey bars and at 9 weeks (9w) of diabetes by black bars. Data are mean+SEM, n=7/group. The data represent the ratio ptau/tau of the intensity of the bands corresponding to phosphorylated tau at threonine 231 over the intensity of the bands corresponding to total tau. *p<0.05 by one-way Anova versus control, followed by Bonferronni’s post-hoc test.
APP metabolism
Protein levels of full length APP (FL-APP) and APP C-terminal fragments (CTF-APP) were similar in brains of control and diabetic mice (Figure 6), whereas Aβ protein was significantly increased (p<0.05) in the brain of diabetic mice after 9 weeks of diabetes.
Figure 6.

Effects of diabetes on APP metabolism. (A) Western blots of mouse brain homogenates for full length APP (FL-APP), C-terminal fragment of APP (CTF-APP) and their corresponding actin and foramyloid β (Aβ) and its corresponding actin. (B) Intensity of bands corresponding to full length APP (FL-APP), C-terminal fragment of APP (CTF-APP), amyloid β (Aβ). Data from control mice are represented by white bars and from diabetic mice after 9 weeks of diabetes by black bars. Data are mean+SEM, n=5/group for FL-APP and CTF-APP and n=10/group for Aβ. *p<0.05 by unpaired t test versus control.
Insulin-degrading enzyme
Diabetes induced a progressive reduction of insulin-degrading enzyme (IDE) protein expression in the brain of mice that reached significance after 9 weeks of diabetes (Figure 7).
Figure 7.

Effect of diabetes on insulin-degrading enzyme. (A) Western blots of brain homogenates from mice that were diabetic for 9 weeks for insulin-degrading enzyme (IDE). (B) Intensity of bands corresponding to IDE, that represents the ratio of the intensity of the bands corresponding to insulin-degrading enzyme over the intensity of the bands corresponding to actin. Data for control (C) mice are represented by white bars, for diabetic (D) mice at 4 weeks (4w) of diabetes by grey bars and at 9 weeks (9w) of diabetes by black bars. Data are mean+SEM, n=7/group. *p<0.05 by one-way Anova versus control, followed by Bonferronni’s post-hoc test.
Insulin pathway in db/db mice brain
Phosphorylation and protein expression levels of insulin receptor, PI3K and both isoforms of GSK3 were not different in brains from control and db/db mice after 8–9 weeks of hyperglycemia (Figure 8), while blood glucose and plasma insulin levels were significantly (p<0.01) increased in diabetic mice (Glucose: control= 121±4 mg/dl, db/db= 351±26 mg/dl; Insulin: control= 1.1±0.4µg/l, db/db= 4.5±0.2 µg/l).
Figure 8.

Effect of diabetes in db/db mouse brain. Levels of phosphorylation of insulin receptor, GSK3α and β, and expression of PI3K in db/db mouse brain after 8 weeks of hyperglycemia. Data from control mice are represented by white bars and from db/db diabetic mice by black bars. Data are mean+ SEM, n=6–7/group.
Insulin treatment
Insulin therapy from onset of diabetes significantly (p<0.001) but partially reduced HbA1c levels (Control= 4.6±0.1 %, diabetic= 11.3±0.1 %, diabetic + insulin= 7.1±0.5%) and did not restore normal blood glucose (Control= 194 ± 10 mg/dl, diabetic > 600 mg/dl, diabetic + insulin= 412 ± 66 mg/dl). Eight weeks of insulin therapy partially prevented the reduction of phosphorylation of insulin receptor and GSK3β (Figure 9A, B), and partially prevented the increase in tau phosphorylation (Figure 9C). On the first day of testing in the Barnes maze task after 8 weeks of diabetes, control, STZ-diabetic and insulin-treated diabetic mice found the escape box with a similar time (group median: Control: 218s, STZ-diabetic: 230s, Insulin-treated diabetic: 242s). By the second day of testing, control mice found the escape box with a significantly shorter time (Figure 9B), while STZ-diabetic mice did not improve their time to find the escape box, displaying a significant (p<0.05) impairment in learning ability. This was partially prevented by insulin treatment (Figure 9D) as mice treated with insulin found the escape box on day 2 in a time similar to that of control mice (Figure 9D). By day 3, there was no significant difference in time to find the escape box between any of the 3 groups.
Figure 9.
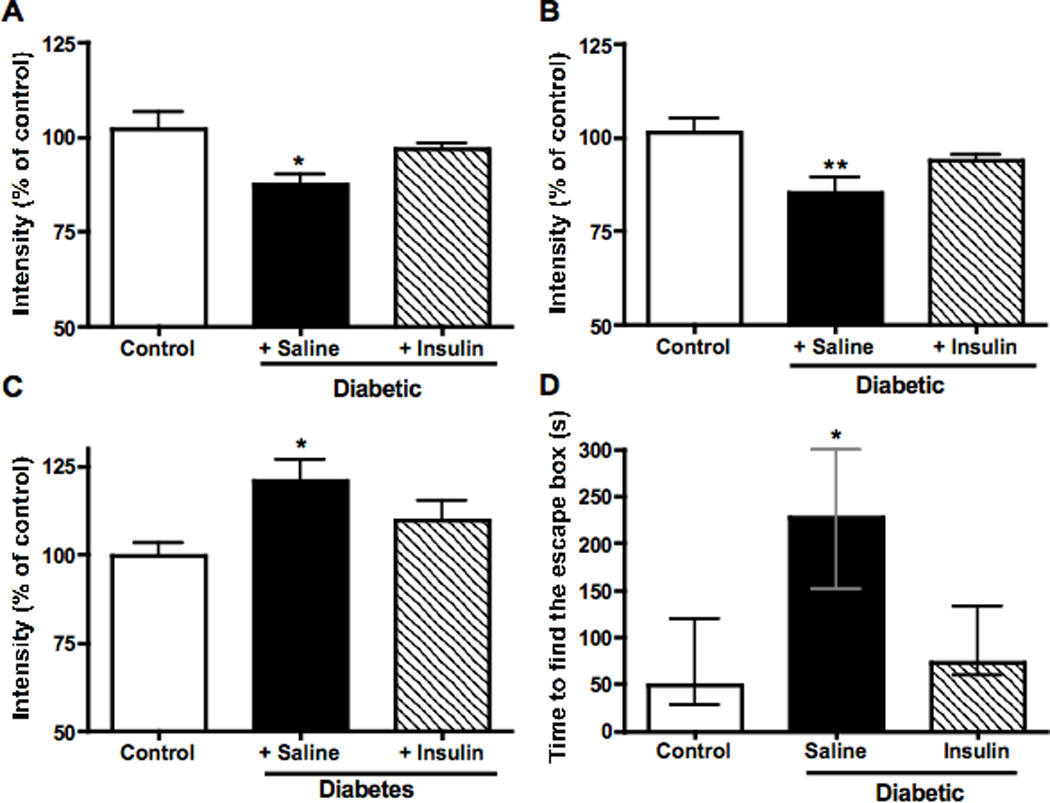
Effect of treatment with insulin on (A) phosphorylation of insulin receptor, (B) phosphorylation of GSK3β, (C) phosphorylation of tau at threonine 231. Panel D represents the effect of insulin on cognitive performance on the second day of testing in the Barnes maze test after 8 weeks of diabetes. Data from control mice are represented by white bars, data from untreated diabetic mice are represented by black bars and from insulin-treated diabetic mice by hatched bars. Data are mean+SEM, n=5–6/group. *p<0.05 by one-way Anova versus control, followed by Bonferronni’s post-hoc test for panel A, B and C. For panel D, data are represented as median ± interquartiles for non-parametric data. *p<0.05 by Wilcoxon rank test versus control.
Discussion
Despite some controversy, it is becoming well-recognized that patients suffering from type-1 diabetes show evidence of cognitive deficits (Desrocher and Rovet 2004), as do patients suffering from type-2 diabetes (Biessels et al. 1998), and these deficits may be associated with pathogenesis common to diabetes and AD (Sima and Li 2006). Cognitive functions can be assessed in rodents using a variety of behavioral tests. The Morris water maze task is currently the most frequently used test to evaluate spatial learning and memory abilities in rodent. However, Swiss Webster mice do not show learning behavior in the Morris water maze (Petrie 1995). In addition, stress and cold can lead to increased protein phosphorylation, in particular phosphorylation of tau (Korneyev et al. 1995; Korneyev 1998; Okawa et al. 2003). Therefore, we used the Barnes maze (Barnes 1979), which evaluates learning and memory without the water stress and swimming strength components of the Morris water maze task. Swiss Webster control mice showed evidence of both learning and memory in the Barnes maze, which contrast with the Morris water maze (Petrie, 1995), whereas STZ-diabetic mice demonstrated memory impairment as well as a reduced capacity to learn a new task, reflecting the diminished mental flexibility described in patients with type-1 diabetes (Brands et al. 2005). These deficits were not due to locomotor deficits as demonstrated by the accelerating rotarod. STZ-diabetic mice and rats have been shown to have an impaired learning ability in the Morris water maze task (Biessels et al. 1996; Biessels et al. 1998; Huang et al. 2007; Sima and Li 2005), and also show deficits in memory retention and retrieval when more complex tasks are assessed (Flood et al. 1990). In addition, insulin deficiency in diabetic rats is associated with retraction of dendrites and reduces NMDA transmission of hippocampal neurons resulting in atrophy of the hippocampus and diminished memory performance (Gardoni et al. 2002; Magarinos and McEwen 2000). More recently, impaired spatial learning and memory assessed by the Morris water maze test was associated with impaired insulin action in the brain of type-1 diabetic rats after 8 months of diabetes (Li et al. 2002).
Only in the last decade or so has insulin been considered vital in the brain, where it is now recognized as being involved in many cerebral functions, including plasticity, cognition and neuroprotection (Gasparini et al. 2002). Insulin receptors are widely expressed in the rodent and human brain (Unger et al. 1991). When stimulated by insulin, they trigger several signaling pathways including the phospholipase Cγ, mitogen-activated protein kinase and PI3K pathways. Our interest in the present study focused on the PI3K signal transduction pathway that regulates the activity of GSK3. Dysregulation of GSK3 activity has recently been linked to a number of neurodegenerative diseases (Jope and Johnson 2004). The importance of the regulation of GSK3 activity in neurons has been illustrated by studies showing that insulin-driven inactivation of GSK3 by phosphorylation of the α and β isoforms results in a relatively low phosphorylation state of the microtubule-associated protein tau (Hong and Lee 1997). Associations between insulin-signaling and regulation of tau phosphorylation have been further supported by reports showing that reduced AKT and GSK3β phosphorylation are associated with increased tau phosphorylation in the brain of neuron-specific insulin receptor knock-out mice (Schubert et al. 2004) and that tau phosphorylation is increased in the brain of transgenic mice conditionally overexpressing GSK3β and displaying increased GSK3 activity (Lucas et al. 2001). GSK3α phosphorylates tau at serine 262 while GSK3β phosphorylates tau at threonine 231 after priming by CDK5 (Sengupta et al. 2006). The primary role of tau is to stabilize microtubules, and phosphorylation at the threonine 231 site disrupts its binding to microtubules (Cho and Johnson 2004). Insulin-signaling therefore has the potential to regulate the organization and stability of the neuronal cytoskeleton. Our findings of impaired insulin-signaling pathway activity and tau hyperphosphorylation after 9 weeks of STZ-induced diabetes in mouse brain suggest that systemic insulin deficiency or its consequences are sufficient to prompt disruption of insulin-signaling in the brain and supports the idea that prolonged insulin deficiency or inadequate insulin therapy may be associated with tau hyperphosphorylation.
Aside from regulation of tau phosphorylation, GSK3 activity also mediates amyloid β neurotoxicity (Grimes and Jope 2001). It was shown that GSK3, and more particularly GSK3α, facilitates the production of amyloid β in the brain of APP transgenic mice (Phiel et al. 2003). Additionally, GSK3 inhibitors reduce amyloid β production (Sun et al. 2002). Our present finding of both reduced phosphorylation (increased activity) of GSK3 and an increased amount of amyloid β in the brain of insulin-deficient diabetic mice is consistent with this association. The reduced expression of IDE seen in our STZ-diabetic mice could also contribute to the accumulation of amyloid β, as IDE degrades amyloid β in vitro (Kurochkin and Goto 1994; Qiu et al. 1998), and IDE deficiency in mouse and rat is associated with an increase amyloid β levels in the brain (Farris et al. 2003; Miller et al. 2003).
As our results show that insulin deficiency affected elements of the insulin-signaling pathway in the brain, we investigated the effect of insulin treatment on cognitive performance and on selected insulin-signaling pathway elements and tau phosphorylation in the brain of diabetic mice. Insulin treatment of diabetic mice partially prevented cognitive impairments, and increased phosphorylation of both the insulin receptor and GSK3β. The reduction of tau phosphorylation in insulin-treated animals is consistent with the relative inactivation of GSK3, demonstrating that insulin deficiency rather than hyperglycemia or STZ toxicity caused the changes observed in diabetic mouse brain. These results demonstrate that insulin deficiency is the initiating event that induces decreases in the insulin-signaling cascade in the brain and contributes to diabetes-induced behavioral deficits. While additional pharmacologic interventions will be necessary to strongly demonstrate a causal link between the observed associations of impaired insulin-signaling pathway, tau hyperphosphorylation, amyloid β production and learning and memory deficits, this possibility is supported by a report that a transgenic mouse model that conditionally overexpressed GSK3 with subsequent increase of GSK3 activity and phosphorylation of tau also showed a spatial learning deficit in the water maze task (Hernandez et al. 2002).
During preparation of this manuscript, others reported changes in the brain of rat models of spontaneous type-1 and type-2 diabetes of 8 months duration (Li et al. 2007) similar to those seen in our type-1 diabetic mice after 9 weeks of hyperglycemia. Interestingly, in our study, the activity of elements of the insulin-signaling pathway was not changed in the brain of db/db mice, a model of type-2 diabetes. This discrepancy between the models of type-2 diabetes may be due to the shorter duration of diabetes in our present study or between-species differences in the response to diabetes. However, the duration of hyperglycemia in the db/db mice was similar to that of our STZ-diabetic mice (8 and 9 weeks, respectively). These results indicate that, in mice, aberrant GSK3 activity and its consequences develop earlier in insulin-deficient hyperglycemic type-1 mice than in insulin-resistant, hyperglycemic type-2 diabetic animals. The duration of impaired insulin signaling in the brain may therefore be more detrimental than hyperglycemia.
Our present results show that a mouse model of insulin deficient type-1 diabetes shares several features with rodent models of AD. These include impaired learning, decreased insulin-signaling pathway, decreased IDE expression and accumulation of the main pathologic hallmarks of AD, namely tau hyperphosphorylation and amyloid β. Partial reversal of the changes observed in STZ-diabetic mice brain by insulin underlines the role of peripheral insulin deficiency rather than hyperglycemia, as the major pathogenic event for diabetic encephalopathy. It is tempting to speculate that the changes observed in brains of diabetic rodents model pathogenic mechanisms that could contribute to reports that diabetic patients have an increase risk to develop AD and underline the recommendation for good glycemic control for patients suffering from type-1 diabetes (DCCT,1993).
Acknowledgments
Support: Institute for the Study of Aging (ISOA)
Supported by a grant from the Institute for the Study of Aging (ISOA) (CGJ). Our thanks to Dr. Nigel Calcutt for fruitful discussions on models of diabetes.
References
- Araki Y, Nomura M, Tanaka H, Yamamoto H, Yamamoto T, Tsukaguchi I, Nakamura H. MRI of the brain in diabetes mellitus. Neuroradiology. 1994;36(2):101–103. doi: 10.1007/BF00588069. [DOI] [PubMed] [Google Scholar]
- Barnes CA. Memory deficits associated with senescence: a neurophysiological and behavioral study in the rat. J Comp Physiol Psychol. 1979;93(1):74–104. doi: 10.1037/h0077579. [DOI] [PubMed] [Google Scholar]
- Biessels GJ, Deary IJ, Ryan CM. Cognition and diabetes: a lifespan perspective. Lancet Neurol. 2008;7(2):184–190. doi: 10.1016/S1474-4422(08)70021-8. [DOI] [PubMed] [Google Scholar]
- Biessels GJ, Kamal A, Ramakers GM, Urban IJ, Spruijt BM, Erkelens DW, Gispen WH. Place learning and hippocampal synaptic plasticity in streptozotocin-induced diabetic rats. Diabetes. 1996;45(9):1259–1266. doi: 10.2337/diab.45.9.1259. [DOI] [PubMed] [Google Scholar]
- Biessels GJ, Kamal A, Urban IJ, Spruijt BM, Erkelens DW, Gispen WH. Water maze learning and hippocampal synaptic plasticity in streptozotocin-diabetic rats: effects of insulin treatment. Brain Res. 1998;800(1):125–135. doi: 10.1016/s0006-8993(98)00510-1. [DOI] [PubMed] [Google Scholar]
- Brands AM, Biessels GJ, de Haan EH, Kappelle LJ, Kessels RP. The effects of type 1 diabetes on cognitive performance: a meta-analysis. Diabetes Care. 2005;28(3):726–735. doi: 10.2337/diacare.28.3.726. [DOI] [PubMed] [Google Scholar]
- Cho JH, Johnson GV. Primed phosphorylation of tau at Thr231 by glycogen synthase kinase 3beta (GSK3beta) plays a critical role in regulating tau's ability to bind and stabilize microtubules. J Neurochem. 2004;88(2):349–358. doi: 10.1111/j.1471-4159.2004.02155.x. [DOI] [PubMed] [Google Scholar]
- Cole AR, Astell A, Green C, Sutherland C. Molecular connexions between dementia and diabetes. Neurosci Biobehav Rev. 2007;31(7):1046–1063. doi: 10.1016/j.neubiorev.2007.04.004. [DOI] [PubMed] [Google Scholar]
- Cook DG, Leverenz JB, McMillan PJ, Kulstad JJ, Ericksen S, Roth RA, Schellenberg GD, Jin LW, Kovacina KS, Craft S. Reduced hippocampal insulin-degrading enzyme in late-onset Alzheimer's disease is associated with the apolipoprotein E-epsilon4 allele. Am J Pathol. 2003;162(1):313–319. doi: 10.1016/s0002-9440(10)63822-9. [DOI] [PMC free article] [PubMed] [Google Scholar]
- Cross DA, Alessi DR, Cohen P, Andjelkovich M, Hemmings BA. Inhibition of glycogen synthase kinase-3 by insulin mediated by protein kinase B. Nature. 1995;378(6559):785–789. doi: 10.1038/378785a0. [DOI] [PubMed] [Google Scholar]
- Cukierman T, Gerstein HC, Williamson JD. Cognitive decline and dementia in diabetes--systematic overview of prospective observational studies. Diabetologia. 2005;48(12):2460–2469. doi: 10.1007/s00125-005-0023-4. [DOI] [PubMed] [Google Scholar]
- DCCT. The effect of intensive treatment of diabetes on the development and progression of long-term complications in insulin-dependent diabetes mellitus. The Diabetes Control and Complications Trial Research Group. N Engl J Med. 1993;329(14):977–986. doi: 10.1056/NEJM199309303291401. [DOI] [PubMed] [Google Scholar]
- de la Monte SM, Wands JR. Review of insulin and insulin-like growth factor expression, signaling, and malfunction in the central nervous system: relevance to Alzheimer's disease. J Alzheimers Dis. 2005;7(1):45–61. doi: 10.3233/jad-2005-7106. [DOI] [PubMed] [Google Scholar]
- DeJong RN. CNS manifestations of diabetes mellitus. Postgrad Med. 1977;61(1):101–107. doi: 10.1080/00325481.1977.11714510. [DOI] [PubMed] [Google Scholar]
- Desrocher M, Rovet J. Neurocognitive correlates of type 1 diabetes mellitus in childhood. Child Neuropsychol. 2004;10(1):36–52. doi: 10.1076/chin.10.1.36.26241. [DOI] [PubMed] [Google Scholar]
- Farris W, Mansourian S, Chang Y, Lindsley L, Eckman EA, Frosch MP, Eckman CB, Tanzi RE, Selkoe DJ, Guenette S. Insulin-degrading enzyme regulates the levels of insulin, amyloid beta-protein, and the beta-amyloid precursor protein intracellular domain in vivo. Proc Natl Acad Sci U S A. 2003;100(7):4162–4167. doi: 10.1073/pnas.0230450100. [DOI] [PMC free article] [PubMed] [Google Scholar]
- Flood JF, Mooradian AD, Morley JE. Characteristics of learning and memory in streptozocin-induced diabetic mice. Diabetes. 1990;39(11):1391–1398. doi: 10.2337/diab.39.11.1391. [DOI] [PubMed] [Google Scholar]
- Frolich L, Blum-Degen D, Bernstein HG, Engelsberger S, Humrich J, Laufer S, Muschner D, Thalheimer A, Turk A, Hoyer S, Zochling R, Boissl KW, Jellinger K, Riederer P. Brain insulin and insulin receptors in aging and sporadic Alzheimer's disease. J Neural Transm. 1998;105(4–5):423–438. doi: 10.1007/s007020050068. [DOI] [PubMed] [Google Scholar]
- Gardoni F, Kamal A, Bellone C, Biessels GJ, Ramakers GM, Cattabeni F, Gispent WH, Di Luca M. Effects of streptozotocin-diabetes on the hippocampal NMDA receptor complex in rats. J Neurochem. 2002;80(3):438–447. doi: 10.1046/j.0022-3042.2001.00713.x. [DOI] [PubMed] [Google Scholar]
- Gasparini L, Netzer WJ, Greengard P, Xu H. Does insulin dysfunction play a role in Alzheimer's disease? Trends Pharmacol Sci. 2002;23(6):288–293. doi: 10.1016/s0165-6147(02)02037-0. [DOI] [PubMed] [Google Scholar]
- Grimes CA, Jope RS. The multifaceted roles of glycogen synthase kinase 3beta in cellular signaling. Prog Neurobiol. 2001;65(4):391–426. doi: 10.1016/s0301-0082(01)00011-9. [DOI] [PubMed] [Google Scholar]
- Hernandez F, Borrell J, Guaza C, Avila J, Lucas JJ. Spatial learning deficit in transgenic mice that conditionally over-express GSK-3beta in the brain but do not form tau filaments. J Neurochem. 2002;83(6):1529–1533. doi: 10.1046/j.1471-4159.2002.01269.x. [DOI] [PubMed] [Google Scholar]
- Hong M, Lee VM. Insulin and insulin-like growth factor-1 regulate tau phosphorylation in cultured human neurons. J Biol Chem. 1997;272(31):19547–19553. doi: 10.1074/jbc.272.31.19547. [DOI] [PubMed] [Google Scholar]
- Huang HJ, Liang KC, Chen CP, Chen CM, Hsieh-Li HM. Intrahippocampal administration of A beta(1–40) impairs spatial learning and memory in hyperglycemic mice. Neurobiol Learn Mem. 2007;87(4):483–494. doi: 10.1016/j.nlm.2006.11.006. [DOI] [PubMed] [Google Scholar]
- Jope RS, Johnson GV. The glamour and gloom of glycogen synthase kinase-3. Trends Biochem Sci. 2004;29(2):95–102. doi: 10.1016/j.tibs.2003.12.004. [DOI] [PubMed] [Google Scholar]
- Korneyev A, Binder L, Bernardis J. Rapid reversible phosphorylation of rat brain tau proteins in response to cold water stress. Neurosci Lett. 1995;191(1–2):19–22. doi: 10.1016/0304-3940(95)11546-3. [DOI] [PubMed] [Google Scholar]
- Korneyev AY. Stress-induced tau phosphorylation in mouse strains with different brain Erk 1 + 2 immunoreactivity. Neurochem Res. 1998;23(12):1539–1543. doi: 10.1023/a:1020980004539. [DOI] [PubMed] [Google Scholar]
- Kurochkin IV, Goto S. Alzheimer's beta-amyloid peptide specifically interacts with and is degraded by insulin degrading enzyme. FEBS Lett. 1994;345(1):33–37. doi: 10.1016/0014-5793(94)00387-4. [DOI] [PubMed] [Google Scholar]
- Leibson CL, Rocca WA, Hanson VA, Cha R, Kokmen E, O'Brien PC, Palumbo PJ. Risk of dementia among persons with diabetes mellitus: a population-based cohort study. Am J Epidemiol. 1997;145(4):301–308. doi: 10.1093/oxfordjournals.aje.a009106. [DOI] [PubMed] [Google Scholar]
- Li ZG, Zhang W, Grunberger G, Sima AA. Hippocampal neuronal apoptosis in type 1 diabetes. Brain Res. 2002;946(2):221–231. doi: 10.1016/s0006-8993(02)02887-1. [DOI] [PubMed] [Google Scholar]
- Li ZG, Zhang W, Sima AA. Alzheimer-like changes in rat models of spontaneous diabetes. Diabetes. 2007;56(7):1817–1824. doi: 10.2337/db07-0171. [DOI] [PubMed] [Google Scholar]
- Lucas JJ, Hernandez F, Gomez-Ramos P, Moran MA, Hen R, Avila J. Decreased nuclear beta-catenin, tau hyperphosphorylation and neurodegeneration in GSK-3beta conditional transgenic mice. EMBO J. 2001;20(1–2):27–39. doi: 10.1093/emboj/20.1.27. [DOI] [PMC free article] [PubMed] [Google Scholar]
- Magarinos AM, McEwen BS. Experimental diabetes in rats causes hippocampal dendritic and synaptic reorganization and increased glucocorticoid reactivity to stress. Proc Natl Acad Sci U S A. 2000;97(20):11056–11061. doi: 10.1073/pnas.97.20.11056. [DOI] [PMC free article] [PubMed] [Google Scholar]
- Manschot SM, Brands AM, van der Grond J, Kessels RP, Algra A, Kappelle LJ, Biessels GJ. Brain magnetic resonance imaging correlates of impaired cognition in patients with type 2 diabetes. Diabetes. 2006;55(4):1106–1113. doi: 10.2337/diabetes.55.04.06.db05-1323. [DOI] [PubMed] [Google Scholar]
- McCarthy AM, Lindgren S, Mengeling MA, Tsalikian E, Engvall JC. Effects of diabetes on learning in children. Pediatrics. 2002;109(1):E9. doi: 10.1542/peds.109.1.e9. [DOI] [PubMed] [Google Scholar]
- Miller BC, Eckman EA, Sambamurti K, Dobbs N, Chow KM, Eckman CB, Hersh LB, Thiele DL. Amyloid-beta peptide levels in brain are inversely correlated with insulysin activity levels in vivo. Proc Natl Acad Sci U S A. 2003;100(10):6221–6226. doi: 10.1073/pnas.1031520100. [DOI] [PMC free article] [PubMed] [Google Scholar]
- Okawa Y, Ishiguro K, Fujita SC. Stress-induced hyperphosphorylation of tau in the mouse brain. FEBS Lett. 2003;535(1–3):183–189. doi: 10.1016/s0014-5793(02)03883-8. [DOI] [PubMed] [Google Scholar]
- Ott A, Stolk RP, Hofman A, van Harskamp F, Grobbee DE, Breteler MM. Association of diabetes mellitus and dementia: the Rotterdam Study. Diabetologia. 1996;39(11):1392–1397. doi: 10.1007/s001250050588. [DOI] [PubMed] [Google Scholar]
- Peila R, Rodriguez BL, Launer LJ. Type 2 diabetes, APOE gene, and the risk for dementia and related pathologies: The Honolulu-Asia Aging Study. Diabetes. 2002;51(4):1256–1262. doi: 10.2337/diabetes.51.4.1256. [DOI] [PubMed] [Google Scholar]
- Perez A, Morelli L, Cresto JC, Castano EM. Degradation of soluble amyloid beta-peptides 1–40, 1–42, and the Dutch variant 1–40Q by insulin degrading enzyme from Alzheimer disease and control brains. Neurochem Res. 2000;25(2):247–255. doi: 10.1023/a:1007527721160. [DOI] [PubMed] [Google Scholar]
- Petrie BF. Learning set spatial navigation performance in three mouse strains. Psychol Rep. 1995;77(3 Pt 2):1339–1342. doi: 10.2466/pr0.1995.77.3f.1339. [DOI] [PubMed] [Google Scholar]
- Phiel CJ, Wilson CA, Lee VM, Klein PS. GSK-3alpha regulates production of Alzheimer's disease amyloid-beta peptides. Nature. 2003;423(6938):435–439. doi: 10.1038/nature01640. [DOI] [PubMed] [Google Scholar]
- Qiu WQ, Walsh DM, Ye Z, Vekrellis K, Zhang J, Podlisny MB, Rosner MR, Safavi A, Hersh LB, Selkoe DJ. Insulin-degrading enzyme regulates extracellular levels of amyloid beta-protein by degradation. J Biol Chem. 1998;273(49):32730–32738. doi: 10.1074/jbc.273.49.32730. [DOI] [PubMed] [Google Scholar]
- Reagan LP. Insulin signaling effects on memory and mood. Curr Opin Pharmacol. 2007;7(6):633–637. doi: 10.1016/j.coph.2007.10.012. [DOI] [PMC free article] [PubMed] [Google Scholar]
- Reaven GM, Thompson LW, Nahum D, Haskins E. Relationship between hyperglycemia and cognitive function in older NIDDM patients. Diabetes Care. 1990;13(1):16–21. doi: 10.2337/diacare.13.1.16. [DOI] [PubMed] [Google Scholar]
- Reske-Nielsen E, Lundbaek K. Pathological changes in the central and peripheral nervous system of young long-term diabetics. II. The spinal cord and peripheral nerves. Diabetologia. 1968;4(1):34–43. doi: 10.1007/BF01241031. [DOI] [PubMed] [Google Scholar]
- Ryan C, Vega A, Drash A. Cognitive deficits in adolescents who developed diabetes early in life. Pediatrics. 1985;75(5):921–927. [PubMed] [Google Scholar]
- Ryan CM, Williams TM. Effects of insulin-dependent diabetes on learning and memory efficiency in adults. J Clin Exp Neuropsychol. 1993;15(5):685–700. doi: 10.1080/01688639308402589. [DOI] [PubMed] [Google Scholar]
- Schubert M, Gautam D, Surjo D, Ueki K, Baudler S, Schubert D, Kondo T, Alber J, Galldiks N, Kustermann E, Arndt S, Jacobs AH, Krone W, Kahn CR, Bruning JC. Role for neuronal insulin resistance in neurodegenerative diseases. Proc Natl Acad Sci U S A. 2004;101(9):3100–3105. doi: 10.1073/pnas.0308724101. [DOI] [PMC free article] [PubMed] [Google Scholar]
- Sengupta A, Novak M, Grundke-Iqbal I, Iqbal K. Regulation of phosphorylation of tau by cyclin-dependent kinase 5 and glycogen synthase kinase-3 at substrate level. FEBS Lett. 2006;580(25):5925–5933. doi: 10.1016/j.febslet.2006.09.060. [DOI] [PMC free article] [PubMed] [Google Scholar]
- Sima AA, Li ZG. The effect of C-peptide on cognitive dysfunction and hippocampal apoptosis in type 1 diabetic rats. Diabetes. 2005;54(5):1497–1505. doi: 10.2337/diabetes.54.5.1497. [DOI] [PubMed] [Google Scholar]
- Sima AA, Li ZG. Diabetes and Alzheimer's disease - is there a connection? Rev Diabet Stud. 2006;3(4):161–168. doi: 10.1900/RDS.2006.3.161. [DOI] [PMC free article] [PubMed] [Google Scholar]
- Steen E, Terry BM, Rivera EJ, Cannon JL, Neely TR, Tavares R, Xu XJ, Wands JR, de la Monte SM. Impaired insulin and insulin-like growth factor expression and signaling mechanisms in Alzheimer's disease--is this type 3 diabetes? J Alzheimers Dis. 2005;7(1):63–80. doi: 10.3233/jad-2005-7107. [DOI] [PubMed] [Google Scholar]
- Sun X, Sato S, Murayama O, Murayama M, Park JM, Yamaguchi H, Takashima A. Lithium inhibits amyloid secretion in COS7 cells transfected with amyloid precursor protein C100. Neurosci Lett. 2002;321(1–2):61–64. doi: 10.1016/s0304-3940(01)02583-6. [DOI] [PubMed] [Google Scholar]
- Sutherland C, Leighton IA, Cohen P. Inactivation of glycogen synthase kinase-3 beta by phosphorylation: new kinase connections in insulin and growth-factor signalling. Biochem J. 1993;296(Pt 1):15–19. doi: 10.1042/bj2960015. [DOI] [PMC free article] [PubMed] [Google Scholar]
- Unger JW, Livingston JN, Moss AM. Insulin receptors in the central nervous system: localization, signalling mechanisms and functional aspects. Prog Neurobiol. 1991;36(5):343–362. doi: 10.1016/0301-0082(91)90015-s. [DOI] [PubMed] [Google Scholar]
- Yoshitake T, Kiyohara Y, Kato I, Ohmura T, Iwamoto H, Nakayama K, Ohmori S, Nomiyama K, Kawano H, Ueda K, et al. Incidence and risk factors of vascular dementia and Alzheimer's disease in a defined elderly Japanese population: the Hisayama Study. Neurology. 1995;45(6):1161–1168. doi: 10.1212/wnl.45.6.1161. [DOI] [PubMed] [Google Scholar]