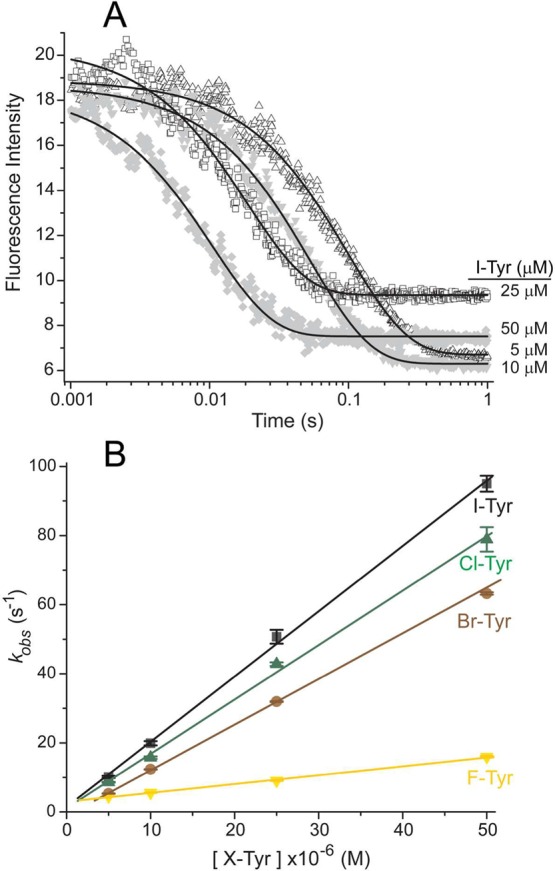
Figure 1.

Rate of halotyrosines binding to hIYD·flox. (A) Solutions of hIYD·flox (2 μM final) in 500 mM NaCl, 10% glycerol, 1 mM DTT, and 50 mM sodium phosphate, pH 7.4, were mixed with an equal volume of I-Tyr to final concentrations of 5–50 μM in the same buffer solution. The fluorescence of the bound flox was monitored over time using λex = 450 nm and λem > 530 nm. The solid black lines represent fits to a single-exponential model (eq 1) that yield the first-order rate constants (kobs). (B) This analysis was repeated for the indicated halotyrosines as a function of concentration to determine the second-order binding rate constants (kon) summarized in Table 1. Data points represent the average of three independent measurements, and the standard deviations are illustrated by error bars. The solid lines were generated by linear best fits to the data.
