Abstract
Background/AIM
STIM1 is as an essential component in store operated Ca2+entry. However give the paucity of information on the role of STIM1 in kidney, the aim was to study the function of STIM1 in the medulla of the kidney.
Methods
we crossed a Ksp-cre mouse with another mouse containing two loxP sites flanking Exon 6 of STIM1. The Ksp-cre mouse is based upon the Ksp-cadherin gene promoter which expresses cre recombinase in developing nephrons, collecting ducts (SD) and thick ascending limbs (TAL) of the loop of Henle.
Results
The offspring of these mice are viable without gross morphological changes, however, we noticed that the STIM1 Ksp-cre knockout mice produced more urine compared to control. To examine this more carefully, we fed mice low (LP) and high protein (HP) diets respectively. When mice were fed HP diet STIM1 ko mice had significantly increased urinary volume and lower specific gravity compared to wt mice. In STIM1 ko mice fed HP diet urine creatinine and urea were significantly lower compared to wt mice fed HP diet, however the fractional excretion was the same.
Conclusion
These data support the idea that STIM1 ko mice have impaired urinary concentrating ability when challenged with HP diet is most likely caused by impaired Ca2+-dependent signal transduction through the vasopressin receptor cascade.
Keywords: Kidney, STIM1, Concentrating Mechanism, Vasopressin receptor
Introduction
STIM1 described initially as tumor suppressor gene [1] serves as Ca2+ sensing protein [2]. STIM1 is a transmembrane protein with its Ca+2 sensing domain facing the lumen of the ER. When ER Ca2+ stores are depleted, STIM1 senses that ER Ca+2 is low and translocates to the plasma membrane [2]. At the plasma membrane STIM1 activates the so called ‘calcium release-activated Ca2+ current, CRAC, via Orai1 and perhaps other Ca2+ channels [3–5]. The Ca2+ that enters the cell via SOCE is pumped into the ER lumen via the SERCA, the ER Ca2+pump [6].
Ca2+ release plays a role in signal transduction in the kidney. For example, it is well known that AVP binds to the V2R in the basolateral membrane and induces the insertion of AQP2 water channels into the apical membrane of the collecting duct [7]. The insertion of AQP2 water channels increases collecting duct water permeability and the absorption of water from the final urine back into the body. This phenomenon is essential for water conservation [8]. How AVP induces the insertion of AQP2 into the plasma membrane has been intensely investigated. AVP activates the adenylate cyclase (AC) enzyme increasing intracellular cAMP levels, and the phosphorylation of AQP2 and in addition increases intracellular Ca2+ [9]. The latter is thought to be mediated via the release of ER Ca2+ via the ryanodine-receptor [10]. AVP stimulation results in oscillations in cytosolic Ca2+ which also occurs via the rapid and transient movement of Ca2+ out of the ER via ryanodine receptor. Inhibition of the increase in intracellular Ca2+ induced by AVP prevents AQP2 trafficking even in the presence of elevated intracellular cAMP levels pointing out that ER release and subsequent SOCE has an essential role for water conservation [10].
We showed in MDCK cells, a model renal epithelial cell line, that ATP operating through purinergic receptor activation and thereby increasing IP3 causing release of Ca2+ by the ER via the IP3R, and depleting ER Ca+2 causes the translocation of STIM1 to the plasma membrane activating SOCE [11–13]. Interestingly, we observed that the translocation was modulated by 100 kd C-terminal cleavage fragment (P100) of polycystin 1 (PC-1) [11].
PC-1 is a large membrane protein with 11 putative transmembrane regions and a short cytoplasmic C-terminus [14]. PC-1 by itself has no channel activity, however, it binds to PC-2 to form a complex resulting in transmembrane Ca2+movement via PC-2 [15]. PC-2 is a member of the TRP family (PPC2) [16]. Mutations in either PC-1 or 2 cause adult onset polycystic kidney disease which is the most common dominant genetic disorder in humans [17]. ADPKD is characterized by the progressive, enlargement of multiple renal cysts leading to a decline in renal function and culminating in renal failure in 50% of patients [18]. PC-1 is known to have several cleavage sites resulting in multiple fragments [19]. For example cleavage of a small C-terminal fragment allows it to be translocated to the nucleus where it functions in nuclear signal transduction [20]. Cleavage at the GPS site generates N- and C-terminal fragments. Although the precise function of GPS cleavage is unknown, mutations at this site cause polycystic kidney disease particularly in animal models [21]. Thus, cleavage at GPS site is clearly important for normal function in postnatal period. We showed that the P100 fragment of PC-1 binds to STIM1 and to the IP3R and sequesters STIM1 in the ER [11]. When the cells are stimulated by ATP which causes an increase in intracellular through ER Ca2+release, STIM1 remains in the ER, whereas in the absence of P100, PC-1 STIM1 translocates to the plasma membrane where it activates SOCE. The overall effect of P100 binding is to reduce the cellular response to signal transduction cascades that increase intracellular Ca2+ and to reduce the amount of STIM1 that resides at the plasma membrane. It is becoming increasingly clear that an excess of STIM1 at the plasma membrane is associated with increase cell proliferation in several cancers [22]. Thus, P100 may be protective to the kidney by reducing STIM1 at the plasma membrane.
In view of the potential role of STIM1 as an essential component in SOCE and the paucity of information on the role of STIM1 in kidney, we crossed a Ksp-cre mouse [23] with another mouse containing two loxP sites flanking Exon 6 of STIM1. The Ksp-cre mouse is based upon the Ksp-cadherin gene promoter which expresses cre recombinase in developing nephrons, collecting ducts (SD) and thick ascending limbs (TAL) of the loop of Henle [24]. The STIM1- loxP mouse was provided to us by Paul Worley at JHU. The offspring of these mice are viable but show a defect in their ability to concentrate urine.
Materials and Methods
Stim1fl/fl Ksp-cre mouse
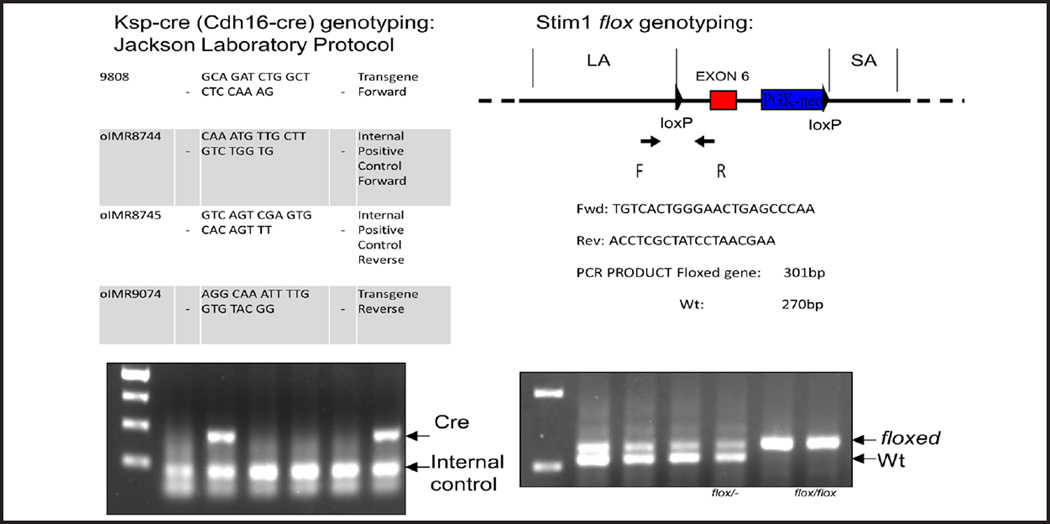
STIM1 knockout (ko) mouse was created and provided to us by Paul Worley in the Department of Neuroscience at JHU. The mouse has two loxP sites flanking Exon 6 (see Fig. 1). To focus on the kidney, we obtained the Ksp-cre mouse which is based upon the Ksp-cadherin gene promoter which expresses cre recombinase in developing nephrons, collecting ducts and thick ascending limbs of the loop of Henle and distal tubules [24, 25]. Stim1fl/fl Ksp-cre mouse was obtained from crossing STIM1 knockout mouse and Ksp-cre mouse. Mice were genotyped for the Ksp-cre using the primers and protocol from Jackson Labs.
Fig. 1.
STIM1 flox genotyping. The Lox P site insertion in Stim1 was detected with primers that revealed both the presence of a floxed allele in each mouse and the hetero- or homozygosity.
Animals, treatments, and diets
All animal use complied with the guiding principles of the Johns Hopkins University Institutional Animal Care and Use Committee, and the protocols for this work were approved by this committee. All mice had unlimited access to water and were fed a normal laboratory chow from weaning. Standard laboratory chow has 20% protein. We fed mice high- and low-protein diets 4% or 40% protein for one week according to the procedure developed by Fenton and colleagues [26].
Urine and serum parameters
Urinary creatinine, urea, calcium, specific gravity as well as BUN, serum creatinine, albumin and calcium were measured by Johns Hopkins Comparative Medicine Laboratory. Fractional excretion of urea (FEUr) was calculated using the following formula: (UUr*SCr)/(UCr*BUN), where UUr is urinary urea, SCr is serum creatinine, UCr is urinary creatinine and BUN is blood urea nitrogen. Creatinine clearance (CrCl) was calculated using the following formula: UCr*V/SCr/1440, where UUr is urinary urea, V is 24h urine volume, SCr is serum creatinine and 1440 represents minutes in a 24h period. Urea clearance (UrCl) was calculated using the following formula: UUr*V/BUN/1440, where UUr is urinary urea, V is 24h urine volume, BUN is blood urea nitrogen and 1440 represents minutes in a 24h period. Fractional calcium excretion was calculated using the following formula: (UCa*SCr)/(SCa*UCr)*100, where UCa is urinary calcium, SCr is serum creatinine, SCa is serum calcium and UCr is urinary creatinine.
Kidney histology
Kidneys were quickly excised, stripped of the renal capsule, sagitally sectioned, and fixed in 4% paraformaldehyde in 0.1 mol/L phosphate buffer for 24 hours, and then paraffin embedded and sectioned. Sections were deparaffinized with xylene and rehydrated with descending ethanol into PBS, then stained with Von Kosa, hematoxylin and eosin. Sections were examined by a renal pathologist blinded to animal group and were graded for the presence of nephrocalcinosis in the medulla. A total of three to four histologic sections were analyzed for each mouse. Quantification of nephrocalcinosis was based on the following grading schema: 0 = no calcium, 1 = 1–4 calcium deposits, 2 = 5–8 calcium deposits, 3 = greater than 8 calcium deposits.
Statistical analysis
Data are expressed as mean ± SE (N = number of animals). Comparisons between Stim1fl/fl Ksp-cre and wild-type mice were assessed by using unpaired Student t test, and P values less than 0.05 were considered significant.
Results
STIM1 flox genotyping
The Lox P site insertion in Stim1 was detected with primers that revealed both the presence of a floxed allele in each mouse and the hetero- or homozygosity (Fig. 1).
Urine volume and specific gravity
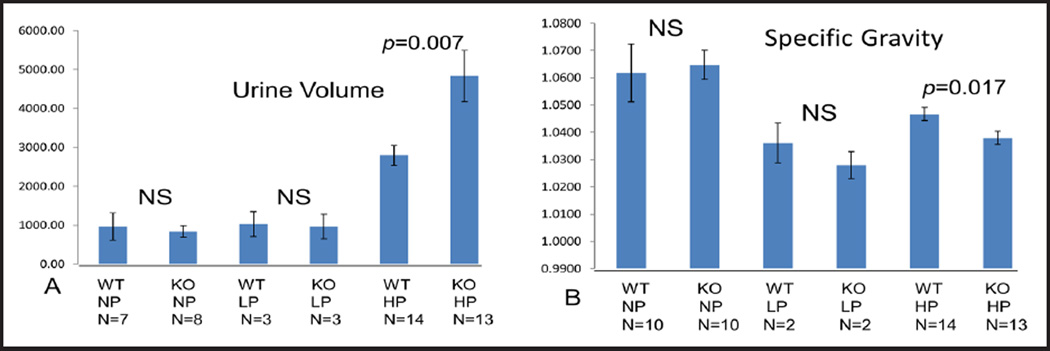
STIM1 ko and wt mice were fed a defined normal protein (NP) diet (20% protein), low protein (LP) diet (4% protein) or high protein (HP) diet (40% protein). Urine volume was similar in STIM1 ko mice when compared to wild type (wt) mice fed either NP or LP diet (Fig. 2). When mice were fed HP diet STIM1 ko mice had significantly increased urinary volume compared to wt mice (Fig. 2A). Next we measured urine specific gravity to determine urine concentrating ability in STIM1 ko mice versus wt mice. In mice fed NP or LP diet there was no difference in urinary specific gravity in STIM1 ko mice compared to wt mice (Fig. 2B). When fed a HP diet STIM1 ko mice had significantly lower urinary specific gravity compared to wt mice. Based on above data we concluded that STIM1 ko mice have impaired urinary concentrating ability when challenged with HP diet.
Fig. 2.
(A) Urine volume (µl). Adult mice (4–10 weeks old) fed normal, low or high protein diet for one week were placed in metabolic cages for 24 h to collect urine. Columns represent averages ± standard errors of urine volume of wt and STIM1 ko mice fed normal, low or high protein diet. Statistical analysis was performed using a paired two-tailed Student’s t test. (B) Specific urine gravity (ratio of urine/water). Columns represent averages ± standard errors of specific urine gravity compared to water of wt and STIM1 ko mice fed normal, low or high protein diet. Statistical analysis was performed using a paired two-tailed Student’s t test.
Urine creatinine, urine urea, 24h urine urea, urine to plasma urea and fractional excretion of urea
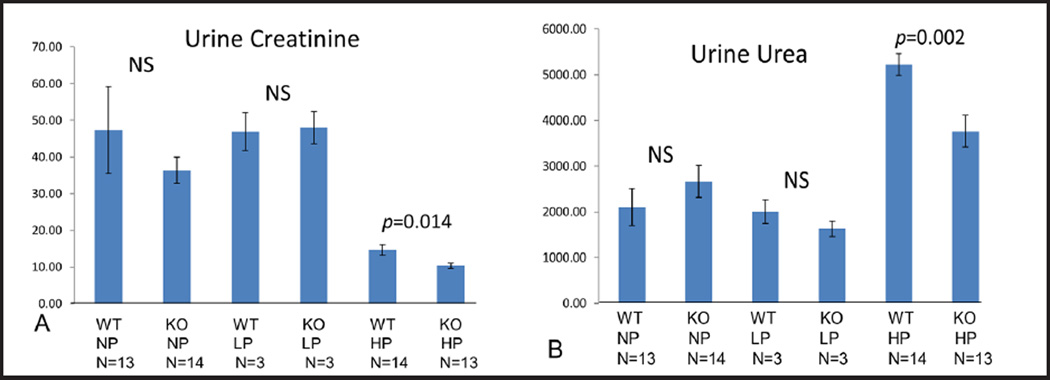
In STIM1 ko mice fed NP or LP diet urine creatinine was similar to wt mice fed NP or LP diet respectively (Fig. 3A) In STIM1 ko mice fed HP diet urine creatinine was significantly lower compared to wt mice fed HP diet (Fig. 3A). In STIM1 ko mice fed NP or LP diet urine urea was similar to wt mice fed NP or LP diet respectively (Fig. 3B). When mice were fed HP diet urine urea increased 2 fold in both ko and wt mice, which was expected (Fig. 3B). In STIM1 ko mice fed HP diet urine urea was significantly lower compared to wt mice fed HP diet (Fig. 3B). These data (Fig. 3A and B) support previous idea that STIM1 ko mice have impaired urinary concentrating ability when challenged with HP diet.
Fig. 3.
(A) Urine Creatinine (mg/dl). Columns represent averages ± standard errors of urine creatinine of wt and STIM1 ko mice fed normal, low or high protein diet. Statistical analysis was performed using a paired two-tailed Student’s t test. (B) Urine Urea(mg/dl). Columns represent averages ± standard errors of urine urea of wt and STIM1 ko mice fed normal, low or high protein diet. Statistical analysis was performed using a paired two-tailed Student’s t test.
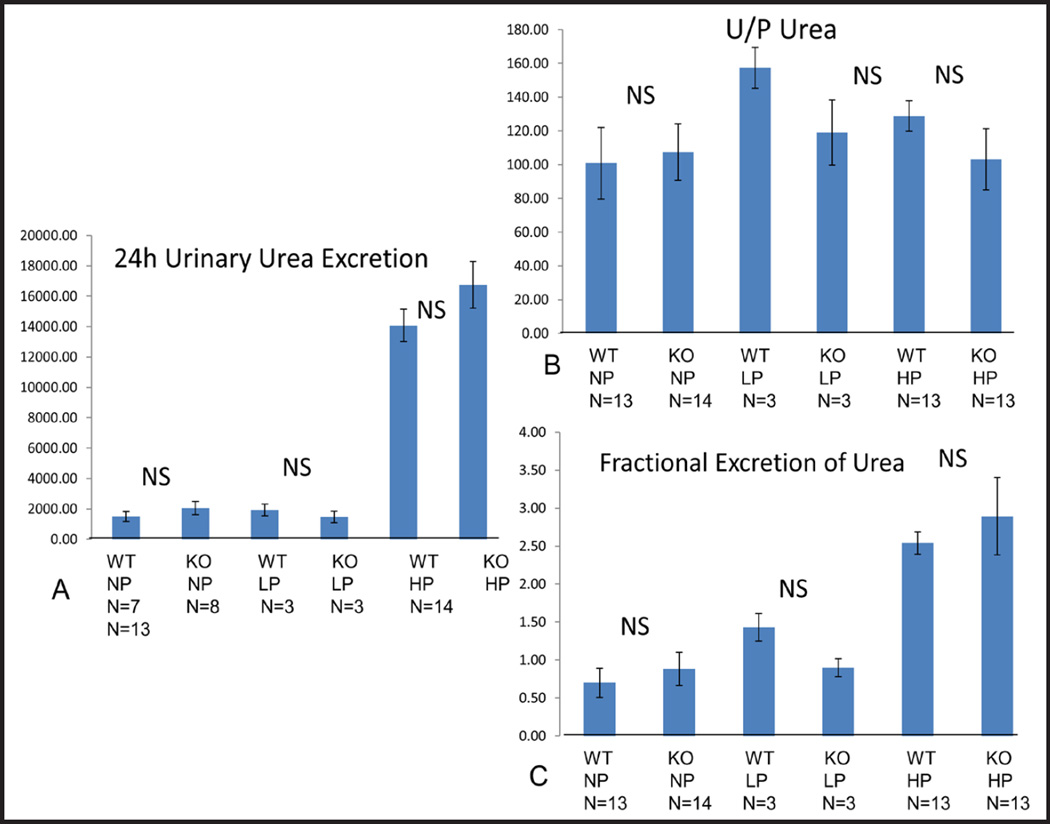
Next we asked whether STIM1 ko mice have impaired urea excretion. When we measured 24h urea excretion (4A), urine to plasma (U/P) urea (4B) and fractional excretion of urea (FEUr) (4C) we found no difference between STIM1 ko and wt mice fed either NP, LP or HP diet (Fig. 4A–C). Twenty four hour urine urea and FEUr was much higher in ko and wt mice fed HP diet compared to mice fed NP or LP diet which was expected (Fig. 4A–C).
Fig. 4.
(A) 24 h Urine Urea Excretion (mg/dl). Columns represent averages ± standard errors of 24 h urine urea excretion of wt and STIM1 ko mice fed normal, low or high protein diet. Statistical analysis was performed using a paired two-tailed Student’s t test. (B) Urine to Plasma Urea (Ratio). Columns represent averages ± standard errors of 24 h urine to plasma urea of wt and STIM1 ko mice fed normal, low or high protein diet. Statistical analysis was performed using a paired two-tailed Student’s t test. (C) Fractional Excretion of Urea (Ratio). Columns represent averages ± standard errors of fractional excretion of urea of wt and STIM1 ko mice fed normal, low or high protein diet. Statistical analysis was performed using a paired two-tailed Student’s t test.
Serum creatinine, BUN, albumin, CrCl and UrCl
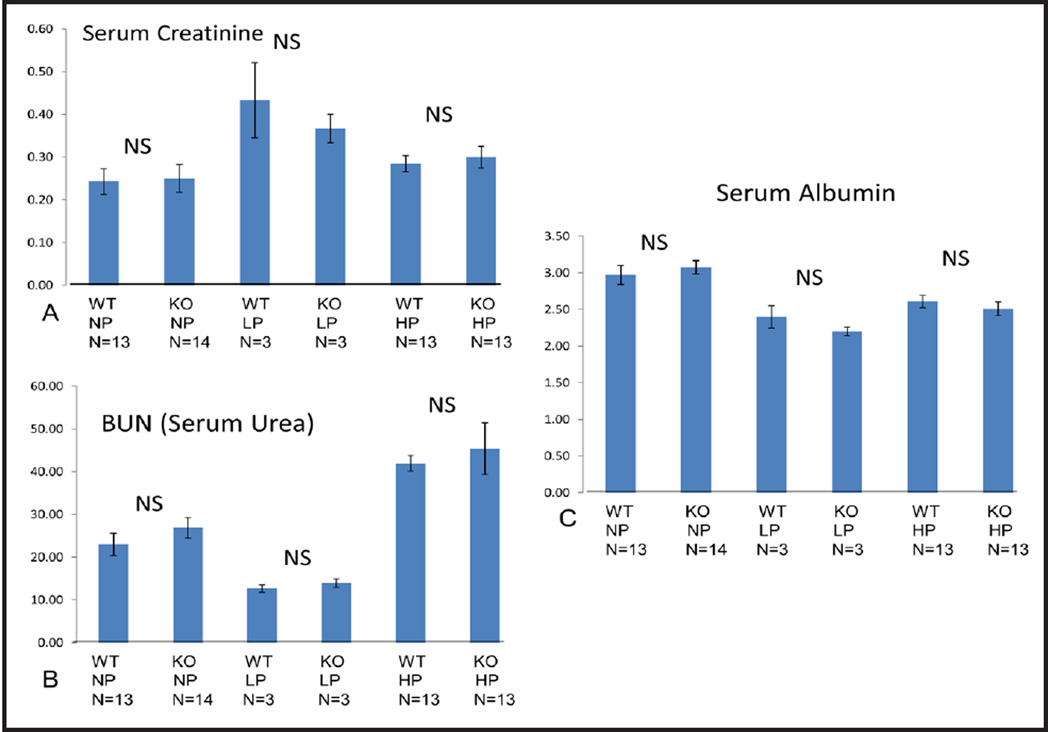
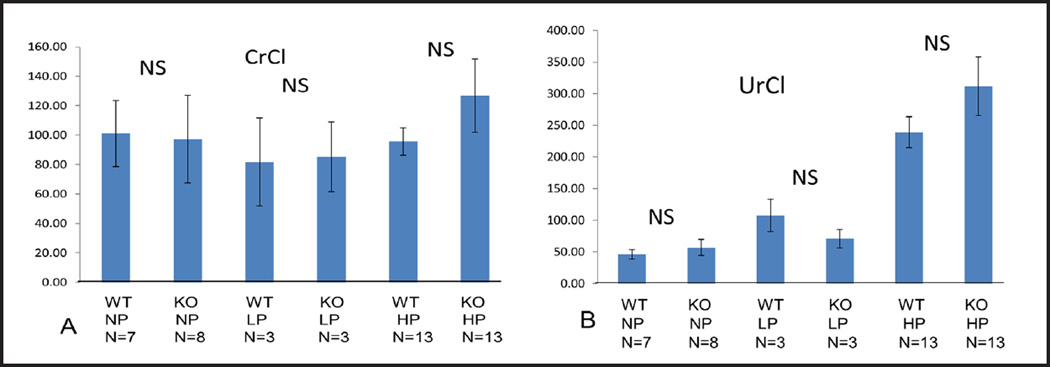
To assess renal function we measured serum creatinine (Fig. 5A) and BUN (Fig. 5B) and calculated CrCl (Fig. 6A) and UrCl (Fig. 6B). In STIM1 ko mice serum creatinine, BUN, CrCl and UrCl wasn’t significantly different compared to wt mice fed either NP, LP or HP diet (Fig. 5 and 6). These data suggest that renal function was not impaired in STIM1 ko mice. When serum albumin was measured there was no significant difference between STIM1 ko and wt mice on either NP, LP or HP diet (Fig. 5C).
Fig. 5.
(A) Serum creatinine (mg/dl). Columns represent averages ± standard errors of serum creatinine of wt and STIM1 ko mice fed normal, low or high protein diet. Statistical analysis was performed using a paired two-tailed Student’s t test. (B) Blood urea nitrogen (BUN) (mg/dl). Columns represent averages ± standard errors of BUN of wt and STIM1 ko mice fed normal, low or high protein diet. Statistical analysis was performed using a paired two-tailed Student’s t test. (C) Serum albumin (g/dl). Columns represent averages ± standard errors of serum albumin of wt and STIM1 ko mice fed normal, low or high protein diet. Statistical analysis was performed using a paired two-tailed Student’s t test.
Fig. 6.
(A) Creatinine clearance (CrCl) (µl/min). Columns represent averages ± standard errors of CrCl of wt and STIM1 ko mice fed normal, low or high protein diet. Statistical analysis was performed using a paired two-tailed Student’s t test. (B) Urea clearance (UrCl) (µl/min). Columns represent averages ± standard errors of UrCl of wt and STIM1 ko mice fed normal, low or high protein diet. Statistical analysis was performed using a paired two-tailed Student’s t test.
Serum Ca, Urine Ca, FECa and 24h urinary calcium excretion
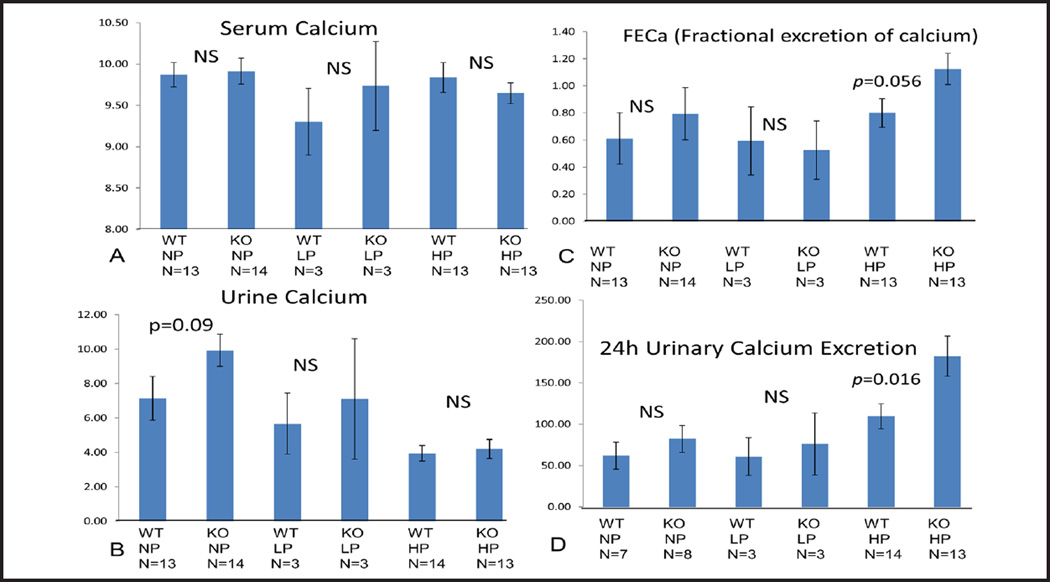
In STIM1 ko mice serum and urine calcium wasn’t significantly different compared to wt mice fed either NP, LP or HP diet (Fig. 7A and B). FECa and 24h urine calcium excretion in STIM1 ko mice wasn’t significantly different compared to wt mice fed either NP or LP diet (Fig. 7C and D). When mice were placed on HP diet FECa was increased (Fig. 7C) and 24 urinary calcium excretion was significantly increased in STIM1 ko mice compared to wt mice (Fig. 7D).
Fig. 7.
(A) Serum Calcium (mg/dl). Columns represent averages ± standard errors of serum calcium of wt and STIM1 ko mice fed normal, low or high protein diet. Statistical analysis was performed using a paired two-tailed Student’s t test. (B) Urine Calcium (mg/dl). Columns represent averages ± standard errors of urine calcium of wt and STIM1 ko mice fed normal, low or high protein diet. Statistical analysis was performed using a paired two-tailed Student’s t test. (C) Fractional Excretion of Calcium (FECa) (Ratio). Columns represent averages ± standard errors of FECa of wt and STIM1 ko mice fed normal, low or high protein diet. Statistical analysis was performed using a paired two-tailed Student’s t test. (D) 24 h Urinary Calcium Excretion (mg/dl). Columns represent averages ± standard errors of 24 h urinary calcium excretion of wt and STIM1 ko mice fed normal, low or high protein diet. Statistical analysis was performed using a paired two-tailed Student’s t test.
Kidney histology
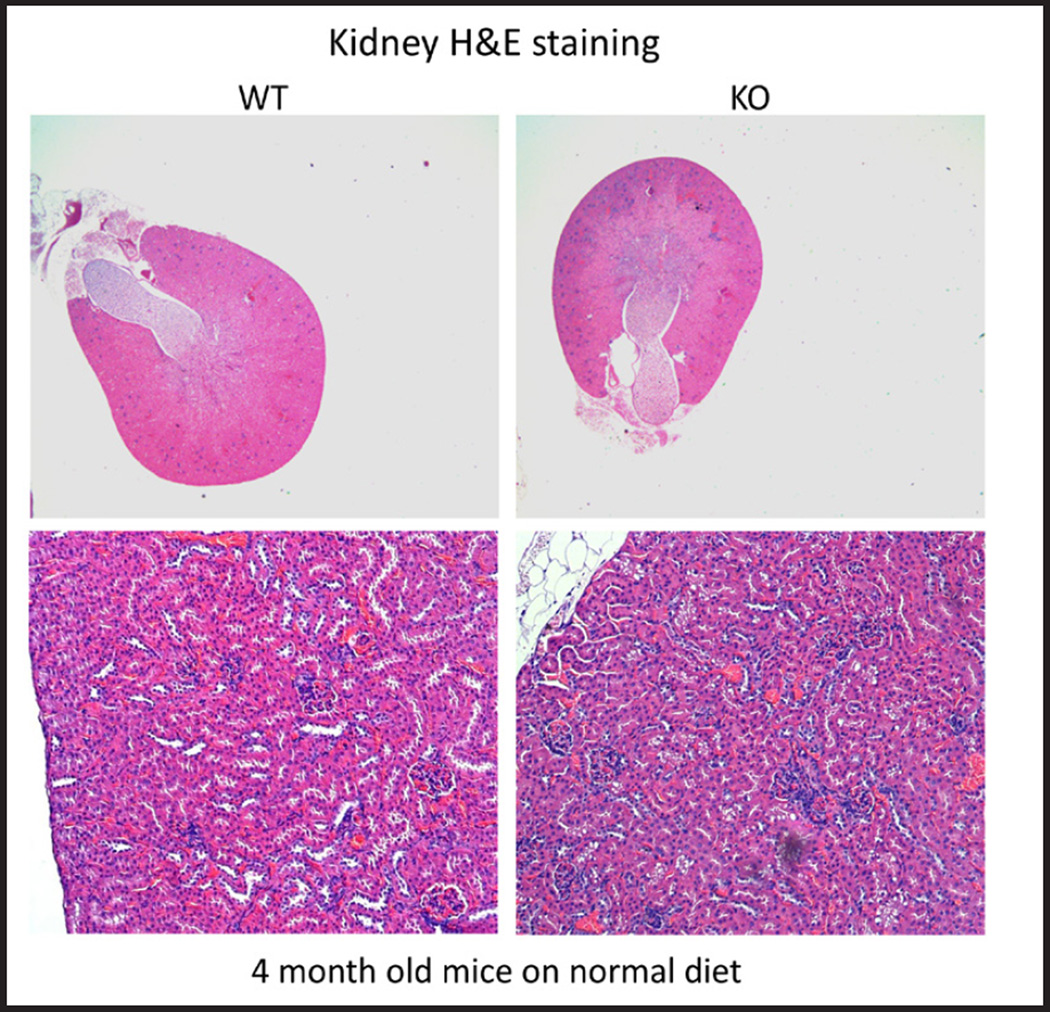
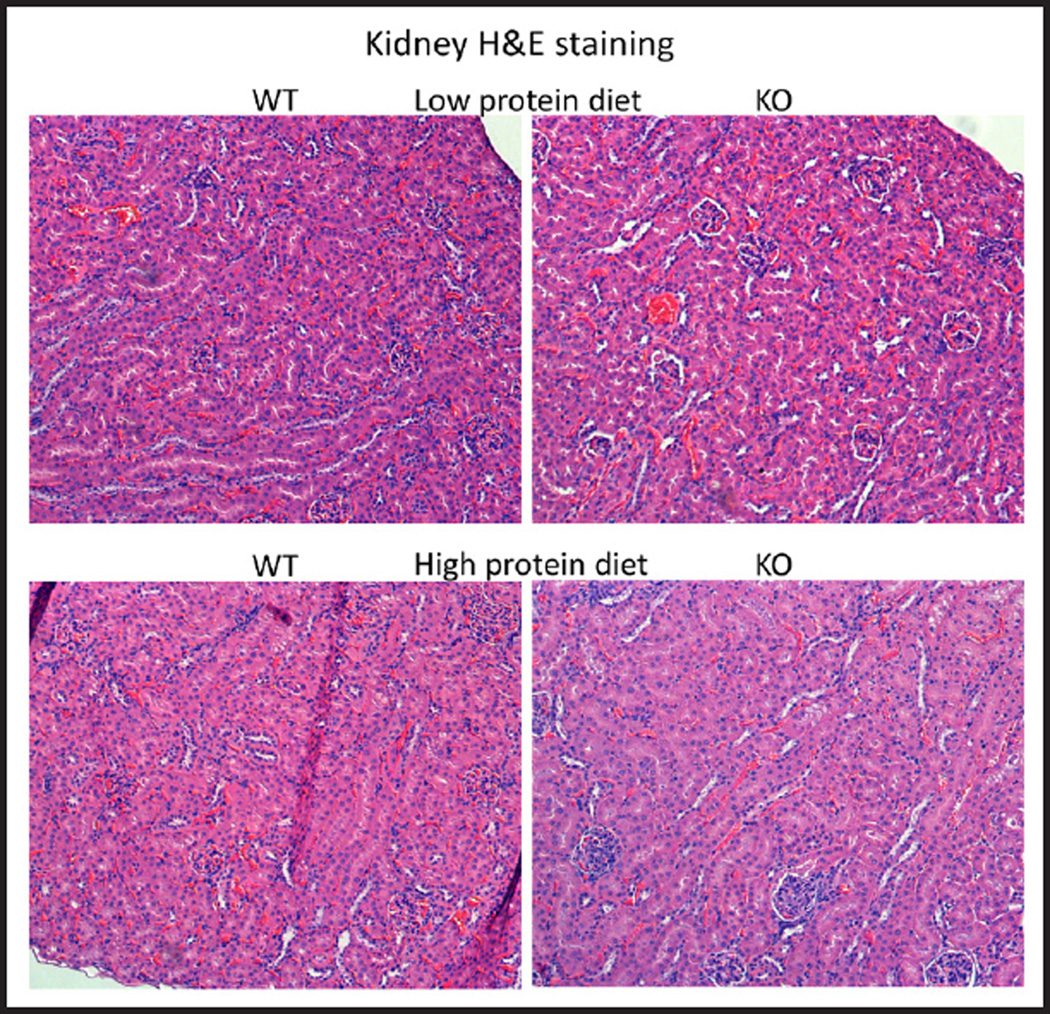
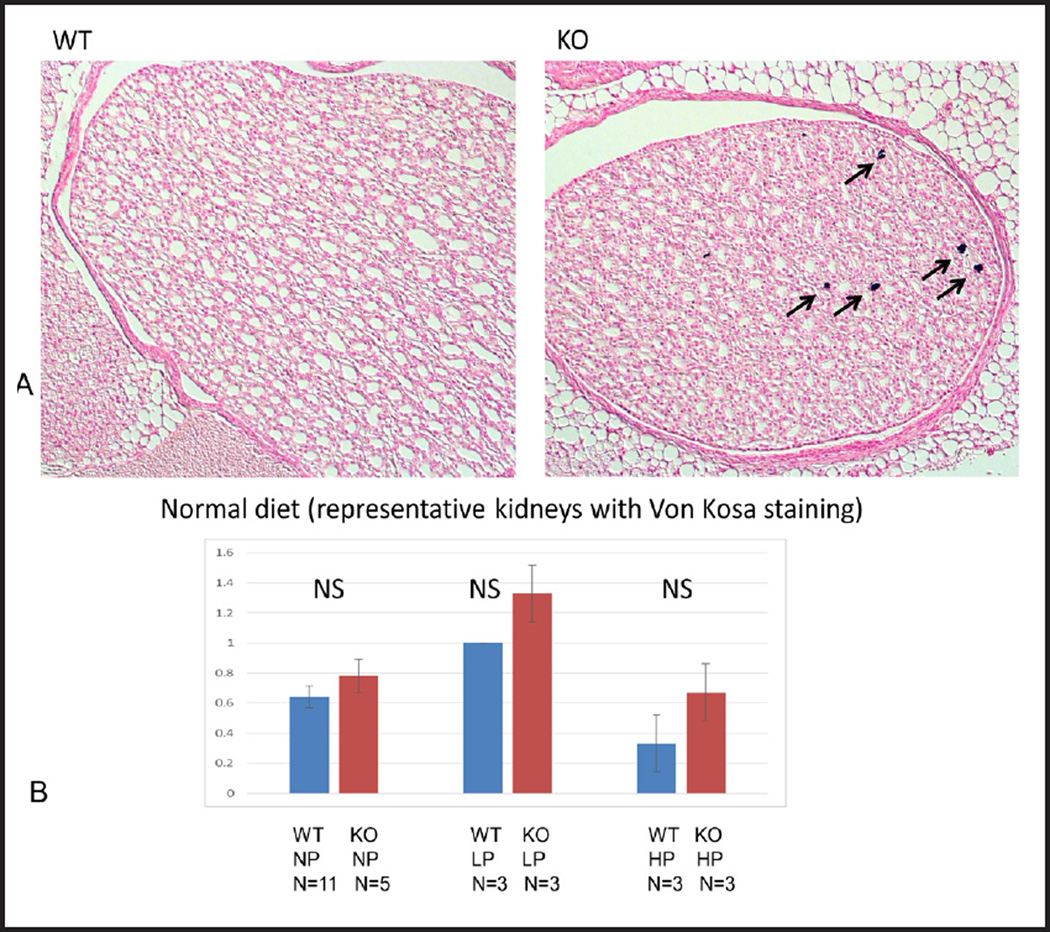
There were no major differences in histology of the cortex between STIM1 ko and wt mice fed either NP, LP or HP diet based on H&E staining (Fig. 8 and 9). Using Von Kossa stain, calcium deposits were evident in the papillae of STIM1 ko mice fed HP diet, while there was no difference in mice fed NP or LP diet (Fig. 10A and B).
Fig. 8.
Kidney histology. Representative images of kidney sections of wt and STIM1 ko mice fed normal protein diet. There is no difference in morphology of wt and STIM1 kidneys. H&E stained kidney sections from 4 month old mice.
Fig. 9.
Kidney histology. Representative images of kidney sections of wt and STIM1 ko mice fed low or high protein diet. There is no difference in morphology of STIM1 ko and wt kidneys with high or low protein diet. H&E stained kidney sections from 4 month old mice.
Fig. 10.
(A) Renal calcifications. Representative images of kidney sections of wt and STIM1 ko mice fed normal protein diet stained with Von Kossa. Arrows indicate calcium deposits in the papilla. Kidney sections are from 4 month old mice. (B) Nephrocalcinosis quantification. Columns represent averages ± standard errors of quantified calcium deposits of wt and STIM1 ko mice fed normal, low or high protein diet. Quantification was based on the following grading schema: 0 = no calcium, 1 = 1–4 calcium deposits, 2 = 5–8 calcium deposits, 3 = greater than 8 calcium deposits. Statistical analysis was performed using a paired two-tailed.
Discussion
We describe here a Stim1fl/fl Ksp-cre mouse where STIM1 was silenced in thick ascending limb of the loop of Henle, distal tubules and collecting ducts. Stim1fl/fl Ksp-cre mouse is viable and does not have gross morphological abnormalities. When fed normal protein diet Stim1fl/fl Ksp-cre mice are similar to wt mice based on serum markers such as creatinine, BUN, calcium and albumin and urinary markers such as calcium, creatinine, urea and specific gravity. In addition, creatinine clearance, urea clearance, fractional excretion of calcium and 24 hour calcium was similar in Stim1fl/fl Ksp-cre mice compared to wt mice. This data indicate that STIM1 does not affect renal function.
Next, we decided to challenge Stim1fl/fl Ksp-cre mice with low and high protein diet. High protein diet leads to increased urea production. Urea causes osmotic diuresis leading to water loss by the kidney. In compensation there will be increased reabsorption of free water in the collecting duct to prevent dehydration [26]. We showed that Stim1fl/fl Ksp-cre mice fed low protein diet are similar to wt mice based on serum markers such as creatinine, BUN, calcium and albumin, urinary markers such as calcium, creatinine, urea and specific gravity and renal function markers such as creatinine clearance and urea clearance. Interestingly, Stim1fl/fl Ksp-cre mice fed high protein diet had increased urine volume that was diluted based on urine specific gravity, urine creatinine and urine urea compared to wt mice. Hence Stim1fl/fl Ksp-cre mice have impaired ability to concentrate urine when challenged with high protein urine diet. On the other hand, 24 hour urinary urea excretion and fractional excretion of urea was similar in Stim1fl/fl Ksp-cre and wt mice fed high protein diet indicating that STIM1 has no effect on urea transport.
We showed that renal function (based on serum creatinine, BUN, creatinine clearance and urea clearance) is similar in Stim1fl/fl Ksp-cre and wt mice fed either low or high protein diet. This data indicate again that STIM1 does affect renal function even when mice are challenged with high protein diet that causes increased urine volume due to osmotic diuresis.
Since STIM1 plays a role in calcium signaling and homeostasis [27], we measured calcium parameters. We showed that serum calcium, 24 hour urinary calcium excretion and fractional excretion of calcium was similar in Stim1fl/fl Ksp-cre and wt mice fed either normal or low protein diet. Interestingly, Stim1fl/fl Ksp-cre mice fed high protein diet had increased calcium excretion. In summary Stim1fl/fl Ksp-cre mice challenged with high protein diet have increased urine volume due to impaired ability to concentrate urine and increased calcium excretion. It is not clear what leads to impaired ability to concentrate urine and increased calcium excretion and this will have to be explored in the future.
The role of STIM1 in V2R signaling is currently unknown. In addition to affecting the expression levels of AQP2 and V2R, STIM1 could affect AVP signaling either through 1) its control of SOCE or 2) through a direct effect of STIM1 on adenylyl cyclase activity. Studies have shown that AVP increases cAMP through two types of Ca2+-dependent adenylyl cyclase: AC6, which is inhibited by Ca2+ and AC3, which is activated by calcium/calmodulin, [28, 29]. It is possible that both cyclases function together under certain physiological conditions [30]. AC6, expressed in the outer and inner medullary collecting ducts is inhibited by micromolar quantities of Ca2+. Prolonged exposure to AVP and the resultant increase in intracellular Ca2+ would ultimately inhibit AC6 thus, dampening the cellular response to AVP. Thus, AC6’s activity would dampened the response to prolonged AVP exposure. Hence, we speculate STIM1 could affect the functioning of Ca2+-dependent adenylyl cyclases by regulating SOCE. Alternately, STIM1 may have a direct effect on AC activity. Lifkimmiatis et al. [31] have shown that blocking the translocation of STIM1 to the plasma membrane reduces cAMP production [31], implying a more direct action of STIM1 on AC activity.
A plausible hypothesis for impaired urinary concentration ability would be that levels of cAMP are reduced in Stim1fl/fl Ksp-cre mice. Reduced cAMP levels will result in decreased insertion of AQP2 in collecting ducts. Decreased insertion of AQP2 would explain impaired urinary concentration ability in Stim1fl/fl Ksp-cre mice.
Conclusion
The Stim1fl/fl Ksp-cre mouse model will be useful to study molecular mechanisms of STIM1 and its role in the con-centrating mechanism in kidney.
Acknowledgments
We wish to thank Paul Worley for the STIM1 knockout mice. Funded by the National Institutes of Health Grant Number DK32753. The authors acknowledge the Baltimore Polycystic Kidney Disease Center. The authors also acknowledge Dr. Deborah McClellan for editing the manuscript.
Abbreviations
- AQP2
aquaporin 2
- AVP
arginine vasopressin
- ER
endoplasmic reticulum
- IP3
inositol triphosphate
- MDCK
madin darby canine kidney
- ORAI
Calcium release-activated calcium channel protein
- V2R
vasopressin receptor 2
- SOCE
store operated Ca2+ entry
- STIM1
Stromal interaction molecule 1
Footnotes
Disclosure Statement
The authors declare that WBG has a consultant agreement with the Vertex Corporation. LC has a license agreement with the Vertex Corporation for mutant cell lines. Neither of these are related to the current manuscript.
References
- 1.Williams RT, Senior PV, Van SL, Layton JE, Smith PJ, Dziadek MA. Stromal interaction molecule 1 (STIM1), a transmembrane protein with growth suppressor activity, contains an extracellular SAM domain modified by N-linked glycosylation. Biochim Biophys Acta. 2002;1596:131–137. doi: 10.1016/s0167-4838(02)00211-x. [DOI] [PubMed] [Google Scholar]
- 2.Zhang SL, Yu Y, Roos J, Kozak JA, Deerinck TJ, Ellisman MH, Stauderman KA, Cahalan MD. STIM1 is a Ca2+ sensor that activates CRAC channels and migrates from the Ca2+ store to the plasma membrane. Nature. 2005;437:902–905. doi: 10.1038/nature04147. [DOI] [PMC free article] [PubMed] [Google Scholar]
- 3.Prakriya M, Feske S, Gwack Y, Srikanth S, Rao A, Hogan PG. Orai1 is an essential pore subunit of the CRAC channel. Nature. 2006;443:230–233. doi: 10.1038/nature05122. [DOI] [PubMed] [Google Scholar]
- 4.Huang GN, Zeng W, Kim JY, Yuan JP, Han L, Muallem S, Worley PF. STIM1 carboxyl-terminus activates native SOC, I(crac) and TRPC1 channels. Nat Cell Biol. 2006;8:1003–1010. doi: 10.1038/ncb1454. [DOI] [PubMed] [Google Scholar]
- 5.Soboloff J, Spassova MA, Tang XD, Hewavitharana T, Xu W, Gill DL. Orai1 and STIM reconstitute store-operated calcium channel function. J Biol Chem. 2006;281:20661–20665. doi: 10.1074/jbc.C600126200. [DOI] [PubMed] [Google Scholar]
- 6.Jousset H, Frieden M, Demaurex N. STIM1 knockdown reveals that store-operated Ca2+ channels located close to SERCA pumps silently refill the endoplasmic reticulum. J Biol Chem. 2007;282:11456–11464. doi: 10.1074/jbc.M609551200. [DOI] [PubMed] [Google Scholar]
- 7.Kishore BK, Terris JM, Knepper MA. Quantitation of aquaporin-2 abundance in microdissected collecting ducts: Axial distribution and control by AVP. Am J Physiol. 1996;271:F62–F70. doi: 10.1152/ajprenal.1996.271.1.F62. [DOI] [PubMed] [Google Scholar]
- 8.Fenton RA, Knepper MA. Mouse models and the urinary concentrating mechanism in the new millennium. Physiol Rev. 2007;87:1083–1112. doi: 10.1152/physrev.00053.2006. [DOI] [PubMed] [Google Scholar]
- 9.Ecelbarger CA, Chou CL, Lolait SJ, Knepper MA, DiGiovanni SR. Evidence for dual signaling pathways for V2 vasopressin receptor in rat inner medullary collecting duct. Am J Physiol. 1996;270:F623–F633. doi: 10.1152/ajprenal.1996.270.4.F623. [DOI] [PubMed] [Google Scholar]
- 10.Chou CL, Yip KP, Michea L, Kador K, Ferraris JD, Wade JB, Knepper MA. Regulation of aquaporin-2 trafficking by vasopressin in the renal collecting duct. Roles of ryanodine-sensitive Ca2+ stores and calmodulin. J Biol Chem. 2000;275:36839–36846. doi: 10.1074/jbc.M005552200. [DOI] [PubMed] [Google Scholar]
- 11.Woodward OM, Li Y, Yu S, Greenwell P, Wodarczyk C, Boletta A, Guggino WB, Qian F. Identification of a polycystin-1 cleavage product, P100, that regulates store operated Ca entry through interactions with STIM1. PLoS One. 2010;5:e12305. doi: 10.1371/journal.pone.0012305. [DOI] [PMC free article] [PubMed] [Google Scholar]
- 12.Li Y, Santoso NG, Yu S, Woodward OM, Qian F, Guggino WB. Polycystin-1 interacts with inositol 1,4,5-trisphosphate receptor to modulate intracellular Ca2+ signaling with implications for polycystic kidney disease. J Biol Chem. 2009;284:36431–36441. doi: 10.1074/jbc.M109.068916. [DOI] [PMC free article] [PubMed] [Google Scholar]
- 13.Santoso NG, Cebotaru L, Guggino WB. Polycystin-1, 2, and STIM1 interact with IP(3)R to modulate ER Ca release through the PI3K/Akt pathway. Cell Physiol Biochem. 2011;27:715–726. doi: 10.1159/000330080. [DOI] [PMC free article] [PubMed] [Google Scholar]
- 14.Wilson PD. Polycystin: new aspects of structure, function, and regulation. J Am Soc Nephrol. 2001;12:834–845. doi: 10.1681/ASN.V124834. [DOI] [PubMed] [Google Scholar]
- 15.Hanaoka K, Qian F, Boletta A, Bhunia AK, Piontek K, Tsiokas L, Sukhatme VP, Guggino WB, Germino GG. Co-assembly of polycystin-1 and -2 produces unique cation-permeable currents. Nature. 2000;408:990–994. doi: 10.1038/35050128. [DOI] [PubMed] [Google Scholar]
- 16.Cai Y, Maeda Y, Cedzich A, Torres VE, Wu G, Hayashi T, Mochizuki T, Park JH, Witzgall R, Somlo S. Identification and char-acterization of polycystin-2, the PKD2 gene product. J Biol Chem. 1999;274:28557–28565. doi: 10.1074/jbc.274.40.28557. [DOI] [PubMed] [Google Scholar]
- 17.Torres VE, Harris PC. Polycystic kidney disease: genes, proteins, animal models, disease mechanisms and therapeutic opportunities. J Intern Med. 2007;261:17–31. doi: 10.1111/j.1365-2796.2006.01743.x. [DOI] [PubMed] [Google Scholar]
- 18.Calvet JP, Grantham JJ. The genetics and physiology of polycystic kidney disease. Semin Nephrol. 2001;21:107–123. doi: 10.1053/snep.2001.20929. [DOI] [PubMed] [Google Scholar]
- 19.Wei W, Hackmann K, Xu H, Germino G, Qian F. Characterization of cis-autoproteolysis of polycystin-1, the product of human polycystic kidney disease 1 gene. J Biol Chem. 2007;282:21729–21737. doi: 10.1074/jbc.M703218200. [DOI] [PubMed] [Google Scholar]
- 20.Bertuccio CA, Caplan MJ. Polycystin-1C terminus cleavage and its relation with polycystin-2, two proteins involved in polycystic kidney disease. Medicina (B Aires) 2013;73:155–162. [PubMed] [Google Scholar]
- 21.Yu S, Hackmann K, Gao J, He X, Piontek K, Garcia-Gonzalez MA, Menezes LF, Xu H, Germino GG, Zuo J, Qian F. Essential role of cleavage of Polycystin-1 at G protein-coupled receptor proteolytic site for kidney tubular structure. Proc Natl Acad Sci USA. 2007;104:18688–18693. doi: 10.1073/pnas.0708217104. [DOI] [PMC free article] [PubMed] [Google Scholar]
- 22.Wu Z, Qing J, Wang K, Xia Y, Zhang F. Suppression of stromal interaction molecule 1 inhibits SMMC7721 hepatocellular carcinoma cell proliferation by inducing cell cycle arrest. Biotechnol Appl Biochem. 2015;62:107–111. doi: 10.1002/bab.1245. [DOI] [PubMed] [Google Scholar]
- 23.Igarashi P, Shashikant CS, Thomson RB, Whyte DA, Liu-Chen S, Ruddle FH, Aronson PS. Ksp-cadherin gene promoter. II. Kidney-specific activity in transgenic mice. Am J Physiol. 1999;277:F599–F610. doi: 10.1152/ajprenal.1999.277.4.F599. [DOI] [PubMed] [Google Scholar]
- 24.Shao X, Somlo S, Igarashi P. Epithelial-specific Cre/lox recombination in the developing kidney and genitourinary tract. J Am Soc Nephrol. 2002;13:1837–1846. doi: 10.1097/01.asn.0000016444.90348.50. [DOI] [PubMed] [Google Scholar]
- 25.Shao X, Johnson JE, Richardson JA, Hiesberger T, Igarashi P. A minimal Ksp-cadherin promoter linked to a green fluorescent protein reporter gene exhibits tissue-specific expression in the developing kidney and genitourinary tract. J Am Soc Nephrol. 2002;13:1824–1836. doi: 10.1097/01.asn.0000016443.50138.cd. [DOI] [PubMed] [Google Scholar]
- 26.Fenton RA, Flynn A, Shodeinde A, Smith CP, Schnermann J, Knepper MA. Renal phenotype of UT-A urea transporter knockout mice. J Am Soc Nephrol. 2005;16:1583–1592. doi: 10.1681/ASN.2005010031. [DOI] [PMC free article] [PubMed] [Google Scholar]
- 27.Chakrabarti R, Chakrabarti R. Calcium signaling in non-excitable cells: Ca2+ release and influx are independent events linked to two plasma membrane Ca2+ entry channels. J Cell Biochem. 2006;99:1503–1516. doi: 10.1002/jcb.21102. [DOI] [PubMed] [Google Scholar]
- 28.Rieg T, Kohan DE. Regulation of nephron water and electrolyte transport by adenylyl cyclases. Am J Physiol Renal Physiol. 2014;306:F701–F709. doi: 10.1152/ajprenal.00656.2013. [DOI] [PMC free article] [PubMed] [Google Scholar]
- 29.Roos KP, Strait KA, Raphael KL, Blount MA, Kohan DE. Collecting duct-specific knockout of adenylyl cyclase type VI causes a urinary concentration defect in mice. Am J Physiol Renal Physiol. 2012;302:F78–F84. doi: 10.1152/ajprenal.00397.2011. [DOI] [PMC free article] [PubMed] [Google Scholar]
- 30.Strait KA, Stricklett PK, Chapman M, Kohan DE. Characterization of vasopressin-responsive collecting duct adenylyl cyclases in the mouse. Am J Physiol Renal Physiol. 2010;298:F859–F867. doi: 10.1152/ajprenal.00109.2009. [DOI] [PMC free article] [PubMed] [Google Scholar]
- 31.Lefkimmiatis K, Srikanthan M, Maiellaro I, Moyer MP, Curci S, Hofer AM. Store-operated cyclic AMP signalling mediated by STIM1. Nature Cell Biology. 2009;11:433–442. doi: 10.1038/ncb1850. [DOI] [PubMed] [Google Scholar]


