
Figure 7.
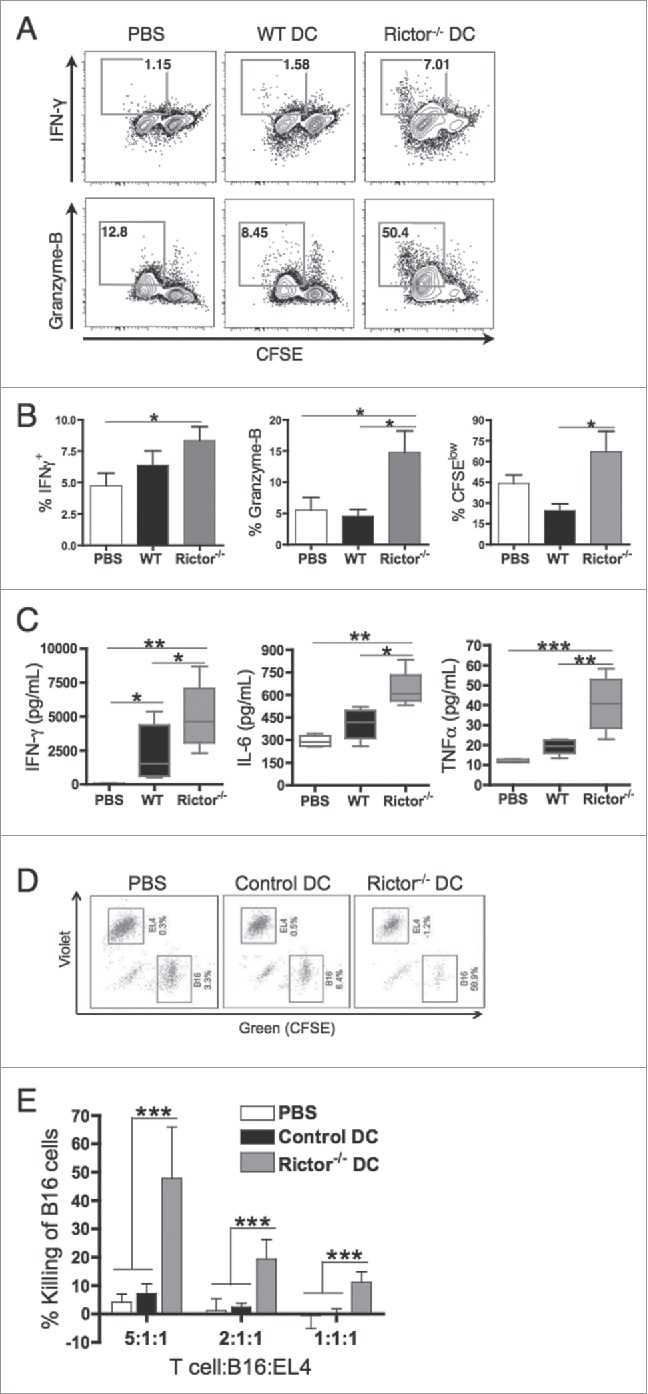
Rictor−/− DC administration enhances activation of antitumor CD8+ T cells in the periphery. C57BL/6 mice bearing s.c. B16 melanomas were treated at days 7 and 14 post-tumor inoculation with i.t. injection of 106 control DC or Rictor−/− DC. At day 21 post-tumor inoculation, spleens were harvested and (A, B, C) splenocytes stained with CFSE and then stimulated with irradiated (100 Gy) B16 cells (ratio 10:1 respectively) in the presence of 30 IU/mL recombinant human IL-2 for 5 d in 24-well culture plates. (A, B) Responder T cells were analyzed for CD8+ and intracellular IFNγ and granzyme-B, showing (A) representative plots and (B) means + SD for six animals per group reported from three independent experiments performed. (C) Cell-free supernatants of these cultures were analyzed for IFNγ, IL-6 and TNF-α. Box plots show median, 25%- and 75%-quartiles, and both extreme values. (D, E) Splenic CD8+ T cells isolated from untreated (PBS), control-DC- or Rictor−/− DC-treated mice were cultured with CFSE-labeled B16 melanoma cells and violet-labeled irrelevant control EL4 thymoma cells at ratios of 5:1:1, 2:1:1 or 1:1:1 (where a unit of 1 = 5 × 10⁴ cells) for 18 h. Cells were analyzed by flow cytometry to determine the percentage of viable B16 (green) or EL4 (violet) cells, as shown in (D), versus a control consisting of a 1:1 mixture of each of the labeled tumor cell lines in the absence of T cells. (E) Results are reported as means +/− SD of data obtained from five mice/cohort. Percent killing was determined based on the formula: 100% × [1 – (percentage of viable tumor cells in the presence of T cells/percentage of viable tumor cells in the absence of T cells)]. *p < 0.05, **p < 0.01, ***p < 0.001.