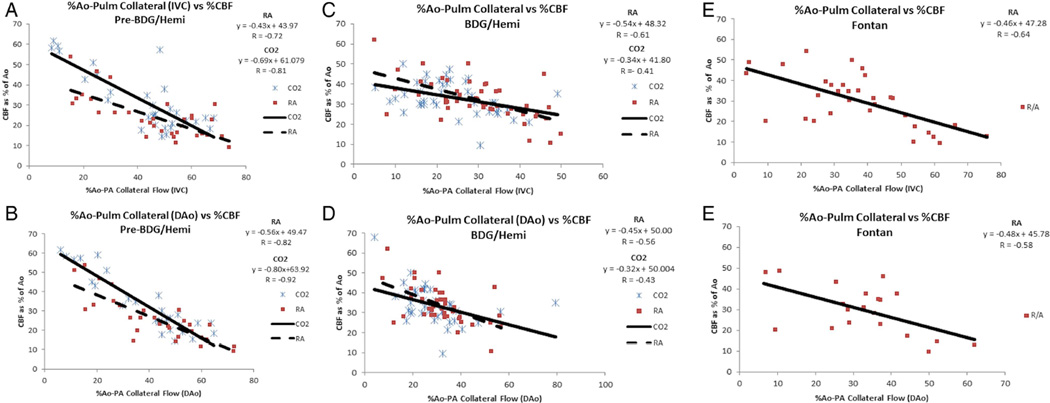
Figure 2.
Relationship between CBF and APC flow indexed to aortic output in the entire cohort. Pre-BDG (A), after BDG (B), after Fontan (C). IVC is used for top figure and DAo is used in bottom figure. Note the inverse correlation between CBF and APC flow at all stages. This remains true whether on room air (solid line, boxes) or in hypercarbia (dashed line, cross-hatch). Ao, aorta; APC, aortic-to-pulmonary collateral; BDG, bidirectional Glenn; CBF, cerebral blood flow; CO2, carbon dioxide; DAo, descending aorta; IVC, inferior vena cava; RA, room air.

