

Abstract
Critical to the clinical evaluation of effective novel therapies for lung cancer is the early and accurate determination of tumor response, which requires an understanding of the sources of uncertainty in tumor measurements and subsequent attempts to minimize their impact on the assessment of the agent. The Reference Image Database to Evaluate Response (RIDER) project seeks to develop a consensus approach to the optimization and benchmarking of software tools for the assessment of tumor response to therapy and to provide a publicly available database of serial images acquired during lung cancer drug and radiation therapy trials. Images of phantoms and patient images acquired under situations of certain no change in tumor size or biology also will be provided. The RIDER project will create standardized methods for benchmarking software tools to reduce sources of uncertainty in vital clinical decisions such as whether a specific tumor is responding to therapy.
A. Background
Lung cancer, the most common cause of cancer death in both men and women in the United States, has a 15% overall 5-year survival rate (1)—a survival rate that has not changed significantly in over 20 years. Lung cancer is strongly associated with cigarette smoking, known at least since the Surgeon General’s Report of 1954; however, public health measures to abolish tobacco exposure have failed. Therefore, new novel therapeutic agents must be quickly introduced and rapidly evaluated for effectiveness. Although such developments have begun (2), therapeutic response assessment has failed to keep pace with potential therapeutic advances.
In the late 1970’s, the National Institutes of Health (NIH) supported an examination of screening for lung cancer in at-risk populations using sputum cytology and chest radiographs (3–5); these early screening studies failed to demonstrate a mortality benefit. Current studies are underway to re-evaluate screening using improved sputum tests, multi-detector row CT (MDCT), and, in some cases, bronchoscopy with special bronchoscopes to detect subtle differences in airway mucosal fluorescence (6). The MDCT studies, most notably the Early Lung Cancer Action Project (ELCAP) (7), the Mayo Clinic study (8), and studies in Japan (9), have provided important information regarding lung cancer detection. More recently, the National Lung Screening Trial (NLST) (10), a multi-center, NIH-funded study, involving nearly 50,000 at-risk smokers (half randomized to chest radiographs, the other to MDCT), has met its accrual target.
Despite the sensitivity of MDCT for the detection of lung nodules, it is difficult to discriminate the early signs of malignancy on MDCT from the much more common benign processes that also appear as lung nodules, especially in regions of the Unites States where fungal diseases such as histoplasmosis are endemic. Only a small fraction of detected lung nodules are indeed cancer. The current standard of care for a detected small nodule (< 8 mm in diameter) is a repeat MDCT scan in 3 months and subsequently at 3-monthly or 6-monthly intervals to assess growth of the nodule. Consequently, early detection is not translated into early diagnosis and early treatment, a phenomenon known as the lung cancer paradox (i.e., early detection of lung cancer is possible, but early treatment is not); however, increasing precision of trancutaneous needle sampling and increasing yields from bronchoscopic biopsies with the assistance of 3D computer-generated graphics, magnetic guidance, and magnetic tracking devices are helping to resolve this paradox (11).
Currently the best hope of lung cancer cure is surgical resection of a small peripheral lung nodule, which is currently possible in about 15% of patients presenting with early stage disease (the other patients present with later stage disease or are not surgical candidates due to co-morbidities). Those patients not able to receive surgery are often treated with chemotherapy, with or without associated external beam radiotherapy. Treatment protocols vary across the country and may include group protocol studies and clinical trials. New biological response modifiers for lung cancer therapy have received increased interest recently. These generally less-toxic agents are targeted to affect the tumor blood supply or other critical pathways in cancer cell growth, differentiation, or metastatic processes. The end point of such therapies may not be lung cancer “disappearance” but rather tumor growth cessation.
Strategies for disease response assessment must accommodate a wide range of treatment options. For example, subtle changes in the lung cancer CT density, margins, or other pixel-based features may signal a useful response at an early stage of therapy, blood flow may be an important measure for tumor-vasculature-based changes, and metabolic changes may be measured by PET. Critical to the image-based evaluation of either tumor growth or response to therapy is a much-improved understanding of the three-dimensional anatomic/pathologic structure of lung cancers. Assessments based on two-dimensional pathology slides indicate that malignant cells occupy only a fraction of a lung nodule’s volume, the remainder consisting of inflammatory cells, edema, fibrosis, or necrosis. Understanding the three-dimensional structure of lung cancer pathologically is critical to the evaluation of three-dimensional imaging modalities. Future response assessment protocols could then target specifically the lung cancer component of a lung nodule or bio-mass.
The current standard method to measure tumor response using CT and other modalities is referred to as Response Evaluation Criteria in Solid Tumors (RECIST), which is based on unidimensional, linear measurements of tumor diameter (12, 13). In promoting the summed linear measurement of a limited number of target tumors, RECIST offers a simple approach that requires minimal effort. The RECIST guidelines, however, presume that tumors are spherical and change in a similar manner. Significant variability in the RECIST measures exists among different observers (14), and published work generally focuses on the surrogate of “best overall response,” with only a few methods addressing other imaging endpoints such as “time to progression” and “disease-free survival.” As a therapy response measurement procedure, RECIST maps linear data into an established set of four discrete categories: complete response, partial response, stable disease, and progressive disease. These categorical bins, however, are quite coarse, with most trial analyses critically pivoting on partial response (defined by a 30% linear sum reduction) and progressive disease (defined by a 20% increase in tumor dimension). Furthermore, if the lung cancer volume is mostly inflammation, then linear size change alone may give a false impression of therapy response (the inflammation improved, but the cancerous component did not); in fact, a tumor may slightly increase in size after initiation of therapy due to inflammatory reactions. With newer chemotherapeutic agents and radiotherapy techniques, change in tumor diameter may be inadequate to assess response. Therefore, to improve the assessment of time-to-response and to reduce observer variation, other parameters such as attenuation changes, margin contour alterations, or pixel intensity changes across temporally sequential CT scans will be required, especially as improved imaging techniques and registration methods become available.
In this paper we summarize a recent initiative to develop a consensus approach to the benchmarking of software tools for the assessment of tumor response to therapy and to provide a publicly available database of images and associated metadata. The Reference Image Database to Evaluate Response to therapy in lung cancer (RIDER) project is generating a database of temporally sequential CT scans (and other imaging modalities) of lung cancer subjects collected longitudinally over the course of non-surgical cancer therapy. The database will also include phantom images of synthetic lung nodules and short-interval patient scans for the evaluation of the variance and bias of change analysis software tools. This project evolved from the Lung Image Database Consortium (LIDC), which is creating a publicly available database of annotated thoracic CT scans as a reference standard for the development, training, and evaluation of computer-aided diagnostic (CAD) methods for lung cancer detection and diagnosis.
B. RIDER project
The RIDER project was initiated in 2004 as a collaboration among the NCI’s Cancer Imaging Program, the NCI’s Center for Bioinformatics, the National Institute of Biomedical Imaging and Bioengineering (NIBIB), and the Cancer Research and Prevention Foundation (CRPF), with information technology support from the Radiological Society of North America (RSNA). The RIDER project was designed, and continues to evolve, through a consensus process among members of the RIDER steering committee, comprised of academic researchers, program staff at NCI, and members of caBIG (Cancer Biomedical Informatics Grid), NIBIB, the Food and Drug Administration (FDA), and the National Institute of Standards and Technology (NIST). The broad purpose of the RIDER project is to develop a public resource of serial (i.e., temporally sequential) images acquired during the course of various lung cancer drug and radiation therapy trials across multiple centers so that change analysis software tools may be optimized and benchmarked prior to use in future trials. The data, which will be available to academic researchers and the device and pharmaceutical industries, will include images from CT and other modalities such as PET/CT and magnetic resonance (MR) imaging along with relevant metadata and clinical outcomes. Images of physical phantoms and patient images acquired under situations of certain no change in tumor size or biology (in which the “true” change is known) also will be provided and will play a key role in the assessment of software tool performance. The RIDER project will highlight the importance of creating standardized methods for benchmarking software tools to reduce sources of uncertainty in vital clinical decisions such as whether a specific tumor is responding to therapy.
The longer-term goal of RIDER is to help identify biomarkers to measure cancer therapy response. Such biomarkers could potentially be adopted in clinical trials submitted to the FDA for regulatory approval. In addition, the Centers for Medicare and Medicaid Services (CMS) seeks evidence to support informed reimbursement decisions for biomarkers that may eventually be used clinically. Consequently, the RIDER project is expected to accelerate FDA approval of software-based response assessment tools (and therapeutic agents evaluated through clinical trials that use such tools) and CMS reimbursement for subsequent therapeutic decisions made using such software tools.
New therapies are clearly needed for lung cancer, and indeed new therapies have been, and continue to be, developed by the pharmaceutical industry and through NIH-funded academic research. Critical to the clinical evaluation of effective novel therapies is the early and accurate determination of tumor response, which would substantially reduce the numbers of subjects in clinical trials, the duration of the trial, and the costs. Critical to the early and accurate determination of tumor response, however, is an understanding of the sources of uncertainty in these tumor response measurements, with subsequent attempts to minimize their impact on the assessment of novel therapeutic agents. Measurement variability is associated with two interrelated factors: (a) the different commercial systems used to acquire images and (b) the different image analysis software tools used to measure temporal changes in image features. The development of standardized methods to physically characterize these two sources of uncertainty would stimulate the development of both improved imaging methods and software tools. Toward this end, the RIDER project will evaluate change-analysis software tools by testing their relative performance against a validated and standardized reference database.
C. Data collection process
Numerous therapeutic clinical trials are conducted by government and private sponsorship that include imaging at multiple time points before, during, and after cancer therapy to accurately capture changes in tumor size that may provide a useful indication of disease progression or response to therapy. CT, PET/CT, and MR images in DICOM format from such trials currently are being collected from lung cancer patients across multiple centers by use of the RSNA Medical Imaging Resource Center (MIRC) software (an open source software suite for use in clinical trials) (Figure 1), thus ensuring that the collected images meet all de-identification and patient confidentiality requirements. Many trials sponsored by NCI’s Cancer Therapy Evaluation Program (CTEP), for example, use network-connected imaging devices capable of transmitting de-identified images to a central archive in DICOM standard format. These cases are being annotated by multiple observers based on the RECIST guidelines. The images, annotations, and associated metadata are being transferred to a web-accessible, scalable, secure archive (the National Cancer Imaging Archive (NCIA)) (Figure 2) that provides public access to the database and allows interactive searching, display, and downloading of images and metadata (Figure 3). Appropriate patient outcomes data will be provided so that users of the database may correlate change analysis results with outcomes.
Figure 1.

RSNA MIRC infrastructure for clinical trial data collection.
Figure 2.

caBIG and NCIA infrastructure that incorporates RSNA MIRC software for remote data collection that is DICOM compatible.
Figure 3.
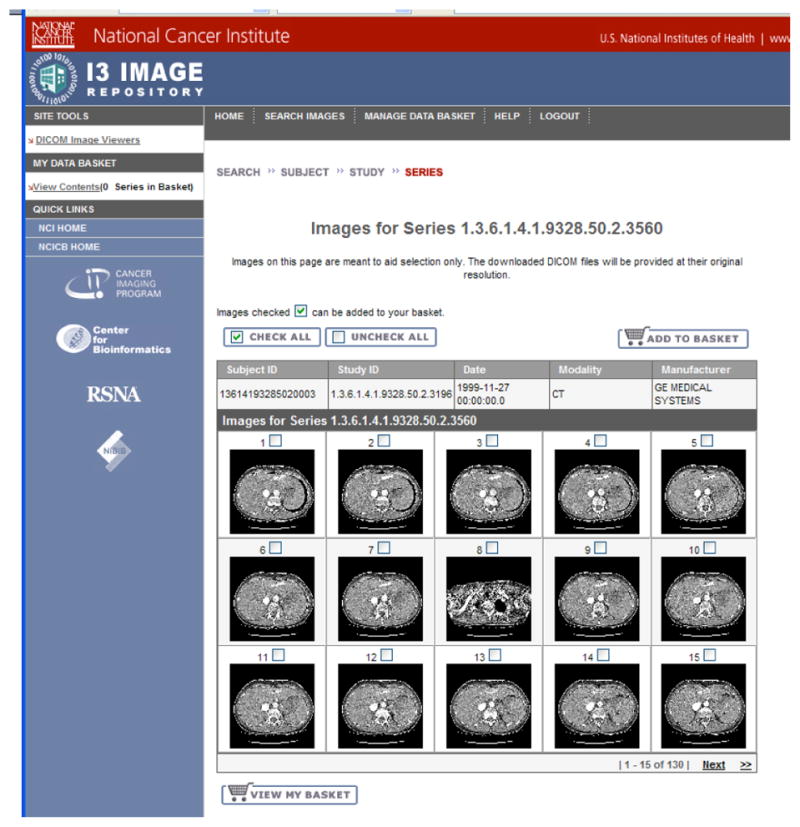
The NCIA website containing the RIDER data.
The RIDER data collection process initially targeted serial MDCT scans from lung cancer patients undergoing systemic chemotherapy treatment for late-stage disease so that few will have undergone the localized anatomy-distorting effects of radiotherapy or surgery. Each patient had a baseline diagnostic CT scan followed by temporally sequential scans throughout the course of therapy. Selected scans excluded hardware or major artifacts such as breathing-motion. Scans may demonstrate more than one tumor, thus allowing end-users to choose the target lesion or lesions most representative of the disease (analogous to the approach adopted by the RECIST method).
The database will include detailed descriptions of modality-specific acquisition parameters that could potentially influence the accurate measurement of change in tumor morphology (e.g., diameter or volume) or functional parameters (e.g., active tumor volume or tumor perfusion). For CT imaging, the values of several key image acquisition parameters are included in the database: (a) CT scanner make, model, and technical capabilities; (b) scanning protocol (a static, single-breath-hold protocol or a dynamic protocol to obtain a series of scans performed before and after contrast agent injection); (c) technical parameters such as the slice thickness, x-ray beam energy, tube current, tube rotation time, pitch, reconstruction filter, and reconstruction interval; and (d) contrast agent information. For PET/CT, the image acquisition parameters of the CT are collected along with relevant technical parameters for the PET scan component: (a) concentration and dose of the radiopharmaceutical; (b) timing of the scan and the extent of anatomy imaged; and (c) parameters such as the reconstructed slice width, attenuation correction methods, and gating methods to reduce motion artifacts. In addition, a description of the PET/CT fusion algorithm will be included, if applicable. MR images require information regarding: (a) imaging protocol (static breath-hold or continuous breathing or dynamic scan); (b) technical parameters such as the imaging sequence used (e.g., T1 weighting or T2 weighting); and (c) information about inhaled (e.g. hyperpolarized Xn gas) or injected contrast agents.
The RIDER database initially focused on CT scans with the following specifications: (a) slice thickness ≤ 7.5 mm (with thickness ≤ 2.5 mm preferred); (b) single breath-hold scans; (c) at least two (and preferably three) scans per patient to assess tumor progression or response to therapy, with the earlier scan preferred at baseline and including measurable disease; (d) patient must be on a chemotherapeutic and/or a radiation therapy treatment protocol for histologically proven primary lung cancer (preferred) or metastatic disease to the lung; (e) with or without contrast agent. The RIDER project is now collecting scans with thin slices (≤ 1.25 mm) to allow more accurate estimates of tumor diameter, volume, and other morphological descriptors. Some example images reconstructed with different slice thicknesses and reconstruction filters are shown in Figures 4 and 5 to illustrate the impact of these parameters on image quality and lesion appearance and to motivate the potential of these parameters to affect reliable measurement of tumor volume. The lesions captured in the database will reflect a representative variety of lesion size, morphology, margin characteristics, internal structure, and anatomic location (including lesions isolated within the lung and lesions adjacent to or invading nearby structures). Collected patient information includes descriptions of standard demographics (gender/age), smoking history, histological tumor type, clinical stage, and current and interval therapy. Clinical outcome data will be added when available.
Figure 4.

Figures illustrating differences in image quality and lesion appearance due to differences in slice thickness. This figure shows axial and coronal images of the same patient (in fact, the same original scan acquisition) with reconstructed slice thickness of (a) 0.6mm, (b) 2 mm and (c) 5 mm.
Figure 5.

Figures illustrating differences in image quality and lesion appearance due to differences in reconstruction algorithm (recon filter). This figure shows axial and coronal images of the same patient (again, the same original scan acquisition) having 2mm thickness and (a) smooth reconstruction algorithm, (b) sharp algorithm.
The collection of data for the RIDER project is modeled after the data collection process of the NCI-sponsored LIDC (15–17), which required the collection of de-identified images, the annotation of those images by expert radiologists, and the addition of other demographic and clinical data from five academic sites, followed by the archiving of the cases in a publicly available, searchable archive. Although the RIDER project has objectives that differ from those of the LIDC, much of the data collection process from LIDC has been adapted to the needs of the RIDER database.
One of the key elements of the LIDC database was to provide detailed information about the location and spatial extent of lung nodules based on radiologists’ interpretation of the images; however, considerable inter-reader variability exists in the detection of lung nodules in CT scans (18, 19). Instead of a forced-consensus-based approach, the LIDC developed a process that would provide the best estimate of the radiologists’ interpretations while capturing variability among the readers. The result was a data collection process that utilized multiple readers independently performing two readings of each case. To support the detailed annotations required through a two-phase, asynchronous process executed across geographically disparate sites, the LIDC developed software tools to mark lesions with manual or semi-automated contouring tools. The LIDC also developed of a common XML-based file format to contain detailed descriptions of nodule attributes such as boundaries and characteristics that was portable across institutions and software tools. This infrastructure provides a mechanism for image collection and for the acquisition of radiologists’ interpretations of the images. The stored representation of a lung nodule or mass for the RIDER project can take the form of a single RECIST-based diameter or detailed outlines in every CT section that contains the lesion, from which volume or longest diameter subsequently may be derived (20). These data will serve as input to computerized systems designed to assess changes indicative of a lesion’s response to therapy.
D. Results from the LIDC
While the LIDC requires accurate segmentation of nodules, the RIDER project requires the accurate measurement of nodule change over time. Both missions require an understanding of variability in defining the spatial extent of lung nodules by radiologists using different software tools. As part of the LIDC effort, a study investigating the variability of boundaries across radiologists and drawing methods was performed (21). In this study, the performance of six radiologists applying three different outlining methods to the task of defining the spatial extent of 23 different lung nodules was evaluated. The drawing methods consisted of one entirely manual method, and two semiautomatic drawing methods with manual editing tools. The variability of radiologists’ spatial definitions for a nodule was measured using both volumes and probability maps (p-map), where the value of a pixel in the p-map represents a spatially smoothed estimate of the fractional number of radiologist-method combinations that included that specific pixel within their boundary definition of the nodule. Differences in volume and p-map model parameters were found to be significant for all methods, all radiologists, and all second-order interactions except one across the 23 nodules. The radiologist and method variables accounted for 15% and 3.5% of the total p-map variance, respectively, and 40.4% and 31.1% of the total volume variance, respectively. In the critical process of segmenting lung nodules, radiologist variance was four times that of the method used, and in the related assessment of nodule volumes, radiologist variance was 1.3 times that of the method.
A subsequent LIDC study went beyond variability in the actual radiologist contours and evaluated the variability that resulted from a reduction of those contours to an estimate of nodule size that might be used clinically (20). With a collection of 518 lung nodules contoured by at least one of the four LIDC radiologists (of which 127 had been contoured by all four radiologists), substantial interobserver variability was observed for a unidimensional, a three-dimensional, and two different bidimensional size metrics. Moreover, large differences were observed among the size metrics.
E. Volume change measurement
The RIDER project has crafted a series of studies that will evaluate change in nodule volume from the perspective of bias and variance. The goal of these studies is to define the parameters by which software tools should be benchmarked, evaluated, and compared so that their eventual inclusion in clinical trials will be accompanied by statistical confidence that real lesion change may be identified at the soonest possible time point. For example, tools with lower variance will enable the reliable detection of smaller changes in nodule volume. These studies will be performed by multiple radiologists using multiple tools, since a single radiologist using a single tool will likely demonstrate less variance than that measured across different tools. Additionally, multiple repetitions of the same radiologist/tool combinations will be performed to estimate intra- and inter-observer effects.
Change detection methods evaluated across serial CT scans will include the current standard of practice (the manual RECIST method), automated/semiautomated tumor segmentation methods, and methods based on supervised automated tumor registration techniques. Registration techniques include local rotate-translate registration followed by grayscale weighted subtraction and high degree-of-freedom warping followed by integration of the Jacobian. Although the initial approach will focus on anatomic imaging and tumor volumetrics, other non-volumetric techniques for evaluating response to therapy will be evaluated, including functional imaging (e.g., perfusion and MR diffusion).
Prior to evaluating volume change analysis software on images acquired from a clinical trial, two fundamental properties of the software, bias and variance, must be understood and quantified. The assessment of bias error (i.e., error in the measurement of average accuracy) will include multiple scans of phantoms containing objects of known volume change and scans modified using known mathematical geometric deformations. The assessment of variance (i.e., measurement noise which results in the reduction of sensitivity in the detection of a small volume change) will include data sets in which, to a reasonable level of certainty, no macroscopic changes in the nodule have occurred. Given that the most immediate goal of RIDER is the early detection of nodule or lung mass volume changes or functional changes that might predict therapeutic outcomes, the highest priority study is the assessment of variance for different change analysis software tools applied to nodules with no observable change. Examples of such “no change” scenarios include multiple short-interval scans (with appropriate IRB approval) of patients with nodules of varying size and complexity. During these so-called “coffee break studies,” the patient is imaged once, gets off and then back on the scanner table, and a second scan is acquired; differences between the first and second set of images would presumably result only from patient positioning differences and noise introduced by the scanner. These coffee break study images, which have already been obtained for a number of patients with CT and with PET, establish the null hypothesis from which the effect size of true change must be distinguished; in other words, knowledge of system variance allows for a determination of whether a measured change likely represents an actual change in tumor volume or instead likely results from noise in the measurement system.
Once the variance has been approximated, the number of observations (i.e., measurements of volume change) that must be obtained to test for the presence of a bias effect at some stated level of significance can be determined. The required number of observations increases as the size of the bias to be measured decreases, as the measured variance increases, and as the power (i.e., the likelihood of detecting the change at the given level of significance) increases. Since variance and bias may have an interaction with nodule size (along with other factors such as nodule shape, nodule type, and image acquisition/reconstruction protocol), variance and bias measurements eventually will be made using nodules demonstrating a spectrum of volumes and characteristics.
The determination of bias in the presence of true volume change is needed to complete the statistical characterization of a measurement method. If bias is estimated only under the “no change” scenario, then only a binary form of accuracy will be evaluable, namely, whether or not change is present. The truth data required to quantify volume change, however, is more difficult to obtain. In fact, estimates of bias in volume change may be dependent on the extent of volume change itself. The only way to obtain images with known size-change “truth” is to scan physical phantoms with known nodule characteristics and different sizes; the concern in this regard, however, is the ability of phantoms to accurately represent real lung nodules and the surrounding anatomic background from the perspective of the imaging modality under investigation. A method for obtaining volume change truth for actual nodules has yet to be defined. The closest approximation to “truth” for actual nodules is image-based measurements made by expert radiologists, but this approach is itself subject to bias and substantial variance (20, 21) and thus is not useful. The RIDER project, through interactions with the FDA, is obtaining both scans of phantom images with a variety of artificial nodules and clinical scans with manual observer measurements of actual lung nodules to investigate these important issues.
F. Standardized methods for software performance evaluation
The RIDER project is designing the approach through which the performance of software tools will be benchmarked and evaluated. Factors being explored include image sequestration, governorship and maintenance of the archive, and training set and evaluation set requirements. Users of software diagnostic tools for lung cancer need confidence in the performance of the algorithms when applied to the broad variety of images that will be encountered in a clinical setting. The application of the tools to images distinct from those on which the tools were developed demonstrates that performance is not the result of tuning to a particular collection of cases. To this end, a set of evaluation cases that is distinct and independent from the training set will be established. Prior to system evaluation, the training set, including all annotations, will be available to the algorithm developers while the evaluation set is sequestered and is available only to an independent evaluation team. The developers of software tools will have access to the sequestered images and associated annotations once an evaluation is complete to better understand performance and to improve the tools; therefore, the sequestered evaluation set will need a continuous influx of new scans as cases migrate into the training (open) portion of the archive.
G. Complementary initiatives
A number of projects that complement the broader goals of RIDER have been initiated. An NCI-sponsored PAR (PAR-07-214, “Academic-Industrial Partnerships for Development and Validation of In Vivo Imaging Systems and Methods for Cancer Investigations”) has been issued as an R01 funding mechanism. The primary focus of this PAR is to enhance translational research for targeted clinical investigations, one goal of which is the development of public resources to accelerate translational research and the creation of standardized methodologies for data acquisition and analysis.
The UPICT (Uniform Protocols for Imaging in Clinical Trials) effort seeks to develop guidelines for uniform image acquisition protocols in clinical trials through a consensus process of diagnostic radiologists, radiation oncologists, medical physicists, clinical trial experts, government agency representatives, and appropriate industry representatives. UPICT was conceptualized by the American College of Radiology (ACR) and the NCI to address the need for consistent imaging protocols used in multi-site clinical trials to improve the reproducibility of quantitative image data obtained from the many sites required for patient accrual.
The Clinical Trials Working Group (CTWG) was established by the NCI director to evaluate how the national clinical trials enterprise should be restructured to realize the promise of molecular medicine for advancing oncologic clinical practice. The CTWG was a broadly constituted panel with experts from academic research institutions, community oncology practices, the pharmaceutical and biotechnology industries, cancer patient advocacy groups, NCI, FDA, and CMS. One of the goals defined by the CTWG was improved standardization of tools and procedures for trial design, data capture, and data sharing to minimize duplication of effort. The CTWG recognized that the evaluation of novel targeted therapies depends on the synergistic integration of treatment protocols with modern molecular diagnostic and imaging techniques.
The NCI Image Response Assessment Team (IRAT) program is designed to advance the role of imaging in the assessment of response to therapy. The long-term objective of this program is to increase clinical collaboration between imaging scientists and oncologic investigators at Cancer Centers. The teams are identifying new oncologic imaging research opportunities in clinical trials that warrant multi-center investigations and plan to integrate imaging data as a potential biomarker or candidate surrogate marker in clinical therapeutic trials.
H. Conclusions
One recurring and very significant issue in the evaluation of new therapies, such as for non-surgically treated lung cancer, is the assessment of response to therapy. Establishing therapy safety and effectiveness is essential for therapy regulatory approval and for third-party payors to approve payments for that therapy. The current approval metric, however, is based on patient survival compared against a “best therapy” standard in a randomized controlled study. Such studies are expensive in terms of both time and money. Moreover, since such studies may require large numbers of subjects, the commencement of one study means that other promising therapeutic agents are never tested. Such an approach therefore denies the general population access to many potentially useful agents.
The RIDER project is an important step in replacing this old paradigm with a consensus-based process of developing well-defined image-based metrics to measure tumor-specific response as the primary outcome. This will allow many more therapeutic agents to be tested more rapidly, either singly or in combination, with large cost savings and without detriment to subject safety. A final randomized controlled study with patient survival as the end point may still be needed for final regulatory approval, but such a study then may be performed with knowledge that the best available therapy has been chosen for evaluation.
The RIDER Research Group
Luc Bidaut, PhD, MD Anderson Cancer Center
Binsheng Zhao, PhD, Memorial Sloan Kettering Cancer Center
Charles Fenimore, PhD, National Institute of Standards and Technology
Paul Kinahan, PhD, University of Washington
Ed Jackson, MD Anderson Cancer Center
Nicholas Petrick, PhD, Food and Drug Administration
Denise R. Aberle, MD, University of California, Los Angeles
Ella A. Kazerooni, MD, University of Michigan
Heber MacMahon, MD, University of Chicago
Edwin J. R. van Beek, MD, PhD, University of Iowa
David Yankelevitz, MD, Cornell University
Reginald Munden, MD, MD Anderson Cancer Center
Lawrence Schwartz, MD, Memorial Sloan Kettering Cancer Center
Marios Gavielides, PhD, Food and Drug Administration
Lisa Kinnard, PhD, Food and Drug Administration
Carl Jaffe, MD, National Cancer Institute
Ronald Gottlieb, MD, Roswell Park Cancer Institute
Matthew S. Brown, PhD, University of California, Los Angeles
Richard C. Pais, BS, University of California, Los Angeles
David P-Y Qing, BS, University of California, Los Angeles
Ali Farooqi, MD, Cornell University
Matthew Cham, MD, Cornell University
Daniel Max, BS, Cornell University
Alberto Biancardi, PhD, Cornell University
Eric Hoffman, PhD, University of Iowa
Kim Sprenger, RN, University of Iowa
Zaid Towfic, BEng, University of Iowa
Lisa Hudson, University of Iowa
Jered Sieren, University of Iowa
Peyton H. Bland, PhD, University of Michigan
Gary Laderach, University of Michigan
Roger Engelmann, MS, University of Chicago
Adam Starkey, University of Chicago
Daniel Barboriak, MD, Duke University
Gary Kelloff, MD, National Cancer Institute
Lori Dodd, PhD, National Cancer Institute
Dan Sullivan, MD, National Cancer Institute
John Freymann, BS, National Cancer Institute
James Lou, PhD, National Cancer Institute
David Kupfersmid, MS, National Cancer Institute
Eliot Siegel, MD, University of Maryland
Belinda Seto, PhD, National Institute of Biomedical Imaging and Bioengineering
Jim Mulshine, MD, Cancer Research and Prevention Foundation
Bo Aldge, Cancer Research and Prevention Foundation
Gary Becker, MD, Radiological Society of North America
John Perry, Radiological Society of North America
Kyle Myers, PhD, Food and Drug Administration
Bob Wagner, PhD, Food and Drug Administration
Martin Herman, PhD, National Institute of Standards and Technology
Lisa Karam, PhD, National Institute of Standards and Technology
Brian Zimmerman, PhD, National Institute of Standards and Technology
Paul Bergstrom, PhD, National Institute of Standards and Technology
Charles Clark, PhD, National Institute of Standards and Technology
Contributor Information
Samuel G. Armato, III, University of Chicago.
Geoffrey McLennan, University of Iowa.
Charles R. Meyer, University of Michigan.
Anthony P. Reeves, Cornell University.
Michael F. McNitt-Gray, University of California, Los Angeles.
Barbara Y. Croft, National Cancer Institute.
Laurence P. Clarke, National Cancer Institute.
References
- 1.Jemal A, Siegel R, Ward E, et al. Cancer statistics, 2008. CA: A Cancer Journal for Clinicians. 2008;58:71–96. doi: 10.3322/CA.2007.0010. [DOI] [PubMed] [Google Scholar]
- 2.Ramalingam S, Belani C. Systemic chemotherapy for advanced non-small cell lung cancer: recent advances and future directions. Oncologist. 2008;13:5–13. doi: 10.1634/theoncologist.13-S1-5. [DOI] [PubMed] [Google Scholar]
- 3.Heelan RT, Flehinger BJ, Melamed MR, et al. Non-small-cell lung cancer: Results of the New York screening program. Radiology. 1984;151:289–293. doi: 10.1148/radiology.151.2.6324279. [DOI] [PubMed] [Google Scholar]
- 4.Melamed MR, Flehinger BJ, Zaman MB, Heelan RT, Perchick WA, Martini N. Screening for early lung cancer: Results of the Memorial Sloan-Kettering study in New York. Chest. 1984;86:44–53. doi: 10.1378/chest.86.1.44. [DOI] [PubMed] [Google Scholar]
- 5.Fontana RS, Sanderson DR, Woolner LB, Taylor WF, Miller WE, Muhm JR. Lung cancer screening: The Mayo program. Journal of Occupational Medicine. 1986;28:746–750. doi: 10.1097/00043764-198608000-00038. [DOI] [PubMed] [Google Scholar]
- 6.Flake GP, Rivera MP, Funkhouser WK, et al. Detection of pre-invasive lung cancer: technical aspects of the LIFE project. Toxicologic Pathology. 2007;35:65–74. doi: 10.1080/01926230601052659. [DOI] [PubMed] [Google Scholar]
- 7.Henschke CI, Naidich DP, Yankelevitz DF, et al. Early Lung Cancer Action Project: Initial findings on repeat screening. Cancer. 2001;92:153–159. doi: 10.1002/1097-0142(20010701)92:1<153::aid-cncr1303>3.0.co;2-s. [DOI] [PubMed] [Google Scholar]
- 8.Swensen SJ, Jett JR, Hartman TE, et al. Lung cancer screening with CT: Mayo Clinic experience. Radiology. 2003;226:756–761. doi: 10.1148/radiol.2263020036. [DOI] [PubMed] [Google Scholar]
- 9.Sone S, Li F, Yang Z-G, et al. Results of three-year mass screening programme for lung cancer using mobile low-dose spiral computed tomography scanner. British Journal of Cancer. 2001;84:25–32. doi: 10.1054/bjoc.2000.1531. [DOI] [PMC free article] [PubMed] [Google Scholar]
- 10.Hillman BJ. Economic, legal, and ethical rationales for the ACRIN national lung screening trial of CT screening for lung cancer. Academic Radiology. 2003;10:349–350. doi: 10.1016/s1076-6332(03)80115-0. [DOI] [PubMed] [Google Scholar]
- 11.Hansra IK, Ernst A. Bronchoscopic-directed diagnosis of peripheral lung lesions suspicious for cancer. Thoracic Surgery Clinics. 2007;17:159–165. doi: 10.1016/j.thorsurg.2007.03.016. [DOI] [PubMed] [Google Scholar]
- 12.James K, Eisenhauer E, Christian M, et al. Measuring response in solid tumors: Unidimensional versus bidimensional measurement. Journal of the National Cancer Institute. 1999;91:523–528. doi: 10.1093/jnci/91.6.523. [DOI] [PubMed] [Google Scholar]
- 13.Therasse P, Arbuck SG, Eisenhauer EA, et al. New guidelines to evaluate the response to treatment in solid tumors. Journal of the National Cancer Institute. 2000;92:205–216. doi: 10.1093/jnci/92.3.205. [DOI] [PubMed] [Google Scholar]
- 14.Schwartz LH, Mazumdar M, Brown W, Smith A, Panicek DM. Variability in response assessment in solid tumors: Effect of number of lesions chosen for measurement. Clinical Cancer Research. 2003;9:4318–4323. [PubMed] [Google Scholar]
- 15.Clarke LP, Croft BY, Staab E, Baker H, Sullivan DC. National Cancer Institute initiative: Lung image database resource for imaging research. Academic Radiology. 2001;8:447–450. doi: 10.1016/S1076-6332(03)80555-X. [DOI] [PubMed] [Google Scholar]
- 16.Armato SG, III, McLennan G, McNitt-Gray MF, et al. Lung Image Database Consortium: Developing a resource for the medical imaging research community. Radiology. 2004;232:739–748. doi: 10.1148/radiol.2323032035. [DOI] [PubMed] [Google Scholar]
- 17.McNitt-Gray MF, Armato SG, III, Meyer CR, et al. The Lung Image Database Consortium (LIDC) data collection process for nodule detection and annotation. Academic Radiology. 2007;14:1464–1474. doi: 10.1016/j.acra.2007.07.021. [DOI] [PMC free article] [PubMed] [Google Scholar]
- 18.Armato SG, III, McNitt-Gray MF, Reeves AP, et al. The Lung Image Database Consortium (LIDC): An evaluation of radiologist variability in the identification of lung nodules on CT scans. Academic Radiology. 2007;14:1409–1421. doi: 10.1016/j.acra.2007.07.008. [DOI] [PMC free article] [PubMed] [Google Scholar]
- 19.Armato SG, III, Roberts RY, Kocherginsky M, et al. Assessment of radiologist performance in the detection of lung nodules: Dependence on the definition of “truth”. Academic Radiology. 2008 doi: 10.1016/j.acra.2008.05.022. (in press) [DOI] [PMC free article] [PubMed] [Google Scholar]
- 20.Reeves AP, Biancardi AM, Apanasovich TV, et al. The Lung Image Database Consortium (LIDC): A comparison of different size metrics for pulmonary nodule measurements. Academic Radiology. 2007;14:1475–1485. doi: 10.1016/j.acra.2007.09.005. [DOI] [PMC free article] [PubMed] [Google Scholar]
- 21.Meyer CR, Johnson TD, McLennan G, et al. Evaluation of lung MDCT nodule annotation across radiologists and methods. Academic Radiology. 2006;13:1254–1265. doi: 10.1016/j.acra.2006.07.012. [DOI] [PMC free article] [PubMed] [Google Scholar]