Abstract
At present, the three-dimensional structure of the multimeric paracellular claudin pore is unknown. Using extant biophysical data concerning the size of the pore and permeation of water and cations through it, two three-dimensional models of the pore are constructed in silico. Molecular Dynamics (MD) calculations are then performed to compute water and sodium ion permeation fluxes under the influence of applied hydrostatic pressure. Comparison to experiment is made, under the assumption that the hydrostatic pressure applied in the simulations is equivalent to osmotic pressure induced in experimental measurements of water/ion permeability. One model, in which pore-lining charged is distributed evenly over a selectivity filter section 10-16 Å in length, is found to be generally consistent with experimental data concerning the dependence of water and ion permeation on channel pore diameter, pore length and the sign and magnitude of pore lining charge. The molecular coupling mechanism between water and ion flow under conditions where hydrostatic pressure is applied is computationally elucidated.
Keywords: ion channels, claudin-2, claudin, water permeation, ion permeation, nanotube, graphene
1. Introduction
Claudins are tight junction membrane proteins that are expressed in epithelia and endothelia and establish the paracellular barrier that limits flux of ions and molecules. Disruption of tight junctions may be responsible for several human diseases including ulcerative colitis, renal disease, and deafness. Despite the recent crystallization of the monomer of mouse claudin protein [1], the three-dimensional structure of the multimeric paracellular claudin pore remains unknown.
The transport properties of claudin-2, which functions as a paracellular pore for Na+ and other small cations [2], and for water [3], have been particularly well-studied. In an initial attempt to understand how claudin pore properties could affect epithelial water permeability, and given the lack of structural detail for claudin pores, we consider two variations of a simple geometric model of the claudin pore. Namely, we modeled the claudin channel as a “double cone” and a “double cone with extended selectivity filter” constructed out of graphene layers. The graphene layers are each one carbon atom thick, packed into a honeycomb lattice. Similar graphene layers have been utilized previously in the design of novel channels with desired functional characteristics [4-9].
Herein, building on previous work using Molecular Dynamics (MD) simulation to study water flow through other protein channels and nanotubes [10-20], we present an MD study of the effect on osmotic water permeability through our claudin channel model of the channel length, channel diameter and the distribution of fixed charge lining the pore. The molecular basis of pore function is thereby elucidated and the mechanisms underlying differences in the properties associated with different pore diameters are studied.
This paper is organized as follows: In Section 2, we present the nanopore model and describe the numerical approach. In Section 3, simulation results for different pore models, pore charges and pore diameters are compared and analyzed in detail. In addition to osmotic water transport, Na+ driven water transport is also studied. In Section 4, we provide concluding remarks.
2 Methods
For our MD simulations, we employed the NAMD2 program [21] with full electrostatics calculated by the particle-mesh-Ewald method. All simulations were performed using the CHARMM27 force field [22] under hexagonal periodic boundary conditions at constant volume. The temperature was kept constant (T =300 K) using a Langevin thermostat with a damping coefficient of 5=ps. The TIP3P model was used for water molecules. Na+ and Cl- were added to the system on both sides of the channel at different concentrations. To make the simulations faster and analysis simpler, all atoms comprising the channel were held fixed and only water molecules and ions allowed to move. The simulation system was composed of seven channels close-packed into a configuration possessing hexagonal symmetry (Fig. 1), thus enabling multiple copies of the single-pore system to be simulated at once.
Fig. 1.
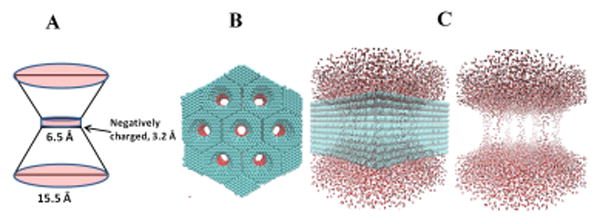
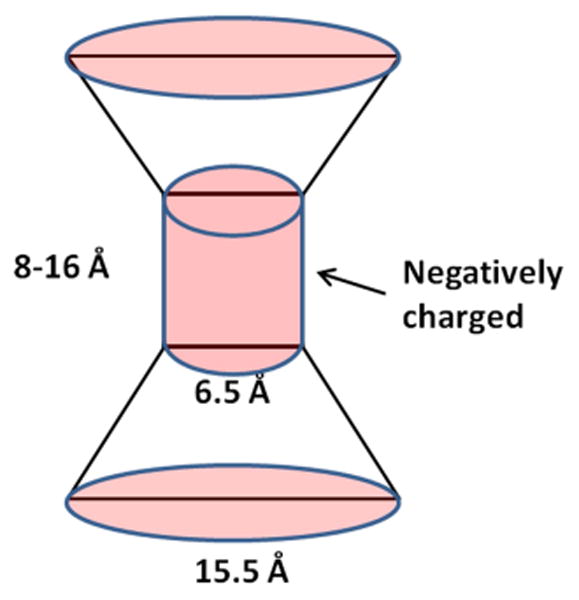
Double cone claudin channel model. A. Diagram of a single channel which was modeled as a double cone with 6.5 Å diameter at the narrowest part of the pore. The outer diameter was 15.5 Å. Six negatively charged spheres were placed at the narrowest position of the channel in a cylindrical band of width 3.2 Å. B. The simulation system was composed of seven channels in parallel to expedite the collection of statistics such as ion/water permeation events. These channels were closely packed into a fixed nanostructure made up of carbon atoms (cyan), and arbitrarily arranged in a hexagonal configuration. Here the entire structure is viewed along the long axis of the channels. Red shading shows location of charged spheres. C. Left: Rotated view of the same structure so that the long axis of the channels runs from top to bottom. Water molecules are shown in red and white. Right: Same view with the carbon nanostructure hidden, exposing the flow of water through the channels.
3 Results and discussion
3.1 A simple, tapered “double-cone” channel model
The claudin-2 paracellular ion channel is known to have an effective diameter of 6.5 Å and to be selectively permeable to Na+ and other small cations, due primarily to the negatively charged side chains of aspartate-65 that are located in the narrowest part of the pore [2]. We therefore initially modeled the cation channel of claudin-2 as a “double cone” tapered cylinder made from graphene layers with a constriction 6.5 Å in effective diameter using the VMD nanotube builder [23]. (This effective internal diameter prescribes the “free volume” in which water and ions can move through the pore. The distance between the centers of the two carbon atoms directly across from each other in the pore is greater than this by 4 Å, which is the Lennard-Jones diameter of a carbon site.) Claudins are multimeric and have previously been proposed to form hexamers [24]. Hence, as an initial computational model, six spheres with partial negative charges representing aspartate residues at position 65 (D65) were inserted in the middle of the channel (Fig. 1). We have previously shown that this simple model predicts quite well the behavior of claudin-2 in terms of ion conductance, charge selectivity and inhibition by polyvalent cations [2, 25, 26]. A recent model which is based on cysteine crosslinking experiments [27] proposes that claudin protomers assemble into antiparallel double rows and form tetramers. (See Fig. 3 of Ref [27] for a putative suggestion as to how hour-glass shaped pores may potentially be created by appropriate geometric arrangement of the protomer unit of the claudin protein.) However, if we distribute the same total charge (either -1.8 e or -1.2 e in the studies presented below) into four partial negative charges at the central ring instead of six partial negative charges, the simulation results will not be significantly affected.
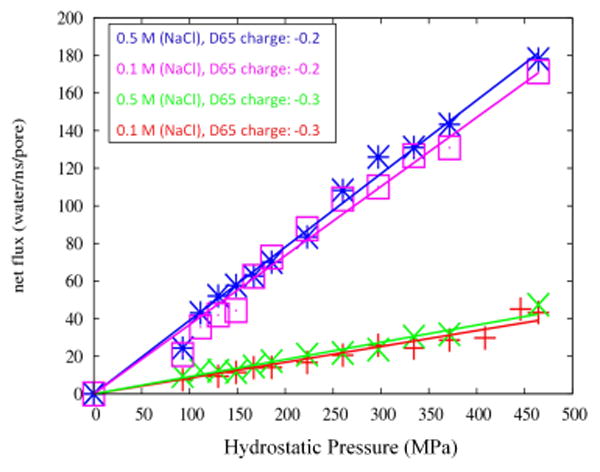
As a first step in studying the flow of water through the claudin-2 pore when NaCl is present on both sides of the pore in the same concentration, we performed molecular dynamics (MD) simulations and estimated the osmotic permeability of H2O through this model using the nonequilibrium MD method described by Zhu et al. [18, 19]. This method assumes that the osmotic and hydrostatic water permeabilities of water channels are equivalent. A hydrostatic pressure gradient was simulated by applying a constant force in the channel axis direction to the oxygen atoms of water molecules within an 8 Å solvent layer (i.e., two 4 Å layers which are connected through the periodic boundary condition) lying in a plane outside the channel and perpendicular to its long axis. A range of forces from 0.01 to 0.25 kcal/mol/Å (corresponding to 37 to 470 MPa pressure) was applied. Under these simulation conditions, we observed a directional water flow through the channel that increased linearly with increasing pressure (Fig. 2).
Fig. 2.
Water permeability in the simple double-cone model (Fig.1) as a function of hydrostatic pressure when the total pore charge is -1.2 e and -1.8 e per pore (six charges of -0.2e or -0.3e, respectively, in a cylindrical ring), and at two NaCl concentrations of 0.1 M and 0.5 M. The narrowest part of the pore (center of the double cone) has diameter 6.5 Å.
The MD simulations were run for 20 nanoseconds. We broke down the total trajectory into smaller time increments and checked that the rate of flow is constant among these increments apart from minor fluctuations. The net water flow through the pore layer over the last 5 ns of the simulations was used to calculate the osmotic permeability using the equation:
where pf (cm3/s/pore) is the desired osmotic permeability coefficient per pore, j (molecules/s) is the net water flux through a single water channel, ΔP is the applied hydrostatic pressure, kB is the Boltzmann constant, and T is the absolute temperature. The results obtained in this fashion are shown in Table I and Fig. 2.
Table I. Water permeability (pf) for four systems with partial charges of (-0.3e, -0.2e) per Asp65 residue and NaCl concentrations of (0.1M, 0.5M).
| Charge/pore | NaCl concentration (M) | pf (cm3/s) |
|---|---|---|
| -0.3 | 0.1 | 3.5 × 10⁻¹³ |
| -0.3 | 0.5 | 3.7 × 10⁻¹³ |
| -0.2 | 0.1 | 16.0 × 10⁻¹³ |
| -0.2 | 0.5 | 15.1 × 10⁻¹³ |
We do not have experimental measurements of single channel water permeability that can be compared to the values obtained in our simulations. To gauge whether the magnitude of water permeability in our model is realistic, we determined the ratio of the total number of water molecules that passed through the channel to the total number of sodium ions passing during the simulation time (water/Na+ permeability ratio), which yielded a value of ∼220. This compares favorably to a macroscopic ratio of ∼100 estimated from our experimental observations. In these experiments, osmotic pressure was induced by introducing Mannitol into the system, specifically ∼100 mM = 100 mOsm/kg on the apical side, 0 mM on the basolateral side (manuscript submitted).
The water/Na+ permeability ratio was nearly constant in simulations with different pore charges and different salt concentrations (as delineated in Table I). Thus, the number of sodium ions that pass through the pore is seen to be linearly proportional to the forces applied to the water molecules. This observation leads us to suggest that water molecules draw sodium ions along with them as they pass through the channel (i.e., “solvent drag” [28]).
We previously showed that neutralizing the negative charge at D65 of claudin-2 by mutating to asparagine (D65N) reduced its Na+ permeability [2]. We have recently found that D65N also reduces claudin-2 water permeability (manuscript submitted). We therefore tested the effect of changing the magnitude of the partial negative charges within the pore. Unexpectedly, reducing the magnitude of the charge, for example from -0.3 to -0.2 per residue (i.e., from -1.8 to -1.2 per pore) increased water permeability by about 5-fold (Fig. 2). Although this result is not in agreement with our experimental observations, it is consistent with what has been found in other simulation studies [18, 29].
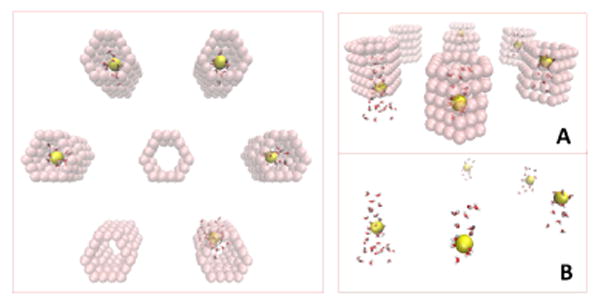
We observed that sodium ions take longer than water molecules to cross the channel once they enter. As they travel across the channel, the Na+ ions appear to block water molecules from flowing (Fig. 3), leading to a smaller number of waters traversing the channel. Consistent with this, we found that the water permeability of the channel was higher in pure water, and lower in NaCl solutions, though there was no difference in water permeability between physiological concentrations of NaCl (0.1M) and higher concentrations (0.5 or 1 M), as shown in Fig. 2. So, our explanation for the paradoxical effect of altering channel charges is that when the D65 charges are smaller (-0.2 compared to -0.3), binding of Na+ to the center of channel is weaker, thus allowing more water molecules to pass through. Conversely, when the magnitude of the charges in the channel is large, Na+ binds tightly and tends to obstruct water flow.
Fig. 3.
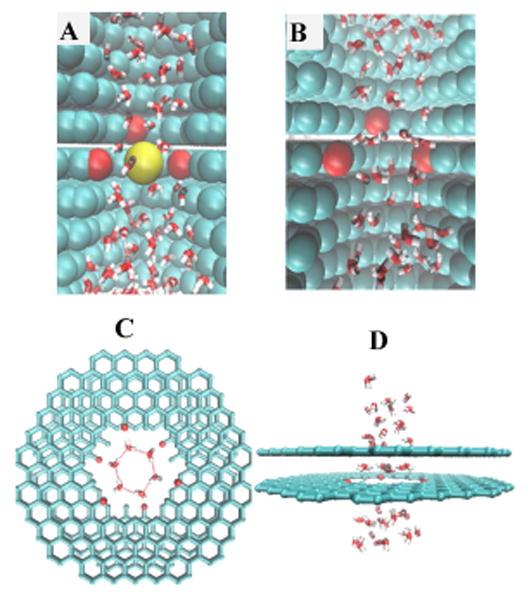
A: View of the inside of one channel cut open to expose the lumen and channel wall. One sodium ion (yellow sphere) is inside and at the center of the channel, where the negative charges are positioned. The large red spheres represent three of the six negatively charged spheres (i.e., those contained in one hemisphere of the channel) which were placed in the narrowest portion of the channel (center of the double cone). B: A closer look into the channel in the absence of a sodium ion. The cyan spheres are carbon atoms, which are fixed in our simulations. C and D show how water molecules link via hydrogen bonding (red dashed lines) into a circle at the center of the pore when a sodium ion is not occupying this site. The charged carbons are shown as small red circles on the edges of graphene sheets (cyan). In these images the water molecules are shown in bond representation and the carbon and sodium atoms as spheres with van der Waals radius for clarity.
In addition, we observed another interesting phenomenon in the double cone model: When there are no ions inside the pore, the water molecules that are at the center of the pore orient in a direction perpendicular to the pore axis with their H atoms pointing toward the negatively-charged atoms of the pore wall and O atoms pointing away from it. These water molecules link into a circle via hydrogen bonding, as illustrated in Fig. 3. This arrangement partially occludes the pore and thereby reduces the mobility of the water molecules inside the channel. These two effects occurring at the narrowest constriction of the pore where the negatively charged pore sites reside, namely, i) blockage of the channel by ions and ii) the circular arrangement of water molecules in the absence of Na+ ions, both contribute to lower water and ion permeability in channels with higher charges.
3.2 Double-cone model with extended selectivity filter
3.2.1 Effect of filter length and magnitude of charge
The “tapered” model did not successfully predict the experimentally observed trend of water permeation increase upon increasing the channel charge. We traced the behavior of this model to the high charge density at the center of the channel. This led us to construct an alternative model in which the same total charge is distributed over a larger pore surface area. Specifically, we modified our model by distributing the negative charge uniformly over a cylindrical region of varying lengths, namely, 8, 10, 13 and 16 Å (cf. Fig. 4).
Fig. 4.
The double-cone with extended selectivity filter model. Here the total pore-lining charge is evenly distributed over a 8-16 Å long cylindrical portion of the pore. The outer diameter of the cone is 15.5 Å.
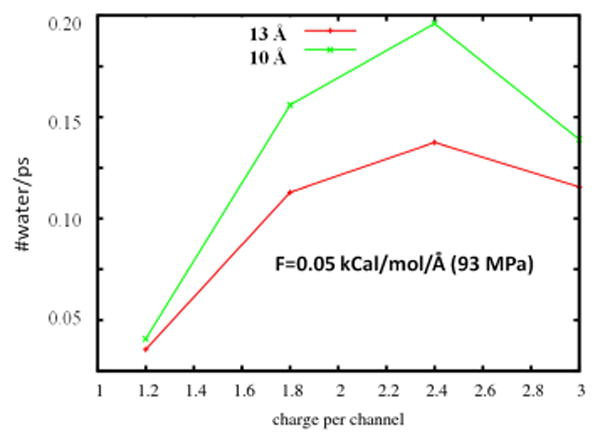
Our expectation was that by smearing the charges over a wider area and decreasing the charge density at the central point of the channel, the ions and water molecules would not get stuck at the magnitude of the center of the channel. When charge is distributed over 10, 13 and 16 Å, then upon increasing the charge from 1.2 e to 2.4 e (per channel) the number of waters (and Na+ ions) which pass through the channel was found to increase. The reason for this is that spreading the charge over a more extended region (longer selectivity filter) helps to create water wires inside the channel in which all the water molecules in the selectivity filter arrange themselves in a single file configuration. This contrasts with the case where the pore charges are localized in a ring of width 3.2 Å in the narrowest part of the channel (Fig. 1). In that case the water molecules inside the narrowest part align in a ring next to the channel walls and can stop the flow of water (see water molecules in the narrowest part of the pore in Fig. 3). The channel with a selectivity filter of 8 Å does not show an increase of water permeation upon increasing the channel charges, for the same reason as in the tapered model. The channel with 16 Å long selectivity filter is longer than the best available estimate of the claudin channel length. In particular, a recent model of the claudin channel [27] predicts that the length of the narrowest part of the claudin channel is close to 13 Å. In Fig. 5, the relation between total pore charge and the number of waters that pass through the pore per picosecond is compared for the two systems with pore lengths 10 and 13 Å. When low pressure is applied (F = 0.05 Kcal/mol/Å), the results are in agreement with computations performed in Ref. [6] and with our experimental results (manuscript submitted). That is, in our MD simulations water permeation increases with increasing channel charge for an effective channel charge < 2.4 e in magnitude. For assumed channel charge greater in magnitude that 2.4 e, the simulations show a turnover regime, i.e., water permeation starts to decrease with increasing channel charge. This effect traces to increased electrostatic interactions between the highly charged pore and the mobile water and ions inside the pore, which eventually leads to disruption of water permeation.
Fig. 5.
Relation between pore charge and the number of waters that pass through the pore per picosecond when the charges are spread over 10 Å (green line) and over 13 Å (red line), both at 93 MPa applied pressure.
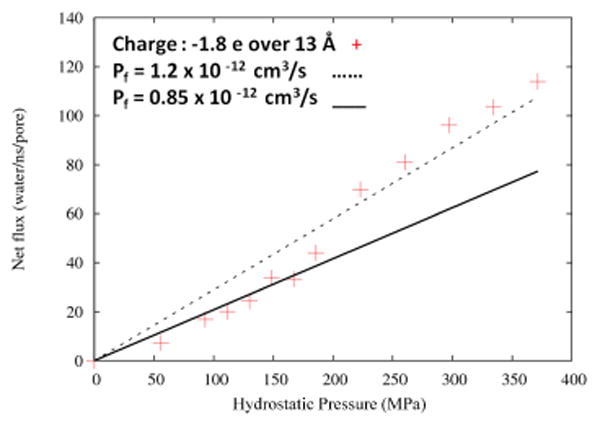
We studied the pressure dependence of water flux for a system where the charge is distributed over 13 Å with -1.8 e charge per channel and 6.5 Å diameter. The computed permeability coefficient for this system is pf = 1.2 × 10⁻¹² cm3/s based on a straight line fit over the entire range of pressure data, or 0.85 × 10⁻¹² cm3/s if we fit only low pressure data (<200 MPa), as our experiments are performed at very low pressures (∼ 250 kPa).The permeability coefficient obtained from fitting the entire data set is quite close to that obtained from the lower pressure regime (Fig. 6).
Fig. 6.
Computed water permeability in the double-cone with extended selectivity filter model as a function of hydrostatic pressure. The selectivity filter region of the pore is 6.5 Å in diameter and 13 Å in length, with total pore lining charge of -1.8 e. The black dotted line is a linear fit to the entire data set from 0 to 400 MPa, yielding a value pf=1.2 × 10⁻¹² cm3/s for the water permeability (slope of the least-squares fit line). The black solid line is the linear fit to the data set restricted to entries with applied pressure of <200 MPa, which corresponds to pf =0.85 × 10⁻¹² cm3/s.
Negative charges of moderate magnitude smeared across a length of the pore wall appear to maximally facilitate water permeation. With charge distributed along the channel as in the double-cone with extended selectivity model, and a channel length of 10-13 A, water permeability increases for systems with higher charge. This is in accord with our experimental results for the D65N mutation and with previous simulation results of Lu [16], who found that when charges are distributed over the length of a carbon nanotube, the water flux increases as the surface charge increases.
For completeness, we present in columns 2 and 3 of Table II the total number of water molecules and the total number of sodium ions passing through the channel during the 10 ns simulation time. Again, this yielded an average water/Na+ permeation ratio of ∼220 for forces > 0.08 Kcal/mol/Å and ∼240 for the entire set of data. In addition, we present in columns 4 and 5 of Table II the average Na+ and Cl- ion occupancy numbers over the course of the MD simulation. The trends followed by these data can be understood as follows: When there is no pressure difference across the channel, then if ions go inside the channel they stay inside for very long time. They do not exit the channel during the simulation time and hence ions accumulate inside the channel leading to a higher occupation number. As the pressure difference across the channel increases, ions can now exit the pore, and thus the ion occupancy decreases. At the highest pressures simulated, the ion occupancy increases again as more ions can accumulate inside the channel. Similar behavior has been observed in MD simulations of other channels [20].
Table II. Details of water and Na+ ion flow per pore as a function of applied force in Kcal/mol/Å.
| Force | #water/10 ns/pore | #Na+/10ns/pore | Na+ occupancy/pore | Cl- occupancy/pore |
|---|---|---|---|---|
| 0.0 | 0.0 | 0.0 | 0.51 | 3.3 e-3 |
| 0.03 | 72 | 0.57 | 0.57 | 0.020 |
| 0.05 | 169 | 0.57 | 0.29 | 1.4e-4 |
| 0.06 | 200 | 1.57 | 0.51 | 5.3e-3 |
| 0.07 | 244 | 1.14 | 0.39 | 8.6 e-4 |
| 0.08 | 337 | 0.57 | 0.42 | 0.052 |
| 0.09 | 333 | 1.43 | 0.32 | 7.4 e-3 |
| 0.10 | 440 | 1.71 | 0.29 | 2.7 e-3 |
| 0.12 | 698 | 3.42 | 0.35 | 2.2 e-3 |
| 0.14 | 810 | 2.57 | 0.23 | 2.1 e-3 |
| 0.16 | 961 | 4.86 | 0.39 | 0.014 |
| 0.18 | 1035 | 5.86 | 0.48 | 0.029 |
| 0.20 | 1140 | 7.71 | 0.39 | 0.040 |
3.2.2 Positive vs. negative charges in the channel
For an effective channel diameter of 8 Å, upon changing the negative pore lining charge to positive charge the water permeability stays the same at the same osmotic pressure. However, as expected, Cl- enters the channel instead of Na+. For all effective channel diameters considered, namely 3.8-8 Å, the rate at which water molecules pass through the channel does not change when the negative pore charge is changed to positive charge (results not shown). For a channel with diameter of ∼4 Å, where a single file water wire is observed, water permeation decreases but is not completely interrupted when the pore charge is positive, just as we find for negatively charged pores (cf. Sect. 3.2.3). These findings bear on the issue of water permeation (or lack thereof) in claudin-17, as discussed in the Conclusions section below.
3.2.3 Pore radius and water permeability
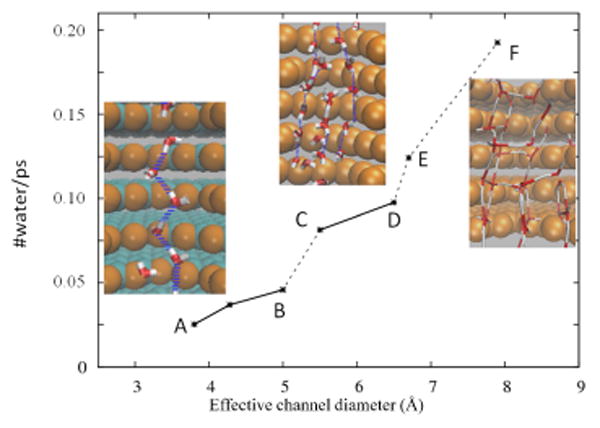
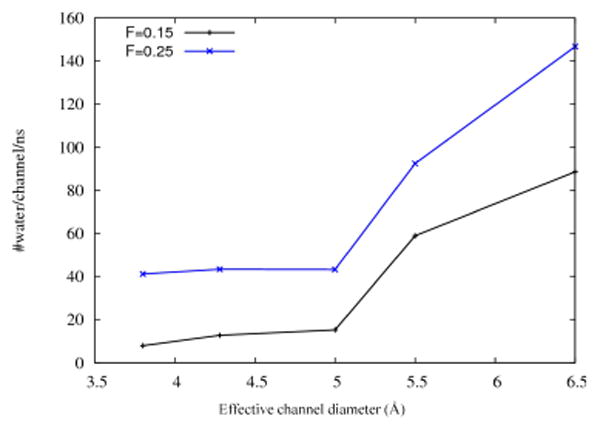
In this section we investigate the relationship between pore radius and water permeability through the double-cone with extended selectivity filter model of the claudin-2 channel. Several channels with diameters from 3.8 to 8 Å, all having -1.8 e total charge per pore, were studied. Simulations were done under applied forces F=0.10, 0.15 and 0.25 Kcal/mol/Å. We observed that the number of water molecules entering and exiting the pores decreases with decreasing pore size. However, this change is not linear with pore size: we observed a sharp drop in water permeability in systems with smaller pore size. This effect is due to the correlation between the number of water wires inside the channel and the channel diameter.
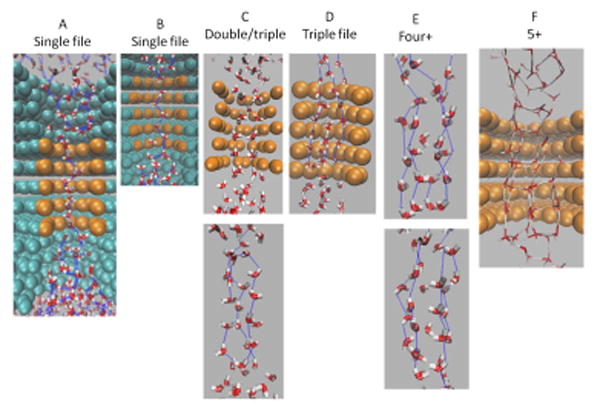
For effective diameters of 3.8-5.0 Å a single file water wire were observed. Double and triple water wires were both seen for a channel with 5.5Å diameter. We observed triple wires for diameters in the range 5.5-6.5 Å, four water wires for diameter 6.7 Å and many waters inside the channel for the effective diameter of 8Å (Figs.7 and 8). In Fig. 8 (A-F), water wire details are presented for all the systems studied. In the simulation snapshots depicted in these figures, forces of 0.10 Kcal/mol/Å were applied within a 20 Å solvent layer (i.e., two 10 Å layers that are connected via periodic boundary conditions).
Fig. 7.
Number of water molecules that pass through pores with different effective diameters and its relation to the number of water wires that form inside the pore. Quantized jumps in the water permeability occur as the channel diameter increases, corresponding to the sequential onset of additional water wires. The applied force is 0.10 kcal/mol/Å on a 20 Å thick water layer.
Fig. 8.
Number of water molecules that pass through pores with different effective diameters and its relation to the number of water wires that form inside the pore. This figure supplements Fig. 7 with additional details for data points A-F.
Upon decreasing the pore size, the number of both water molecules and Na+ ions which pass through the channel decreases. These results are in agreement with previous simulation studies [17].
In Fig. 9 two larger forces, 0.15 and 0.25 Kcal/mol/Å, were applied to confirm that a sudden drop in water permeation onsets when the pore size decreases to a critical diameter (5 Å effective diameter). These forces were applied within an 8 Å solvent layer. A lower pressure of 0.05 Kcal/mol/Å has also been studied for three different diameters (4.5 and 6.5 Å) to confirm that the number of water wires in the pore stays the same at this lower pressure (results not shown here).
Fig. 9.
Number of water molecules passing through one pore per nanosecond as a function of channel diameter. Results are shown for two applied forces, namely, 0.15 and 0.25 kcal/mol/Å, applied to a water layer 8 Å thick. Similar quantized jumps in water permeability were observed at lower osmotic pressures (Fig. 7).
3.2.4 The relation between water and ion transport through the claudin
A. Osmotic water transport
To understand the relationship between water flow and sodium ion flow, simulations under different osmotic pressures were performed and the H2O/Na+ flux ratio was calculated. Ions in electrolyte solution drag along with them a shell of waters. We observed that the H2O/Na+ ratio is nearly constant over a significant range of osmotic pressures when the channel radius is kept fixed: the H2O/Na+ flux ratio in the double cone with extended charge distribution model and charge=-1.8 e per channel is about ∼220. This ratio remains approximately constant, having an average value of ∼200 over the range of channel charges from -1.2 to -2.4 e per channel and channel diameter of 6.5 Å.
Upon reducing the pore diameter, the H2O/Na+flux ratio increases. For a channel with 5.5 Å effective diameter, this ratio is ∼500. The increase in this ratio as the channel diameter decreases can be attributed to a concomitant decrease in Na+ conductivity.
A dehydrated sodium ion has a diameter of ca. 1.9 Å, while the diameter of the hydrated sodium ion is 7.16 Å [30]. In biological channels, when the pore is narrow the ions must be dehydrated in order to pass through the pore. For example, in the KcsA potassium channel the pore contains 16 carbonyl oxygen atoms arranged in a stacked ring configuration which can substitute for the interactions with water shells [31]. Reduction of ion permeation in the narrower channels considered here occurs because ions must be partially dehydrated to enter the channel, and the energy penalty for this can be prohibitively large. This penalty is larger for narrower channels, hence we expect less net penetration of Na+ as the channel pore size decreases. Therefore, the water to ion ratio increases for narrower channels.
B. Na+ driven water transport
Ion hydration during transport through biological nanopores is not fully understood. To shed light on these processes, forces were applied on the sodium ions but not on water molecules. This directly drove sodium ions through the pore. (Such forces could be achieved experimentally by applying an electrostatic potential across the channel pore.) The number of water molecules which, dragged by sodium ions, pass through the pore was also calculated.
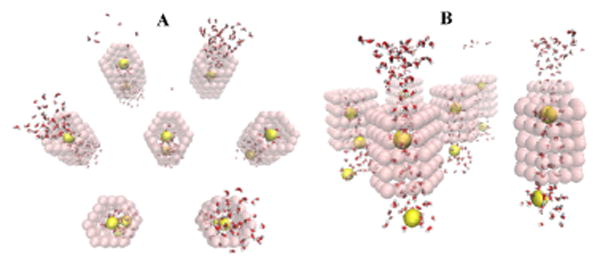
We studied a pore which is not permeable in the absence of applied hydrostatic pressure. This occurs when the channel lining charge is ≤1.2 e in magnitude. When Na+ is present in the system and force is applied only to Na+, sodium ions can pass and carry some water through the channel, as shown in Fig. 10. Water molecules are found in the pore only around the ions and move with them [Fig. 10A,B]. The pore, which is initially filled with water, starts to expel water, since the double cone is hydrophobic and the total charge on the cylindrical selectivity filter is small. As soon as a Na+ ion enters the pore, it brings with it a cloud of water. (Similar behavior has been observed in MD simulation of other protein channels [10, 15].) The ion and water cloud spend a significant amount of time inside the channel (a few nanoseconds) before they exit the pore. When the total pore charge is -1.2 e, the ratio of H2O/Na+ flux for the case where we only apply forces on Na+ is ∼15. Upon increasing the total pore charge to -1.8 e and -2.4 e this number increases to 16 and 20, respectively. Fig. 11 illustrates the increase of water molecules inside the channels when the pore charge is -1.8 e.
Fig. 10.
Left: Na+ (yellow spheres) surrounded by water inside the 7 pores that comprise the simulation system (pink transparent spheres represent the narrowest section of each pore). Force is applied only on Na+ ions. Each pore has a total charge of -1.2 e. Right: Different views of the same MD snapshot as in the Left snapshot. A) Na+ surrounded by water inside the pores. B) The same snapshot as A, except that the pore-lining atoms have been hidden to highlight the water structure inside the pore. There are 12-20 water molecules on average in the water cloud surrounding each ion. Note: In these images the water molecules are shown in bond representation and the carbon and sodium atoms as spheres with van der Waals radius for clarity. (If water molecules are depicted via van der Waals representation here, the figure becomes cluttered, leading to a loss of clarity concerning the essential molecular details of the process under study.)
Fig. 11.
Na+ surrounded by water inside pores charged with -1.8 e, viewed from two different angles (A and B). Increasing the pore charge (cf. Fig. 10) leads to an increase in the number of water molecules inside the pore.
4 Conclusions
The simulations presented in this study show that the length of the channel over which charges are smeared can lead to higher or lower water conductance with increasing total charge. When the charges are spread evenly over a cylindrical pore 10-16 Å, then upon increasing the charge per channel from -1.2 e to -2.4 e, water permeation increases, consistent with our experimental observation.
Our model can be used to predict which other claudin isoforms are water permeable. We tested the effect of decrease and increase in pore diameter on water permeability.
We found that by decreasing the pore diameter to a threshold value, the water permeability decreases significantly. This is consistent with the experimental findings for claudin-2 and claudin 10b (Table III). This effect is due to a transition from triple file to single file water wires when we reduce the pore size from 6.5 to 6.1. Upon increasing the pore diameter to that of the claudin-2 mutant S68C, the water permeation increases, as expected intuitively.
Table III. Experimental results of water permeability for claudin-10, claudin-2 and the mutated claudin-2 systems.
Claudin-17, which has a similar or larger pore diameter than claudin-2, has been found to be impermeable to water [33]. Because claudin-17 is an anion-selective claudin with positively charged sites, we tested whether changing the channel charges from negative to positive charges would affect water permeability. While previous simulation suggests that this can occur with very narrow channels in the absence of applied hydrostatic pressure [16], with a channel diameter of 8 Å we found no effect of the sign of the charge on water permeability as extracted from the slope of the water permeation rate vs. applied hydrostatic pressure curve. This likely indicates that the pore structure of claudin-17 differs from that of claudin-2 in some way, as yet unknown, that prevents water permeation.
We have also examined the relation between water molecule and sodium ion flow. In particular, we showed that water can drive Na+ ions into the pore and that the numbers of ions that pass through the pore is proportional to the number of water molecules that pass through the pore. The ratio of water to Na+ stays almost constant and does not change upon: i) increasing the applied hydrostatic/osmotic pressure ii) varying the pore charge in the studied range of pore charges (-1.2 to -2.4 e) or iii) changing the concentration of NaCl from 0.1 M to 1 M. However, this ratio does change with the pore diameter. The water to ion ratio in a 5.0 Å diameter pore is twice the ratio when the pore diameter is 6.5 Å. Our study has also shown that water molecules can follow ions through a non-permeable but slightly charged pore. Although there are six water molecules in the primary solvation sphere of the sodium ion in bulk solution, ca. 15 water molecules on average follow each Na+ ion for the system set up as described above in section 3.2.4 when the total pore charge is -1.2 e . In future work it would be interesting to study water and ion permeation under the influence of an applied electrostatic potential. By measuring the induced conductance of channels with different diameters and pore charges one can study the rate of ion flow through the pore and the number of water molecules dragged along with the ions as they pass through the channel.
Acknowledgments
This work was supported by NIH grant U01GM094627-04. Computations presented here were carried out at the University of Pittsburgh's Center for Molecular and Materials Science.
Contributor Information
Rozita Laghaei, Email: rlagha@gmail.com.
Alan S.L. Yu, Email: ayu@kumc.edu.
References
- 1.Suzuki H, Nishizawa T, Tani K, Yamazaki Y, Tamura A, Ishitani R, Dohmae N, Tsukita S, Nureki O, Fujiyoshi Y. Crystal Structure of a Claudin Provides Insight Into the Architecture of Tight Junctions. Science. 2014;344:304–307. doi: 10.1126/science.1248571. [DOI] [PubMed] [Google Scholar]
- 2.Yu AS, Cheng MH, Angelow S, Gunzel D, Kanzawa SA, Schneeberger EE, Fromm M, Coalson RD. Molecular Basis for Cation Selectivity in Claudin-2-Based Paracellular Pores: Identification of an Electrostatic Interaction Site. J Gen Phys. 2009;133:111–127. doi: 10.1085/jgp.200810154. [DOI] [PMC free article] [PubMed] [Google Scholar]
- 3.Rosenthal R, Milatz S, Krug SM, Oelrich B, Schulzke JD, Amasheh S, Gunzel D, Fromm M. Claudin-2, a component of the tight junction, forms a paracellular water channel. J Cell Sci. 2010;123(Pt 11):1913–21. doi: 10.1242/jcs.060665. [DOI] [PubMed] [Google Scholar]
- 4.Coasne B, J S-B, Czwartos M, Gubbins KE. Effect of Pressure on Freezing of Pure Fluids and Mixtures Confined in Nanopores. J Chem Phys B. 2011;113:13874–13881. doi: 10.1021/jp9031699. [DOI] [PubMed] [Google Scholar]
- 5.Cohen-Tanugi D, Grossman JC. Water Desalination Across Nanopours Graphene. Nano Lett. 2012;12:3602–3608. doi: 10.1021/nl3012853. [DOI] [PubMed] [Google Scholar]
- 6.Sathe C, Zou X, Leburton JP, Schulten K. Computational Investigation of DNA Detection Using Graphene Nanopores. ACS Nano. 2011;5:8842–8851. doi: 10.1021/nn202989w. [DOI] [PMC free article] [PubMed] [Google Scholar]
- 7.Hu GI, Mao M, Ghosal S. Ion Transport Through a Graphene Nanopore. Nanotech. 2012;23:395501. doi: 10.1088/0957-4484/23/39/395501. [DOI] [PMC free article] [PubMed] [Google Scholar]
- 8.Mao M, Ghosal S, Hu G. Hydrodynamic Flow in the Vicinity of a Nanopore Induced by an Applied Voltage. Nanotech. 2013;24:245202. doi: 10.1088/0957-4484/24/24/245202. [DOI] [PMC free article] [PubMed] [Google Scholar]
- 9.Suk ME, Aluru NR. Water Trasnport Through Ultrathin Graphene. J Phys Chem Lett. 2010;1:1590–1594. [Google Scholar]
- 10.Beckstein O, Sansom MSP. Liquid-Vapor Oscillations of Water in Hydrophobic Nanopores. Proc Natl Acad Sci. 2003;100:7063–7068. doi: 10.1073/pnas.1136844100. [DOI] [PMC free article] [PubMed] [Google Scholar]
- 11.Beckstein O, Sansom MSP. The Influence of Geometry, Surface Character, and Flexibility on the Permeation of Ions and Water Through Biological Pores. Phys Biol. 2004;1:42–52. doi: 10.1088/1478-3967/1/1/005. [DOI] [PubMed] [Google Scholar]
- 12.Köfinger J, Hummer G, Dellago C. A One-DImensional Dipole Lattice Model for Water in Narrow Nanopores. J Chem Phys. 2009;130:154110:1–16. doi: 10.1063/1.3106223. [DOI] [PMC free article] [PubMed] [Google Scholar]
- 13.Köfinger J, Hummer G, Dellago C. Single-File Water in Nanopores. Phys Chem Chem Phys. 2011;13:15403–15417. doi: 10.1039/c1cp21086f. [DOI] [PMC free article] [PubMed] [Google Scholar]
- 14.Yi Z, Shunle D. Molecular Dynamics Simulation of Water Conduction within Carbon Nanotube. Chin Sci Bull. 2013;58:59–62. [Google Scholar]
- 15.Zhu F, Hummer G. Drying Transition in the Hydrophobic Gate of the GLIC Channel Blocks Ion Conduction”. Biophys J. 2012;103:219–227. doi: 10.1016/j.bpj.2012.06.003. [DOI] [PMC free article] [PubMed] [Google Scholar]
- 16.Lu D. Accelerating Water Transport Through a Charged SWCNT: A Molecular Dynamics Simulation. Phys Chem Chem Phys. 2013;15:14447–14457. doi: 10.1039/c3cp51855h. [DOI] [PubMed] [Google Scholar]
- 17.Portella G, de Groot BL. Determinants of Water Permeability Through Nanoscopic Hydrophilic Channels. Biophys J. 2009;96:925–938. doi: 10.1016/j.bpj.2008.09.059. [DOI] [PMC free article] [PubMed] [Google Scholar]
- 18.Zhu F, Schulten K. Water and Proton Conduction Through Carbon Nanotubes as Models for Biological Channels. Biophys J. 2003;85:236–244. doi: 10.1016/S0006-3495(03)74469-5. [DOI] [PMC free article] [PubMed] [Google Scholar]
- 19.Zhu F, Tajkhorshid E, Schulten K. Theory and Simulation of Water Permeation in Aquaporin-1. Biophys J. 2004;86:50–57. doi: 10.1016/S0006-3495(04)74082-5. [DOI] [PMC free article] [PubMed] [Google Scholar]
- 20.Su J, Yang K, Guo H. Asymmetric transport of water molecules through a hydrophobic conical channel. RSC Adv. 2014;4:40193–40198. [Google Scholar]
- 21.Phillips JC, Braun R, Wang W, Gumbart J, Tajkhorshid E, Villa E, C C, Skeel RD, Kale L, K S. Scalable Molecular Dynamis with NAMD. J Comput Chem. 2005;26:1781–1802. doi: 10.1002/jcc.20289. [DOI] [PMC free article] [PubMed] [Google Scholar]
- 22.MacKerell AD, Brooks CL, Nilsson L, Roux B, Won Y, Karplus M. Charmm: The Energy Functionand Its Parameterization with an Overview of the Program. Vol. 1. Chichester, U. K.: John Wiley & Sons; 1998. [Google Scholar]
- 23.Humphrey W, Dalke A, Schulten K. VMD - Visual Molecular Dynamics. J Molec Graphics. 1996;14:33–38. doi: 10.1016/0263-7855(96)00018-5. [DOI] [PubMed] [Google Scholar]
- 24.Mitic LL, Unger VM, Anderson JM. Expression, Solubilization, and Biochemical Characterization of the Tight Junction Transmembrane Protein Caludin-4. Protein Sci. 2003;12:218–227. doi: 10.1110/ps.0233903. [DOI] [PMC free article] [PubMed] [Google Scholar]
- 25.Gunzel D, Yu ASL. Claudins and the Modulation of Tight Junction Permeability. Physiol Rev. 2013;93:525–569. doi: 10.1152/physrev.00019.2012. [DOI] [PMC free article] [PubMed] [Google Scholar]
- 26.Yu ASL, Cheng MH, Coalson RD. Calcium Inhibits Paracellurlar Sodium Conductance Through Claudin-2 by Competitive Binding. J Biol Chem. 2010;285:37060–37069. doi: 10.1074/jbc.M110.146621. [DOI] [PMC free article] [PubMed] [Google Scholar]
- 27.Suzuki H, Tani K, Tamura A, Tsukita S, Fujiyoshi Y. Model for the Architecture of Claudin-Based Paracellular Ion Channels Through Tight Junctions. J Mol Biol. 2015;427:291–297. doi: 10.1016/j.jmb.2014.10.020. [DOI] [PubMed] [Google Scholar]
- 28.Hammel HT, Schlegel WM. Osmosis and Solute-Solvent Drag: Fluid Transport and Fluid Exchange in Animals and Plants. Cell Biochem Biophys. 2005;42:277–345. doi: 10.1385/CBB:42:3:277. [DOI] [PubMed] [Google Scholar]
- 29.Zhou Y, Dong SL. Molecular Dynamics Simulation of Water Conduction Within Carbon Nanotube. Chin Sci Bull. 2013;58:59–62. [Google Scholar]
- 30.Nightingale ER. Phenomenological Theory of Ion Solvation. Effective Radii of Hydrated Ions. J Phys Chem. 1959;63:1381–1387. [Google Scholar]
- 31.Doyle DA, Morais Cabral J, Pfuetzner RA, Kuo A, Gulbis JM, Cohen SL, Chait BT, MacKinnon R. The Structure of the Potassium Channel: Molecular Basis of K+ Conduction and Selectivity. Science. 1998;280:69–77. doi: 10.1126/science.280.5360.69. [DOI] [PubMed] [Google Scholar]
- 32.Li J, Zhuo M, Pei L, Rajagopal M, Yu AS. Comprehensive cysteine-scanning mutagenesis reveals Claudin-2 pore-lining residues with different intrapore locations. The Journal of biological chemistry. 2014;289(10):6475–84. doi: 10.1074/jbc.M113.536888. [DOI] [PMC free article] [PubMed] [Google Scholar]
- 33.Krug SM, Gunzel D, Conrad MP, Rosenthal R, Fromm A, Amasheh S, Schulzke JD, Fromm M. Claudin-17 forms tight junction channels with distinct anion selectivity. Cellular and molecular life sciences : CMLS. 2012 doi: 10.1007/s00018-012-0949-x. [DOI] [PMC free article] [PubMed] [Google Scholar]


