Abstract
The mitochondrial matrix is unique in that it must integrate folding and assembly of proteins derived from nuclear and mitochondrial genomes. In C. elegans, the mitochondrial unfolded protein response (UPRmt) senses matrix protein misfolding and induces a program of nuclear gene expression, including mitochondrial chaperonins, to promote mitochondrial proteostasis1–3. While misfolded mitochondrial matrix-localized ornithine trans-carbamylase (OTC) induces chaperonin expression4–6, our understanding of mammalian UPRmt is rudimentary7, reflecting a lack of acute triggers for UPRmt activation. This limitation has prevented analysis of the cellular responses to matrix protein misfolding and the effects of UPRmt on mitochondrial translation to control protein folding loads. Here, we combine pharmacological inhibitors of matrix-localized HSP90/TRAP18 or LON protease9, which promote chaperonin expression, with global transcriptional and proteomic analysis to reveal an extensive and acute response of human cells to UPRmt. This response involved widespread induction of nuclear genes, including matrix-localized proteins involved in folding, pre-RNA processing and translation. Functional studies revealed rapid but reversible translation inhibition in mitochondria occurring concurrently with defects in pre-RNA processing due to transcriptional repression and LON-dependent turnover of the mitochondrial pre-RNA processing nuclease MRPP310. This study reveals that acute mitochondrial protein folding stress activates both increased chaperone availability within the matrix and reduced matrix-localized protein synthesis through translational inhibition, and provides a framework for further dissection of mammalian UPRmt.
Protein folding homeostasis is central to cell fitness. Protein unfolding in the endoplasmic reticulum (ER) promotes transcriptional induction of ER-associated chaperones to facilitate folding and inhibits translation to further reduce the folding load11. In contrast, mechanisms underlying the response to protein misfolding in other organelles, including mitochondria, are poorly understood. The mitochondrial matrix folding machinery consists of chaperonins HSPD1/HSP60 and HSPE1/HSP10 and chaperones including the HSP90 paralog TRAP1 and mtHSP70. This machinery assists in the folding of matrix-localized nuclearly encoded proteins, and their assembly with 13 respiratory chain proteins encoded by the mitochondrial genome (mtDNA)12. The balance between folding load and chaperone abundance is controlled, in part, by the mitochondrial unfolded protein response (UPRmt). In C. elegans, genetic UPRmt activation promotes nuclear localization of the ATFS-1 transcription factor to induce expression of mitochondrial chaperonins, thereby enhancing matrix folding capacity1–3. While earlier work revealed that enforced expression of misfolded OTC in HeLa cells induced HSPD1 and HSPE1 expression4–6, our understanding of UPRmt in human cells is limited.
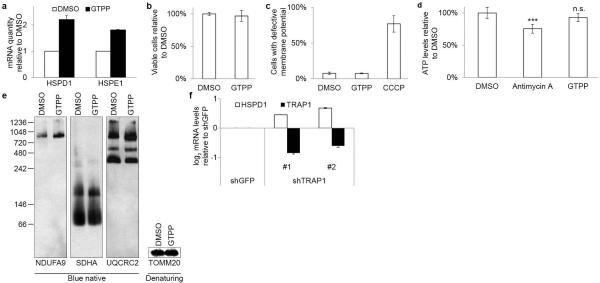
Cellular stress responses such as UPRer are typically fast acting as a result of rapid sensing of protein folding stress, but prolonged activation can produce confounding effects such as cell death13. We therefore examined whether gamitrinib-triphenylphosphonium (GTPP) – a specific inhibitor of the matrix HSP90 chaperone TRAP1 known to cause protein misfolding in this compartment8,14 – would promote acute transcription of HSPD1 and HSPE1 as readout of UPRmt induction in HeLa cells. Acute GTPP treatment (6h) induced UPRmt as assessed by qPCR for HSPD1 and HSPE1 (Extended Data Fig. 1a) with a dynamic range (~2-fold) similar to that seen with genetic UPRmt induction in C. elegans1. HSPD1 and HSPE1 are among the most abundant mRNAs in untreated cells (top 2 percentile), explaining their limited dynamic range upon UPRmt (Supplementary Table 1). GTPP treatment did not affect cell viability, mitochondrial membrane potential, ATP levels, or respiratory chain architecture (Extended Data Fig. 1be). Longer (24 h) incubations with GTPP result in cell death8. Consistent with TRAP1 being the causal target for GTPP-dependent chaperonin induction, TRAP1 RNAi also induced HSPD1 by qPCR (Extended Data Fig. 1f).
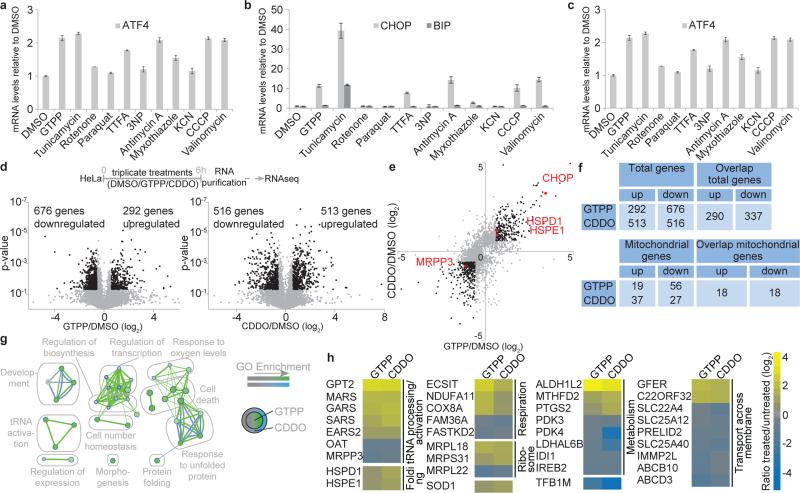
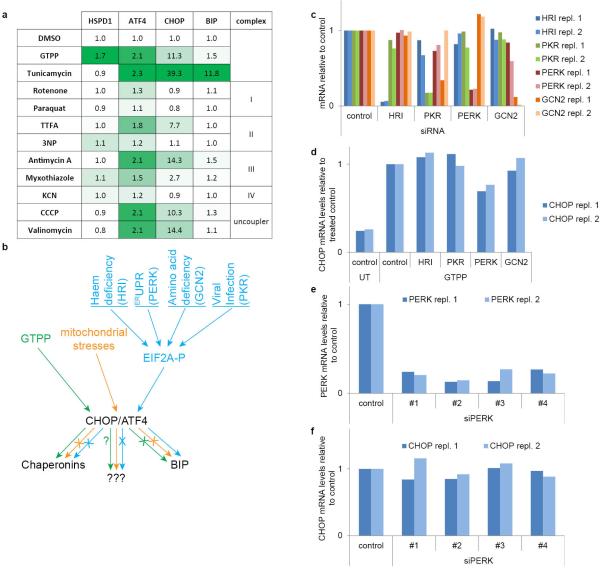
C/EBP homologous protein (CHOP), a broadly acting transcription factor, is induced via UPRer and the integrated stress response (ISR) via the ATF4 transcription factor11. CHOP is also induced during UPRmt 4,5 and oxidative stress15, but the mechanisms underlying CHOP activation in UPRmt and its relationship between UPRer and ISR upstream signaling remained unclear. Strikingly, we found that GTPP, but not the UPRer activator tunicamycin, respiratory chain inhibitors, or mitochondrial membrane decouplers, activated HSPD1 expression (Fig. 1a; Extended Data Fig. 2a). GTPP also activated ATF4 and CHOP, but unlike tunicamycin, did not induce BIP, indicating that GTPP does not activate canonical UPRer (Fig. 1b, c and Extended Data Fig. 2a, b). We also found that individual depletion of the four known EIF2A kinases involved in ISR signaling (GCN2, HRI, PERK, and PKR)11 had no effect on CHOP induction by GTPP (Extended Data Fig. 2c-f), suggesting that induction of ATF4 and CHOP by UPRmt occurs through a pathway independent of individual ISR kinases5 (Extended Data Fig. 2b). Taken together, these data indicate that GTPP induces UPRmt through a pathway distinct from known ER and mitochondrial stress pathways (Extended Data Fig. 2b).
Fig. 1. Global analysis of transcriptional responses to UPRmt induction.
a-c, qPCR of HSPD1 (a), CHOP and BIP (b) or ATF4 (c) mRNA in HeLa cells with or without the indicated treatments (mean of levels relative to untreated ±s.d.; n=3 biological replicates). d, Experimental design (top). Volcano plot showing fold changes versus p-values for the analyzed transcriptome of cells treated with GTPP (bottom left) or CDDO (bottom right). Proteins significantly changing upon MTUPR induction (p≤0.05, changes ≥ log2 ±0.6) are represented by black dots. e, Correlation of ratios of transcripts changing upon GTPP or CDDO treatment. Black dots, p≤0.05, changes ≥ log2 ±0.6; Red dots, genes of interest. f, Summary of altered transcripts. g,h, GO enrichment map (d) and heat map (e) of overlapping mitochondrial transcripts altered by both GTPP and/or CDDO.
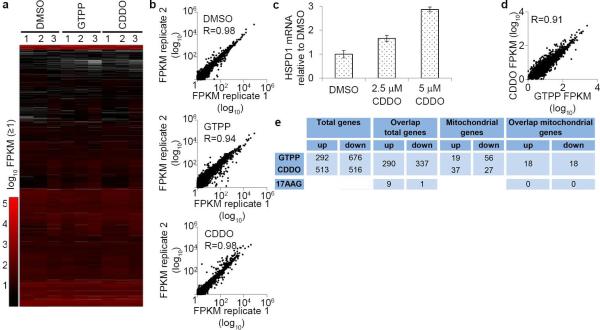
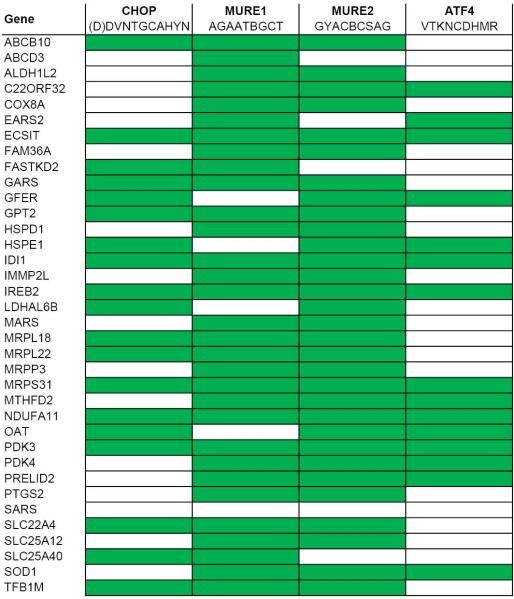
To globally examine the mammalian UPRmt transcriptional response, we treated HeLa cells with GTPP for 6 h and performed RNA-seq (Fig. 1d, e, Extended Data Fig. 3a-b and Supplementary Table 1). In a parallel, we determined RNA-seq profiles upon treatment of cells with CDDO, an inhibitor of matrix protease LON (Fig. 1d). CDDO rapidly induces mitochondrial protein misfolding9 and also induced HSPD1 expression, consistent with UPRmt induction (Extended Data Fig. 3c). From 968 (GTPP) and 1029 (CDDO) transcripts whose abundance changed significantly (p-value ≤ 0.05, log2 ≥ ±0.6), 627 were shared between the two different treatments with 337 and 290 down-regulated and up-regulated transcripts, respectively, including HSPD1 and HSPE1, and CHOP (Fig. 1d-f and Extended Data Fig. 3d, e). Importantly, changes in transcription with GTPP treatment were distinct from changes previously reported with 17-AAG16, a derivative of GTPP that inhibits cytoplasmic and nuclear HSP90 (Extended Data Fig. 3e), indicating that inhibition of non-mitochondrial HSP90 is unlikely to account for the transcriptional response with GTPP. Gene ontology (GO) enrichment analysis confirmed extensive overlap in the transcriptional responses, with all GO clusters representing transcripts altered with both treatments (Fig. 1g, Supplementary Table 2). As expected, GO terms showed enrichment for protein folding genes, consistent with UPRmt induction, but also included tRNA processing and activation. Among the nuclear genes with correlated changes in transcription, 36 encode proteins known to localize in mitochondria (Fig. 1h, Supplementary Table 1). Promoter analysis of genes regulated by UPRmt induction showed enrichment of CHOP and ATF4 promoter recognition sequences, as well as two “mitochondrial UPR Response Element” (MURE1 and MURE2) promoter elements6 (p<0.0001; Extended Data Fig. 4, Supplementary Table 3). This analysis therefore revealed a specific nuclear response to UPRmt that is anticipated to promote homeostasis of protein folding within mitochondria.
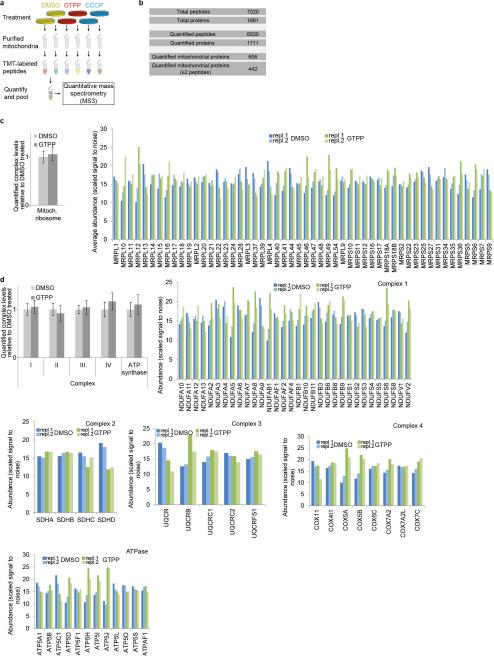
We then applied MultiNotch proteomics17 (Extended Data Fig. 5a) to purified mitochondria in order to quantify acute changes in the mitochondrial proteome upon GTPP treatment using untreated cells or cells treated with the mitochondrial uncoupler CCCP (carbonyl cyanide-m-chlorophenyl hydrazone) as controls (Fig. 2a and Supplementary Table 4)17. From 606 mitochondrial proteins quantified (442 with 2 or more peptides), 61 proteins displayed significant changes in abundance 6 h after GTPP treatment when compared with control or CCCP treated cells, including HSPD1 and HSPE1, which increased as expected (Fig. 2a, b and Extended Data Fig. 5b). Furthermore, proteins involved in respiration, transcription, tRNA processing, and protein quality control, among others, were found to be regulated (Fig. 2c). In contrast, levels of the mitochondrial ribosome and respiratory chain complexes were not significantly altered (Extended Data Fig. 5c,d), consistent with their long half-lives18. Strikingly, the abundance of the mitochondrial matrix protein MRPP3 was reduced at both the transcriptional and protein level (Fig. 1e, h and Fig. 2b-d). MRPP3 is the catalytic subunit of the RNA-free mitochondrial RNase P complex, which also includes MRPP1 and MRPP210. MRPP1 and MRPP2 mRNA and protein levels were unchanged or increased in response to GTPP or CDDO (Fig. 2d), suggesting a rather specific down-regulation of MRPP3 in the context of RNase P.
Fig. 2. Changes in the mitochondrial proteome upon UPRmt induction.
a, Volcano plot showing fold changes versus p-values for total quantified and quantified mitochondrial proteins. b, Volcano plot showing fold changes versus p-values for quantified mitochondrial proteins. Proteins significantly changing are indicated by green dots, c, Heatmap organized by GO groups of mitochondrial protein level changes. Proteins which didn't change significantly, grey. d, Histogram of protein (panel b) and/or mRNA (Fig. 1) abundance for chaperonin and mitochondrial RNase P subunits. Two-tailed p-values *p≤0.05, **p≤0.01, ***p≤0.001, mean of n=3 (RNA) or n=2 (protein) biological replicates. n.s. not significant. # p-value of 0.06.
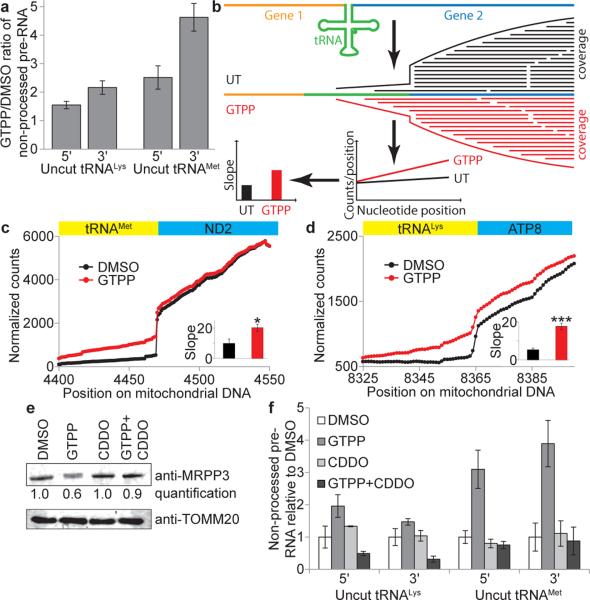
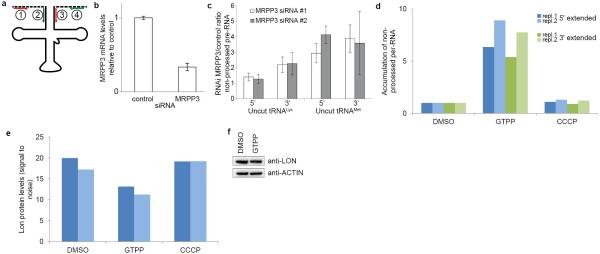
mtDNA-derived polycistronic pre-RNA contains protein coding and ribosomal RNA elements flanked by tRNA genes. RNase P and RNase Z cleave pre-RNA 5’ and 3’ of tRNAs, respectively, with 5’ cleavage preceding 3’ cleavage10. Consistent with reduced MRRP3 upon UPRmt, we observed a 1.5-4.5-fold increase in non-processed mitochondrial tRNALys and tRNAMet 6h after GTPP treatment (Fig. 3a and Extended Data Fig. 6a), comparable to effects seen upon depletion of MRPP3 by siRNA (Extended Data Fig. 6b,c). To independently examine pre-RNA processing, we analyzed coverage of pre-RNA cleavage sites in tRNAMet and tRNALys by RNA-seq. When pre-RNA processing is defective, sequence reads from the adjacent mRNA can extend into the tRNA, indicative of reduced processing as quantified via slopes of coverage (Fig. 3b). Indeed, upon UPRmt, we observed increased slopes for sequence reads crossing ATP8-tRNALys and ND2-tRNAMet junctions (Fig. 3c, d). pre-RNA processing defects were absent with CCCP-dependent damage, suggesting a specific protein folding response (Extended Data Fig. 6d). While MRPP3 mRNA and protein levels are reduced upon treatment with GTPP, CDDO resulted in reduced MRPP3 mRNA levels without reduced MRPP3 protein levels (Fig. 2c and Fig. 3e), suggesting LON-dependent MRPP3 degradation. Indeed, co-treatment with GTPP and CDDO resulted in no reduction in MRPP3 abundance (Fig. 3e) and moreover, CDDO co-treatment rescued pre-RNA processing defects seen with GTPP alone (Fig. 3f). It is currently unclear how MRPP3 is made more susceptible to degradation in response to GTPP, but we conclude that this does not occur at the level of LON abundance, as LON is not increased upon GTPP treatment (Extended Data Fig. 6e, f).
Fig. 3. Mitochondrial pre-RNA processing defects upon UPRmt.
a, qPCR of mitochondrial pre-RNA at tRNAMet and tRNALys RNAseP processing sites upon induction of UPRmt with GTPP (6h). Error bars, averages ±s.d. (n=3 biological replicates). b, RNA-seq for analysis of mitochondrial pre-RNA processing defects based on number of reads crossing the tRNA/mRNA gene junction. Slope of coverage in the tRNA gene adjacent to the cut site is used as a measure of processing. c-d, Normalized RNA-seq coverage across tRNA/mRNA gene borders for tRNAMet (c) and tRNALys (d) with average of slopes (±s.d.) from b indicated in the inset (n=3 biological replicates, two-tailed p-values *p≤0.05, ***p≤0.001).e, Quantitative western blot analysis of MRPP3 levels upon treatment of cells with DMSO, GTPP, CDDO, or GTPP + CDDO co-treatment for 6 hours. f, Mitochondrial pre-RNA accumulation upon co-treatment with GTPP and CDDO (as in a). Data are average values ±s.d. (n=3 biological replicates). For gel source data, see Supplementary Figure 1.
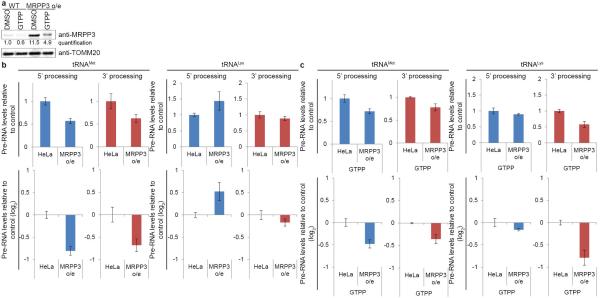
We next examined whether loss of MRPP3 and defects in pre-RNA processing during UPRmt could be overcome by its stable expression. Previous studies have shown that alterations in the abundance of mitochondrial RNase P components can alter pre-RNA processing in unanticipated ways, making interpretation of effects of MRPP3 overexpression difficult19. Similarly, we found that elevated MRPP3 levels (~11-fold) altered steady-state processing efficiencies, with enhanced tRNAMet processing and tRNALys displaying enhanced 3’ processing and decreased 5’ processing (Extended Data Fig. 7a,b). While MRPP3 levels were still reduced upon GTPP treatment, consistent with LON activity not being limiting, residual MRPP3 remained ~5-fold higher than in untreated cells (Extended Data Fig. 7a)19. Importantly, residual MRPP3 partially rescued tRNAMet and tRNALys processing (Extended Data Fig. 7c), consistent with the notion that loss of MRPP3 during UPRmt contributes to pre-RNA processing defects.
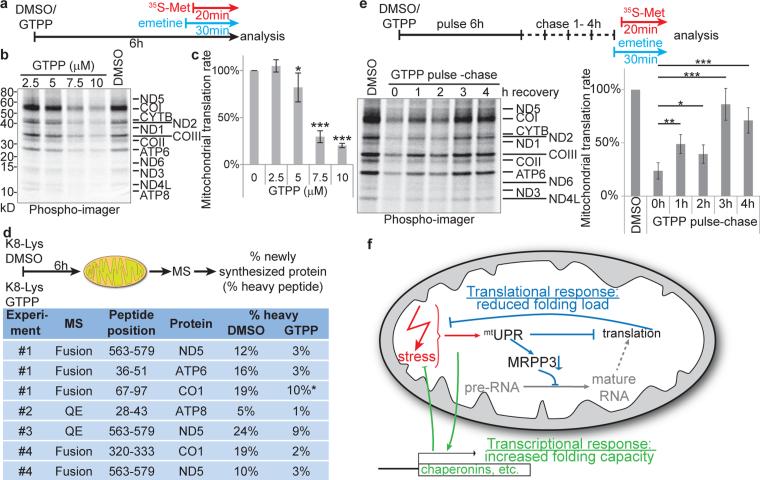
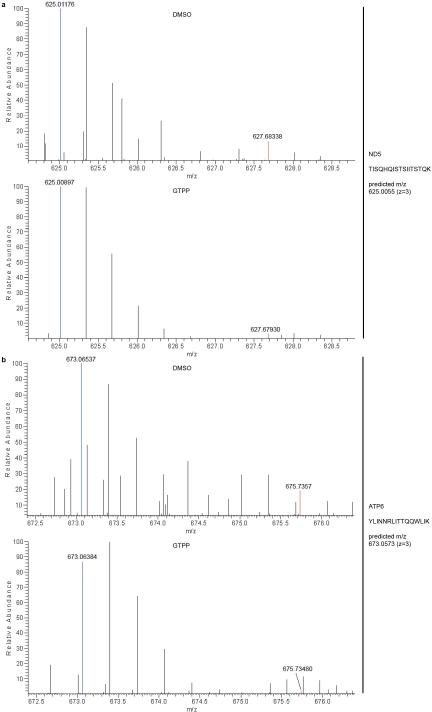
UPRer inhibits cytosolic translation through phosphorylation of eIF2α and local degradation of mRNAs by IRE111. The alterations in genes linked with mitochondrial protein synthesis (Fig. 1 and Fig. 2) together with the finding that mitochondrial pre-RNA processing is deficient during UPRmt led us to examine whether UPRmt affects translation of mRNAs derived from mtDNA (Fig. 4a). Indeed, GTPP treatment (6h) strongly inhibited 35S-Met incorporation into newly synthesized respiratory chain components in a concentration-dependent manner (Fig. 4b, c and Extended Data Fig. 8a) without affecting cytoplasmic translation rates (Extended Data Fig. 8b). To further validate the inhibitory effect of UPRmt on mitochondrial translation, we used stable isotope labeling by amino acids in culture (SILAC) and mass spectrometry to quantify the ratio of newly synthesized (K8-Lys) to pre-existing (K0-Lys) protein for mitochondrially-encoded proteins (Fig. 4d). Translational inhibition was confirmed for ND5, COI, ATP6, and ATP8 (Fig. 4d and Extended Data Fig. 8c, 9a, b) with peptide coverage comparable to previous deep proteome studies in HeLa cells 20. Translational inhibition by GTPP, as well as pre-RNA processing, was largely recovered within 4 h of GTPP wash-out (Fig. 4e and Extended Data Fig. 10a, b), indicating that UPRmt is rapidly reversible.
Fig. 4. UPRmt halts mitochondrial translation.
a, Experimental design. b,c, 35S-Methionine incorporation into newly translated proteins encoded by mtDNA with or without GTPP treatment was measured by SDS-PAGE (panel b) and the gel quantified (panel c). Data are average values ±s.d. across the 13 mitochondrially encoded proteins, two-tailed p-values *p≤0.05, ***p≤0.001. d, Heavy (K8)-Lys pulse assay for mitochondrial translation by SILAC mass spectrometry (top) was used to determine incorporation rates of K8-Lys into four mitochondrially encoded proteins, indicating relative translation rates (bottom); values were determined manually from the MS1 spectra (automatically retrieved values are shown in Extended Data Fig.9c); *signal-to-noise ratios too low for accurate assessment. e, Reversibility of translation inhibition was measured using a GTPP pulse-chase assay wherein GTPP was washed out for 1-4 h (top). Translation rates are average values ±s.d. across the 13 mitochondrially encoded proteins, two-tailed p-values *p≤0.05, ***p≤0.001 and derived from SDS-PAGE of translation products (lower left) as described in panel a. f, Model of the cellular responses to UPRmt induction. See text for details.
We find that acute mitochondrial folding stress promotes a multifaceted response involving: 1) altered expression of nuclear genes, including mitochondrial chaperonins, to increase matrix protein folding capacity, 2) transcriptional repression and LON-dependent degradation of MRPP3 to reduce pre-RNA processing, and 3) induction of rapid but reversible translational inhibition of mtDNA-encoded proteins, thereby reducing matrix folding load (Fig. 4f). As with pre-RNA processing (Extended Data Fig. 7b), cells overexpressing MRPP3 display altered translation of mtDNA encoded proteins, with ND5, COI, ND2 and COIII showing decreased translation relative to control cells (Extended Data Fig. 10c), which complicates interpretation. However, residual MRPP3 post-GTPP treatment did not rescue bulk mitochondrial translation (Extended Data Fig. 10c). This could reflect sub-threshold levels of tRNA processing despite partial rescue (Extended Data Fig. 7) or redundancy in the UPRmt pathway thereby affecting other steps in the translation pathway (Fig. 4g), as is the case with UPRer 11. Alternatively, because MRPP1-dependent tRNA methylation critical for tRNA maturation requires assembly with MRPP321, MRPP3 overexpression may uncouple pre-RNA processing from tRNA methylation, resulting in translational defects despite the presence of MRPP3. While the TFB1M methyltransferase responsible for mitochondrial 12S rRNA methylation is reduced transcriptionally (Fig. 1e), its protein abundance is unchanged at 6 h post-GTPP (Extended Data Fig. 10d), indicating that defects in rRNA methylation do not underlie translational inhibition. Thus, further studies are required to understand the regulation of mitochondrial translation with and without mitochondrial stress. In keeping with the transient nature of stress responses13, our work has focused on acute effects of UPRmt. Components linking mitochondrial protein misfolding to the nucleus remain to be identified, as ATFS-1 orthologs are lacking in mammals. Interestingly, the stress-inducible protein ATF322, which contains a basic leucine zipper like domain similar to ATFS-1, and that can function with CHOP, is also induced 1.5-4 fold by UPRmt (Supplementary Table 1), suggests a possible role in UPRmt signaling. Prolonged UPRmt and concomitant translational inhibition likely leads to confounding effects that would be detrimental to mitochondrial health, consistent with the application of GTPP to cancer therapeutics14. The transcriptional and proteomic data reported here provide a framework for the further elucidation of circuits that contribute to protein homeostasis within mitochondria, and for the development of approaches that can manipulate the response of cells to mitochondrial folding stress, as may occur in pathological conditions including cancer and neurodegenerative diseases.
Extended methods
Chemicals and antibodies
LysC (VWR cat# 100369-822), CDDO (Cayman Chemicals cat# 81035), emetine (Sigma cat# E2375), CCCP (Sigma cat# C2759), rotenone (Sigma cat# R8875), paraquat (Sigma cat#36541), TTFA (Sigma cat# T27006), 3-Nitropropionic acid (Sigma cat# N5636), antimycin A (Sigma cat# A8674), myxothiazole (Sigma cat# T5580), potassium cyanide (Sigma cat# 60178), valinomycin (Sigma cat#V0627), and K8 lysine (Cambridge Isotopes). An original aliquot of GTPP was a gift from D. C. Altieri, a second aliquot was custom synthesized by Shanghai ChemPartner Co. Antibodies used were anti-MRPP3 (LSBio cat# LS-C332515, western blot: 1:500), anti-TOM20 (Santa Cruz cat# sc-11415, western blot: 1:500), anti-LON (Sigma cat# HPA002192, western blot 1:500), anti-ACTIN (Santa Cruz cat# sc69879, western blot 1:500), anti-TFB1M (Abcam, cat# 69871, western blot 1:400), anti-NDUFA9 (Abcam cat# ab14713, blue native 1:1000), anti-SDHA (Abcam cat# ab14715, blue native 1:1000), anti-UQCRC2 (Abcam cat# ab14745, blue native 1:1000).
Cell culture and assays for cytotoxicity, mitochondrial membrane potential and cellular ATP levels
HeLa cells were purchased from ATCC and not further authenticated. They were confirmed to be mycoplasma negative, and grown in RPMI medium supplemented with 1× glutamax (Invitrogen cat# 61870-127) and 10% fetal bovine serum. For all experiments, cells were treated with DMSO and 10μM GTPP (or concentration as indicated) and/or 2.5μM CDDO for 6h. For CCK8 cytotoxicity assays, cell were plated in clear bottom 96-well plates, processed according to the manufacturer's instructions (CCK8 Dojindo CK04-05) and quantified on a VersaMax microplate reader (Molecular Devices). For mitochondrial membrane potential determination, cells were treated with JC-1 (Life Technologies cat# T3168) according to manufacturer's instructions. Cells were harvested and analyzed by fluorescence-activated cell sorting on a BD FACSCalibur. To assess cellular ATP levels, cells were plated on 96-well clear bottom plates and treated with DMSO, GTPP, or 100μM antimycin A. ATP levels were measured with the Mitochondrial ToxGlo assay (Promega G8000) and analyzed on a Molecular Devices SpectraMax M5 multi-mode plate reader.
Quantitative PCR and RNA sequencing
Total RNA was harvested using NucleoSpin RNA or NucleoSpin miRNA for analysis of pre-RNA processing (Macherey-Nagel cat# 740955 and 740971). RNA was quantified and equal amounts were reverse transcribed into cDNA using a High Capacity cDNA Reverse Transcription Kit (Applied Biosystems cat# 4368814). Quantitative PCR was performed using TaqMan Fast universal PCR Master Mix (Applied Biosystems cat#4366072) or Fast SYBR Green Master Mix (Life Technologies cat# 4385612) using an Applied Biosystems 7500 Fast Real-time PCR machine with the following primers: tRNAMet fwd: agtaaggtcagctaaataag, tRNAMet 5’ upstream fwd: gaatcgaacccatccctgag, tRNAMet rev: tagtacgggaagggtataacc, tRNAMet downstream rev: gtgtgcctgcaaagatggtag, tRNALys fwd: cactgtaaagctaacttagc, tRNALys 5’ upstream fwd: gaaatagggcccgtatttacc, tRNALys rev: tcactgtaaagaggtgttgg, tRNALys 3’ downstream rev: gatgaggaatagtgtaaggag, GAPDH fwd: ATGCCTCCTGCACCACCAAC, GAPDH rev: GGGGCCATCCACAGTCTTCT, ND4 fwd: cttcgaaaccacacttatcc, ND4 rev: gtatgcaatgagcgattttagg, or Life Technologies TaqMan probes for GAPDH (Hs02758991_g1), HSPD1 (Hs03044918_g1), HSPE1 (Hs01654720_g1), MRPP3 (Hs00206448_m1), TRAP1 (Hs00212474_m1), DDIT3 (Hs00358796_g1), ATF4 (Hs00909569_g1), BIP (Hs00607129_gH). For analysis of pre-RNA processing, data were normalized to tRNA levels obtained from using internal forward and reverse tRNA primers. For analysis of integrated stress response activation cells were treated with 10μM GTPP, 10μg/ml tunicamycin, 5μM rotenone, 0.5mM paraquat, 0.5mM TTFA, 10mM 3NP, 100μM antimycin A, 3μM myxothiazol, 1mM KCN, 10μM CCCP, or 1μM valinomycin for 6h before purification and analysis of RNA levels by quantitative PCR.
For RNA sequencing, total RNA samples were submitted to the Harvard Bauer Core Facility for processing (ribosomal depletion with RiboZero, directional RNA-seq library preparation, and 12 cycle amplification using LongAmp (New England BioLabs) and indexed primers (Integrated DNA Technologies), quality control, and sequencing in one flow cell on a 75bp paired-end NextSeq for transcriptome analysis or one lane on a 100bp paired-end HiSeq to monitor mitochondrial RNA processing. For transcriptome analysis, reads were examined by FastQC and analyzed by the tophat2 v1.2 analysis pipeline by Harvard Medical School Research Computing against hg19, consisting of analysis by tophat, cufflinks, cuffmerge and cufflinks. For analysis of mitochondrial pre-RNA processing, reads were examined by FastQC, trimmed with cutadapt (for PHRED scores below five) and aligned to hg19 (augmented with transcript information from GRCh37.75) by STAR. Alignments were checked by FastQC and RNA-SeQC, and read counts of known genes detected by featureCounts.
To analyze the RNA-seq dataset for pre-RNA processing, coverage data across a tRNA/mRNA region was normalized for reads within the protein-coding gene region across all six experimental conditions at every cut site. Slopes of the first 10 nucleotides within the tRNA genes adjacent to the cut site were determined in Excel (presented slopes had correlation values of R≥0.9) and calculated as an average of the mean with two-tailed p-values.
Gene ontology enrichment analysis
Sets of genes of interest were uploaded and searched with the DAVID online tool (http://david.abcc.ncifcrf.gov/home.jsp) for enriched biological processes (GOTERM_BP_FAT). Functional annotation charts were saved and visualized with the enrichment map app (v2.0.1)23 in cytoscape (v3.2.1, p≤0.001). Clusters were annotated according to their general functional with their overlapping biological process.
Promoter analysis
3000 bases upstream of the transcription start site of the transcripts encoding mitochondrial proteins and regulated by MTUPR were extracted from ensemble. These promoter sequences were analyzed by FIMO (Find Individual Motif Occurrences, version 4.11.1)24. Motifs were provided as indicated and scanned on a provided DNA database with the list promoter sequences. P-values were set at 0.0001 and are defined as the probability of random sequences of identical length achieving a similar or better score as the sequence provided.
RNAi experiments
Cells were grown on 12-well plates and RNAi was transfected with Lipofectamine 3000 (Life Technologies) according to manufacturer's instructions. RNAi used was MRPP3 (Ambion, AM16708, ID 21858), and TRAP1 (DF/HCC DNA Resource Core IDs: HsSH00112394, HsSH00112407), EIF2AK1 (Dharmacon LQ-005007-00-0002), EIF2AK2 (Dharmacon LQ-003527-00-0002), EIF2AK3 (Dharmacon LQ-004883-00-0002), EIF2AK4 (Dharmacon LQ-005314-00-0002).
Cell line generation
Human cDNA for MRPP3 was purchased from Sino Biological (HG14131-G) and transferred into a pHAGE lentiviral vector. Virus particles were produced in HEK293T cells after transfection with the lentivial vector and helper vectors (VSVG, Tat1b, Mgpm2, CMV-Rev) and used to infect HeLa cells. Cells were selected in 1μg/ml puromycin.
Mass spectrometry
For quantitative analysis of the mitochondrial proteome, HeLa cells were treated with 10μM GTPP or DMSO for 6h. Mitochondria were purified as previously described using Basic Protocol 125. Briefly, cells were scraped into cold PBS, collected by centrifugation, resuspended in lysis buffer, and sonicated. Crude mitochondria were acquired by differential centrifugation and purified mitochondria obtained by separation on a sucrose cushion. Similar amounts of mitochondria were obtained under the different treatments. Mitochondrial pellets were resuspended in lysis buffer (6M GdnHCl, 75mM NaCl, 50mM Tris, pH 8.5, 1mM PMSF, 1× OPT) and sonicated. Samples were reduced, alkylated with iodoacetamide, and proteins were precipitated using chloroform/methanol. Protein pellets were resuspended in 8M urea in 50mM Tris, pH 8.8 and subsequently diluted with 50mM Tris, pH8.8 to a urea concentration of 2M. Proteins were digested with LysC overnight at 37 °C. Digestion reactions were stopped by addition of formic acid, dried, and purified by C18 stage tip. Samples were taken up in 0.2M Hepes, pH 8.5 buffer, quantified by micro BCA (Thermo Scientific cat#23235) and labeled with TMT 6-plex reagents (Thermo Scientific) for 1h at room temperature. Reactions were stopped by addition of 5% hydroxylamine for 15min followed by addition of formic acid. Equal amounts of peptide samples were combined to a total of 10μg and purified on a C18 stage tip. Dried peptides were resuspended in 5% acetronitrile/5% formic acid and analyzed on an Orbitrap Fusion (Thermo Scientific) running a 2h gradient from 6-30% acetonitrile using a multi-notch MS3- based method26 selecting 10 MS2 fragment ions for analysis by MS3 (Orbitrap, AGC 5 × 10⁴, 60,000 resolution, maximum injection time 150ms). Peptides were identified and quantified by a SEQUEST-based in-house tool (developed by the S. P. Gygi laboratory) using SEQUEST with a human UniProt database (as of January 14th 2014), and submitted to linear discriminant analysis to score peptides and proteins with protein and peptide FDR values of 2%27. Proteins were collapsed to a protein-level FDR of 2%. Searches were run for LysC with a maximum of 2 missed cleavage sites and with carbamidomethylation of cysteine residues and TMT tags on lysine residues and N termini as static modifications, and methionine oxidation as variable modification. TMT-based quantitation was performed by TMT-reporter ion analysis for all identified proteins. MS3 spectra with a summed signal-to-noise ratio of <100 were excluded and the TMT channels normalized across all TMT channels (with resulting normalization factors between 1-1.252). For final analysis of quantified proteins, values were transferred and analyzed in Excel and the following cut-offs were applied: minimum number of 2 quantified peptides, two-tailed p-value≤0.05, fold change≥log2 ±0.35. Quantified proteins were determined as mitochondrial if they were found in MitoCarta28, or a IMPI score of ≥0.85 (version Q1 2015, http://www.mrc-mbu.cam.ac.uk/impi). For SILAC analysis, cell culture media was replaced with Lysine-free media supplemented with K8 lysine and dialyzed serum, and treated with DMSO or GTPP. After 6 h, cells were harvested and mitochondria purified, lysed and either processed as for TMT experiments (experiments #1-3), or run on a NuPAGE Novex 12% bis-tris gel (Life Technologies) and cut into 5 fractions, in-gel reduced, alkylated, and digested by LysC (experiment #4). Digested mitochondrial extracts and gel-extracted peptides were purified on C18 stage tips and analyzed by LCMS/MS on a Q Exactive or Orbitrap Fusion (Thermo Scientific) as indicated. Q Exactive analysis was performed with a maximum injection time of 250ms, an AGC target of 106, resolution of 70,000 and automatic dynamic exclusion settings. For SILAC analysis on the Orbitrap Fusion, maximum injection times were set at 100ms, AGC target at 2 × 10⁵, 120,000 resolution, and a dynamic exclusion of 90s. Experiments were processed with our in-house analysis tool and/or Maxquant (as indicated). For analysis on our in-house tool (Core), analysis was performed as above and quantification performed by analysis of peak heights for the heavy and light forms of a peptide. We performed MaxQuant analysis (version 1.5.2.8) with standard Orbitrap settings and LysC digestion mode with cysteine carbamidomethylation as static and methionine oxidation as variable modification against a UNIPROT library (as of March 9th 2015). The minimum ratio count of the protein quantification was set at 1. Results were exported into Excel to calculate heavy-to-light ratios of peptides to determine the percentage of newly synthesized protein as a fraction of heavy peptide intensity versus total intensity. Results of the Maxquant/Core quantifications are shown in Extended Data Fig. 9c. Due to the consistent difficulty of both analysis tools to determine heavy peptide intensities in the GTPP treated samples, heavy and light peptide intensities were also manually determined from MS1 at the observed m/z values and retention times determined by the Maxquant/Core analyses (Fig.4d and Extended Data Fig.10).
Mitochondrial translation assay
HeLa cells were grown on a 12-well plate and treated for 6h with DMSO or different concentrations of GTPP as described. After 5.5h, media was replaced with RPMI lacking methionine and containing 10% dialyzed fetal bovine serum, GTPP or DMSO (at the original concentration), and 100μg/ml emetine to block cytosolic translation. After 10 min, 100μC/ml EasyTag 35S-Methionine (Perkin Elmer cat# NEG709A500UC) was added and incubated for another 20min, totaling 6h of GTPP treatment. Cells were washed with PBS and harvested in 1× NuPAGE LDS sample buffer (Life Technologies) containing 25mM DTT. Samples were boiled and analyzed on a NuPAGE Novex 12% bis-tris gel (Life Technologies). Gels were stained using InstantBlue (Expedeon), dried onto Whatman paper and visualized on a Bio-Rad Personal Molecular Imager to visualize newly synthesized and radioactive proteins. An image was taken of the InstantBlue stained gel to confirm equal loading. These experiments were performed 3 independent times. For pulse-chase analysis, the same protocol was used with washes as indicated. This experiment was performed 2 independent times.
Blue native
Crude mitochondria were obtained as above and lysed in 1% digitonin, followed by separation on 4-16% BN-PAGE as previously described29. Proteins were transferred onto polyvinylidene difluoride membranes and detected using antibodies as indicated. A small aliquot was also analyzed by standard Western blot to confirm equal loading.
Data reporting and statistics
No statistical methods were used to predetermine sample size. The experiments were not randomized. The investigators were not blinded to allocation during experiments and outcome assessment. All quantitative experiments are presented as means ± s.d. of at least two independent biological experiments (as indicated) and were analyzed by a two-tailed student's t-test (considered significant for p-values ≤ 0.05).
Extended Data
Extended Data Figure 1. Mitochondrial HSP90 inhibition induces UPRmt.
a, Quantitative PCR monitoring chaperonin (HSPD1 and HSPE1) mRNA levels upon treatment of cells with GTPP. Shown are means of levels relative to untreated ±s.d. (n=3 biological replicates). b, Measurement of cell viability upon GTPP treatment with CCK8. Shown are means of levels relative to untreated ±s.d. (n=5 biological replicates). c, Measurement of mitochondrial membrane potential upon GTPP or CCCP (mitochondrial membrane potential uncoupler) treatment, measured with JC-1 and analyzed on a BD FACSCalibur. Shown are means of levels relative to untreated ±s.d. (n=3 biological replicates). d, Measurement of cellular ATP levels upon GTPP or antimycin A (electron transport chain inhibitor) treatment. Shown are means of levels relative to untreated ±s.d. (n=4 biological replicates) and two-tailed p-values ***p≤0.001, n.s. not significant. e, Blue native gel analysis of mitochondrial respiratory chain complexes upon 6 h treatments of DMSO or GTPP. f, Changes in chaperonin and TRAP1 mRNA levels upon knockdown with shRNA targeting GFP or TRAP1 mRNA. Shown are means of log2 fold changes relative to control and standard deviation (n=3 biological replicates).
Extended Data Figure 2. UPRmt signals distinctly from the ISR.
a, Table with summarized results of data shown in Fig. 1a-c. Induced genes are labeled green and compounds are clustered into their molecular function. GTPP induces MTUPR and tunicamycin ERUPR. All other compounds affect mitochondrial respiration and/or the mitochondrial membrane potential. b, Schematic showing how different stresses signal through the integrated stress response pathway based on the results shown in b and Extended Data Figure 3. c, Quantitative PCR to assess the mRNA knockdown of the four EIF2A kinases by siRNA smart pools in biological duplicate; repl., replicate d, Quantitative PCR monitoring CHOP mRNA levels in untreated or GTPP treated cells with or without knockdown of the EIF2A kinases as in c. e, Quantitative PCR to monitor PERK mRNA levels upon PERK knockdown with individual siRNAs in biological duplicate. f, Quantitative PCR monitoring CHOP mRNA levels in GTPP treated cells with or without knockdown of PERK by individual siRNAs in biological duplicate.
Extended Data Figure 3. Global analysis of transcriptional responses to UPRmt induction.
a, Heatmap of measured transcript abundances of cells treated with DMSO, 10μM GTPP or 2.5μM CDDO for six hours (n=3 biological replicates). Values not passing the cuffdiff threshold of FPKM abundance and read number were excluded (white). b, Correlation of replicates for DMSO, GTPP, and CDDO treated samples with R-values depicting correlation value. Log10 transformed FPKM values (≥0) are plotted. c, Quantitative PCR monitoring induction of mtUPR by measuring chaperonin mRNA levels upon treatment with DMSO or CDDO. Shown are means of levels relative to DMSO treated ±s.d. (n=3 biological replicates). d, Correlation between the abundance of transcripts significantly altered in GTPP versus CDDO treated cells (Fig. 1c, combined panel). e, Table representing changed transcripts upon GTPP or CDDO treatment (Fig.1c) comparing with the number of transcripts changed upon 17AAG previously reported (Zajac, M., Gomez, G., Benitez, J. & Martínez-Delgado, B. Molecular signature of response and potential pathways related to resistance to the HSP90 inhibitor, 17AAG, in breast cancer. BMC Med. Genomics 3, 44 (2010).).
Extended Data Figure 4. Promoter analysis of UPRmt-induced transcripts encoding mitochondrial proteins.
Analysis of MTUPR-induced (GTPP and CDDO) transcripts encoding mitochondrial proteins for the occurrence of CHOP, MURE1, MURE2, or ATF4 promoter elements. Analysis was performed with FIMA version 4.11.1 utilizing the consensus sequences shown. Cells marked in green represent the presence of the consensus sequence in the gene shown.
Extended Data Figure 5. Changes in the mitochondrial proteome upon UPRmt induction.
a, Assay design. b, Summary of proteomic data. c, Analysis of changes in the average abundance of mitochondrial ribosome (left) or for individual ribosomal subunits (right). Values are mean values ±s.d. of scaled signal to noise values (i.e. relative abundance) derived from the quantitative proteomics (Fig.2) for identified mitochondrial ribosomal subunits (right, n=2 biological replicates) and the average of all these values ±s.d. (left); repl., replicate. d, Analysis of the abundance of the different mitochondrial electron transport chain complexes and ATP synthase. Values are derived from quantitative proteomics (Fig.2) and shown as mean values ±s.d. across all quantified subunits (top left) or separately per subunit for the different complexes (n=2 biological replicates). All data depict scaled signal to noise values (i.e. relative abundance).
Extended Data Figure 6. Mitochondrial pre-RNA processing defects upon UPRmt.
a, Primer design for monitoring pre-RNA processing. Primer pairs1&3 and 2&4 will only produce PCR products for uncleaved mitochondrial pre-RNAs and allows quantitation of non-processed pre-RNAs. Primer pair 2&3 will monitor total levels for normalization. b, Quantitative PCR of MRPP3 mRNA levels upon knockdown with siRNA targeting a scrambled sequence or MRPP3. Shown are averages ±s.d. (n=3 biological replicates). c, qPCR of mitochondrial pre-RNA at tRNAMet and tRNALys RNAseP processing sites upon depletion of MRPP3 by RNAi. Error bars, ±s.d. (n=3 biological replicates). d, Quantitative PCR monitoring levels of non-processed pre-RNA upon treatment of cells with GTPP or the uncoupler CCCP in biological duplicate; repl., replicate e, LON protein levels as determined by quantitative proteomics (Fig.2) in biological duplicate. Shown are scaled signal to noise values observed (i.e. relative abundance). f. Western blot analysis of LON levels upon control or 10μM GTPP treatment (6 h).
Extended Data Figure 7. Rescue of UPRmt-induced mitochondrial pre-RNA processing by MRPP3 overexpression.
a, Western Blot analysis of MRPP3 levels upon DMSO or GTPP treatment in the context of wild-type or MRPP3-overexpressing (o/e) cells. Quantifications of the MRPP3 bands are shown in blue (quantified with Fiji of digitally acquired images). b, Quantitative PCR analysis of non-processed mitochondrial pre-RNA levels at the tRNAMet and tRNALys cut sites in wild-type cells or cells overexpressing MRPP3. Shown are mean values ±s.d. (n=3 biological replicates). c, Quantitative PCR analysis of non-processed mitochondrial pre-RNA levels at the tRNAMet and tRNALys cut sites in wild-type cells or cells overexpressing MRPP3 upon GTPP treatment. Shown are mean values ±s.d. (n=3 biological replicates).
Extended Data Figure 8. Mitochondrial translation defects upon UPRmt.
a, Coomassie gel staining as a loading control of the same experiment as in Fig. 4b. b, Analysis of cytosolic translation upon treatment with DMSO or GTPP with the same experimental procedure as in Fig. 4a without the addition of emetine. Newly synthesized proteins were monitored by phospho-imager (left panel) with Coomassie staining of the same gel as loading control (right panel). c, Table of experiment number, mass spectrometer used, analysis method, peptides sequence, protein encoded and heavy-to-light ratios (H/L) used to determine protein synthesis rates in Fig. 4d. Fusion and QE are Orbitrap Fusion or Q Exactive (Thermo Scientific), respectively; Core depicts in-house mass spectrometry analysis pipeline; #, oxidative modification on methionine, *, could not be determined by Core/Maxquant.
Extended Data Figure 9. Proteomic determination of mitochondrial translation upon UPRmt.
SILAC spectra for the data shown in Fig. 4d and Extended Data Fig. 9c for experiment #1 data.
Extended Data Figure 10. Reversibility of UPRmt-induced mitochondrial pre-RNA processing and translation defects.
a, Coomassie gel staining as a loading control of the same experiment as in Fig. 4e. b, Mitochondrial pre-RNA processing was measured by qPCR in cells subjected to GTTP pulse-chase wash-out for 1-4h. Data are averages of fold changes versus untreated ±s.d., two-tailed p-values *p≤0.05, **p≤0.01, ***p≤0.001, n=3 biological replicates. c, Analysis of mitochondrial translation in wild-type or MRPP3 overexpressing cells with or without GTPP treatment. Newly synthesized proteins were labeled with 35S and analyzed by phospho-imager. d, Immunoblot of TFB1M expression with or without 6h GTPP treatment (left). Quantification of control normalized TFB1M levels from immunoblots of two independent experiments.
Supplementary Material
Acknowledgments
We thank D. C. Altieri for GTPP, J. Paulo and S. P. Gygi for assistance with mass spectrometry, and L. Pontano and S. H. Sui (Harvard School of Public Health Bioinformatics Core) for assistance with RNA-seq analysis. This work was supported by NIH grant R37NS083524 and Biogen, Inc (J.W.H.), and an EMBO Fellowship (C.M.).
Footnotes
Author Contributions C.M. and J.W.H. were responsible for project conception, data analysis and manuscript preparation. All experiments were performed by C.M.
Author Information RNA sequencing data are deposited in the Gene Expression Omnibus (GEO) under accession number GSE75411. The authors declare competing financial interests: details are available in the online version of the paper.
References
- 1.Haynes CM, Petrova K, Benedetti C, Yang Y, Ron D. ClpP mediates activation of a mitochondrial unfolded protein response in C. elegans. Dev. Cell. 2007;13:467–80. doi: 10.1016/j.devcel.2007.07.016. [DOI] [PubMed] [Google Scholar]
- 2.Haynes CM, Yang Y, Blais SP, Neubert T. a, Ron D. The matrix peptide exporter HAF-1 signals a mitochondrial UPR by activating the transcription factor ZC376.7 in C. elegans. Mol. Cell. 2010;37:529–40. doi: 10.1016/j.molcel.2010.01.015. [DOI] [PMC free article] [PubMed] [Google Scholar]
- 3.Nargund AM, Pellegrino MW, Fiorese CJ, Baker BM, Haynes CM. Mitochondrial import efficiency of ATFS-1 regulates mitochondrial UPR activation. Science. 2012;337:587–90. doi: 10.1126/science.1223560. [DOI] [PMC free article] [PubMed] [Google Scholar]
- 4.Zhao Q, et al. A mitochondrial specific stress response in mammalian cells. EMBO J. 2002;21:4411–9. doi: 10.1093/emboj/cdf445. [DOI] [PMC free article] [PubMed] [Google Scholar]
- 5.Horibe T, Hoogenraad NJ. The chop gene contains an element for the positive regulation of the mitochondrial unfolded protein response. PLoS One. 2007;2:e835. doi: 10.1371/journal.pone.0000835. [DOI] [PMC free article] [PubMed] [Google Scholar]
- 6.Aldridge JE, Horibe T, Hoogenraad NJ. Discovery of genes activated by the mitochondrial unfolded protein response (mtUPR) and cognate promoter elements. PLoS One. 2007;2:e874. doi: 10.1371/journal.pone.0000874. [DOI] [PMC free article] [PubMed] [Google Scholar]
- 7.Haynes CM, Fiorese CJ, Lin Y-F. Evaluating and responding to mitochondrial dysfunction: the mitochondrial unfolded-protein response and beyond. Trends Cell Biol. 2013;23:311–8. doi: 10.1016/j.tcb.2013.02.002. [DOI] [PMC free article] [PubMed] [Google Scholar]
- 8.Kang BH, et al. Combinatorial drug design targeting multiple cancer signaling networks controlled by mitochondrial Hsp90. J. Clin. Invest. 2009;119:454–64. doi: 10.1172/JCI37613. [DOI] [PMC free article] [PubMed] [Google Scholar]
- 9.Bernstein SH, et al. The mitochondrial ATP-dependent Lon protease: a novel target in lymphoma death mediated by the synthetic triterpenoid CDDO and its derivatives. Blood. 2012;119:3321–9. doi: 10.1182/blood-2011-02-340075. [DOI] [PMC free article] [PubMed] [Google Scholar]
- 10.Holzmann J, et al. RNase P without RNA: identification and functional reconstitution of the human mitochondrial tRNA processing enzyme. Cell. 2008;135:462–74. doi: 10.1016/j.cell.2008.09.013. [DOI] [PubMed] [Google Scholar]
- 11.Walter P, Ron D. The Unfolded Protein Response: From Stress Pathway to Homeostatic Regulation. Science (80−. ) 2011;334:1081–1086. doi: 10.1126/science.1209038. [DOI] [PubMed] [Google Scholar]
- 12.Kim YE, Hipp MS, Bracher A, Hayer-Hartl M, Hartl FU. Molecular chaperone functions in protein folding and proteostasis. Annual review of biochemistry. 2013;82 doi: 10.1146/annurev-biochem-060208-092442. [DOI] [PubMed] [Google Scholar]
- 13.Lamech LT, Haynes CM. The unpredictability of prolonged activation of stress response pathways. J. Cell Biol. 2015;209:781–7. doi: 10.1083/jcb.201503107. [DOI] [PMC free article] [PubMed] [Google Scholar]
- 14.Siegelin MD, et al. Exploiting the mitochondrial unfolded protein response for cancer therapy in mice and human cells. J. Clin. Invest. 2011;121:1349–60. doi: 10.1172/JCI44855. [DOI] [PMC free article] [PubMed] [Google Scholar]
- 15.Guyton KZ, Xu Q, Holbrook NJ. Induction of the mammalian stress response gene GADD153 by oxidative stress: role of AP-1 element. Biochem. J. 1996;314(Pt 2):547–54. doi: 10.1042/bj3140547. [DOI] [PMC free article] [PubMed] [Google Scholar]
- 16.Zajac M, Gomez G, Benitez J, Martínez-Delgado B. Molecular signature of response and potential pathways related to resistance to the HSP90 inhibitor, 17AAG, in breast cancer. BMC Med. Genomics. 2010;3:44. doi: 10.1186/1755-8794-3-44. [DOI] [PMC free article] [PubMed] [Google Scholar]
- 17.McAlister GC, et al. MultiNotch MS3 enables accurate, sensitive, and multiplexed detection of differential expression across cancer cell line proteomes. Anal. Chem. 2014;86:7150–8. doi: 10.1021/ac502040v. [DOI] [PMC free article] [PubMed] [Google Scholar]
- 18.Schwanhäusser B, et al. Global quantification of mammalian gene expression control. Nature. 2011;473:337–342. doi: 10.1038/nature10098. [DOI] [PubMed] [Google Scholar]
- 19.Sanchez MIGL, et al. RNA processing in human mitochondria. Cell Cycle. 2011;10:2904–16. doi: 10.4161/cc.10.17.17060. [DOI] [PubMed] [Google Scholar]
- 20.Nagaraj N, et al. Deep proteome and transcriptome mapping of a human cancer cell line. Mol. Syst. Biol. 2014;7:548–548. doi: 10.1038/msb.2011.81. [DOI] [PMC free article] [PubMed] [Google Scholar]
- 21.Reinhard L, Sridhara S, Hallberg BM. Structure of the nuclease subunit of human mitochondrial RNase P. Nucleic Acids Res. 2015:1–9. doi: 10.1093/nar/gkv481. [DOI] [PMC free article] [PubMed] [Google Scholar]
- 22.Jiang H, et al. Activating Transcription Factor 3 Is Integral to the Eukaryotic Initiation Factor 2 Kinase Stress Response. Mol. Cell. Biol. 2004;24:1365–1377. doi: 10.1128/MCB.24.3.1365-1377.2004. [DOI] [PMC free article] [PubMed] [Google Scholar]
- 23.Merico D, Isserlin R, Stueker O, Emili A, Bader GD. Enrichment map: A network-based method for gene-set enrichment visualization and interpretation. PLoS One. 2010;5 doi: 10.1371/journal.pone.0013984. [DOI] [PMC free article] [PubMed] [Google Scholar]
- 24.Grant CE, Bailey TL, Noble WS. FIMO: Scanning for occurrences of a given motif. Bioinformatics. 2011;27:1017–1018. doi: 10.1093/bioinformatics/btr064. [DOI] [PMC free article] [PubMed] [Google Scholar]
- 25.Bozidis P, Williamson CD, Colberg-Poley AM. Current protocols in cell biology / editorial board, Juan S. Bonifacino ... [et al.] 2007 doi: 10.1002/0471143030.cb0327s37. Chapter 3, Unit 3.27. [DOI] [PubMed] [Google Scholar]
- 26.McAlister GC, et al. MultiNotch MS3 enables accurate, sensitive, and multiplexed detection of differential expression across cancer cell line proteomes. Anal. Chem. 2014;86:7150–8. doi: 10.1021/ac502040v. [DOI] [PMC free article] [PubMed] [Google Scholar]
- 27.Huttlin EL, et al. A tissue-specific atlas of mouse protein phosphorylation and expression. Cell. 2010;143:1174–89. doi: 10.1016/j.cell.2010.12.001. [DOI] [PMC free article] [PubMed] [Google Scholar]
- 28.Pagliarini DJ, et al. A mitochondrial protein compendium elucidates complex I disease biology. Cell. 2008;134:112–23. doi: 10.1016/j.cell.2008.06.016. [DOI] [PMC free article] [PubMed] [Google Scholar]
- 29.McKenzie M, Lazarou M, Thorburn DR, Ryan MT. Mitochondrial respiratory chain supercomplexes are destabilized in Barth Syndrome patients. J. Mol. Biol. 2006;361:462–9. doi: 10.1016/j.jmb.2006.06.057. [DOI] [PubMed] [Google Scholar]
Associated Data
This section collects any data citations, data availability statements, or supplementary materials included in this article.


