

Abstract
Single-molecule, protein-induced fluorescence enhancement (PIFE) serves as a molecular ruler at molecular distances inaccessible to other spectroscopic rulers such as Förster-type resonance energy transfer (FRET) or photoinduced electron transfer. In order to provide two simultaneous measurements of two distances on different molecular length scales for the analysis of macromolecular complexes, we and others recently combined measurements of PIFE and FRET (PIFE-FRET) on the single molecule level. PIFE relies on steric hindrance of the fluorophore Cy3, which is covalently attached to a biomolecule of interest, to rotate out of an excited-state trans isomer to the cis isomer through a 90° intermediate. In this work, we provide a theoretical framework that accounts for relevant photophysical and kinetic parameters of PIFE-FRET, show how this framework allows the extraction of the fold-decrease in isomerization mobility from experimental data, and show how these results provide information on changes in the accessible volume of Cy3. The utility of this model is then demonstrated for experimental results on PIFE-FRET measurement of different protein–DNA interactions. The proposed model and extracted parameters could serve as a benchmark to allow quantitative comparison of PIFE effects in different biological systems.
Introduction
Fundamental molecular transactions responsible for the cell’s homeostasis (such as in transcription, translation, and replication) involve dynamic interactions of multiple components and their regulations via allostery, conformational changes, or translocation. As an example, protein–DNA interactions play a crucial role in many essential biological processes in which three-dimensional multicomponent structures and their dynamic changes are often directly related to their functions. Especially, the dynamic aspects of structural changes that occur upon protein binding to DNA are still difficult to capture with standard biophysical techniques.
A powerful technique for the study of dynamic conformational changes in biomolecules is Förster-type resonance energy transfer (FRET),4 which is capable of probing distances comparable to the size of small-to-midsized proteins, as well as short dsDNAs (∼3–10 nm). Two-color FRET is a one-dimensional (one distance) ruler that can probe the inter- or intramolecular distance between donor and acceptor fluorophores attached to a macromolecule (or to two different components of a macromolecular complex).5 If the fluorophores are suitably positioned on the macromolecule/complex, FRET can report on the conformational states and on dynamic fluctuation in their structure. If three or four different fluorophores are used simultaneously, up to 6 distances can be probed simultaneously.6−9
At the single molecule level, single molecule FRET (smFRET) can mostly report on nonequilibrium time trajectories of the distance reaction coordinate (when molecules/complexes are immobilized) and distinguish subpopulations of different conformational states under various biochemical conditions (when molecules diffuse in solution). In Protein–DNA interactions, such as in the case of RNA polymerization and nuclease activity by restriction enzymes, better insights into the structure and function of these complexes could be gained by simultaneously measuring multiple distances in the presence or absence of multiple components within a complex.6−10 However, measuring several distances with the same distance range is not always sufficient. In fact, a combination of two molecular rulers with different distance scales may be beneficial to simultaneously identify “large” structural conformational changes (e.g., of DNA) together with smaller scale structural changes (e.g., by changes in binding mode).
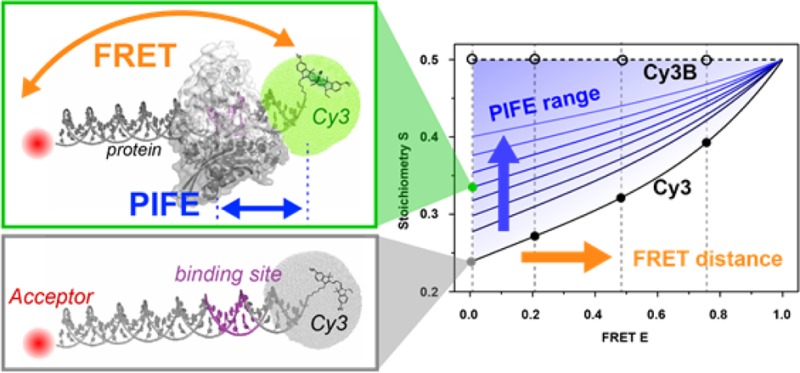
We recently demonstrated11 the combination of microsecond alternating-laser excitation (μsALEX)-smFRET12 with a shorter-range single-molecule distance ruler based on protein-induced fluorescence enhancement (PIFE).13−23 In this technique (which we dubbed ALEX-based PIFE-FRET), an environmentally sensitive cyanine fluorophore (Cy3) is placed at a position on a double-stranded DNA that is close (<3 nm) to a protein binding site. Upon binding, or upon small distance translocations of the protein with respect to the labeled position, the fluorescence intensity of the environmentally sensitive fluorophore is altered. The cyanine fluorophore Cy3 acted both as FRET donor and as PIFE proximity probe. A FRET acceptor fluorophore (ATTO 647N) was attached on the same dsDNA further away from the Cy3 attachment base. Utilizing a microsecond alternating laser excitation (μsALEX) scheme,12 we demonstrated that the ratiometric observable FRET efficiency, E, and the ratiometric observable Stoichiometry, S, could report on the interprobe distance and the protein proximity, respectively.11
In this work, we present the theoretical framework of ALEX-based PIFE-FRET and demonstrate its ability to quantitate experimental results. We show that the fold-increase in Cy3 emission intensity, fluorescence quantum yield or fluorescence lifetime (in single molecule PIFE experiments), and changes in stoichiometry (as utilized in ALEX-based PIFE-FRET experiments) are manifestations of the underlying steric hindrance of the Cy3 isomerization mobility. Due to its structure, the excited-state Cy3 is susceptible for significant isomerization mobility. The presence of a bound protein in close proximity to the dye sterically hinders its mobility and may also specifically interact with it. Our model reveals the dependencies of fluorescence emission intensity and quantum yield on the hindered isomerization rate constants. We demonstrate how ALEX-based PIFE-FRET measurements can be fitted by the proposed model and provide best fit values for the relevant parameters. We then apply ALEX-based PIFE-FRET to study the restriction enzyme BamHI–dsDNA interaction and quantify the dynamic range of the ruler. In addition, we studied the interaction of the T7 polymerase gp5/trx with DNA. Lastly, we show how to disentangle FRET efficiency values from Stoichiometry values in ALEX-based PIFE-FRET.
Experimental and Theoretical Methods
Reagents
Procedures and reagents are described in Ploetz and Lerner et al.11 The results analyzed here, were obtained from two different dsDNA systems as described before. In short, the distance dependence of PIFE in te absence of FRET was tested on a 40bp-long dsDNA11 carrying Cy3(B) and ATTO 647N at opposite 5′-ends. All dsDNAs contained a palindromic sequence 5′-GGATCC-3′ for the restriction enzyme BamHI placed at 1,2,3,5 or 7 bp away from the donor. For experiments involving unspecific binding of T7 polymerase gp5/trx and controls for BamHI, 45 bp-long dsDNA was used as described before11 labeled with Cy3(B) at the 5′-end of the top strand, and ATTO 647N at 8,13,18,23,28 or 33bp of the bottom strand were employed.
ALEX-experiments were carried out at ∼25–50 pM of dsDNA at room temperature (22 °C). The imaging buffer contained 50 mM TRIS-HCl, 100 mM sodium chloride, 10 mM calcium chloride, 0.1 mM EDTA and 143 mM bME at pH 7.4.
μsALEX Spectroscopy and Analysis
The instrumentation, data acquisition and data analysis for μs-ALEX have been previously described in detail.11,24,25 Shortly, the alternation period was set to 50 μs, and the excitation intensity to 60 μW at 532 nm and 25 μW at 640 nm. A 60× objective with NA = 1.35 (Olympus, UPLSAPO 60XO, Germany) was used. Laser excitation was focused to a diffraction limited spot 20 μm into the solution. Fluorescence emission was collected, filtered against background (using a 50-μm pinhole and bandpass filters) and detected with two avalanche photodiode detectors (τ-sPAD, Picoquant, Germany). All data analysis was performed using a home-built Python-based software.11 As described previously,26,27 μsALEX spectroscopy records four photon streams: donor-based donor emission F(DD), donor-based acceptor emission F(DA), acceptor-based acceptor emission F(AA) and donor-based emission after acceptor excitation F(AD) (which can be neglected). Bursts in the three channels were identified applying a dual color burst search28,29 with parameters M = 15, T = 500 μs, and L = 25; additional filtering removed slow-varying changes in fluorescence intensity and thresholding selected for bright single-molecule bursts (>100 photons per burst unless otherwise mentioned). After burst identification, fluorophore stoichiometries S and apparent FRET efficiencies E* were calculated26,27 for each burst. Uncorrected FRET efficiency E* monitors the proximity between the two fluorophores and is calculated according to
| 1 |
S is defined as the ratio between the overall green fluorescence intensity over the total green and red fluorescence intensity and describes the ratio of donor-to-acceptor fluorophores in the sample S:
| 2 |
By binning the detected bursts into a 2D E*/S histogram, subpopulations as free and protein-bound DNA species can be separated according to their S-values. E*- and S-distributions were fitted using a Gaussian function, yielding the mean values μi of the distribution and an associated standard deviations wi. To obtain accurate E and corrected S values, background was subtracted and the spectral crosstalk corrected. Finally, a gamma factor correction was applied, i.e., use of γCy3B of free Cy3B-labeled oligos12 to all data sets.
Simulations and Data Fitting
Applying the theory in either simulations respectively for experimental data fitting was performed using scripts in Matlab R2008b respectively R2013b (MathWorks Matlab, Natick, MA, USA). The differential equations (eqs 5) were numerically solved by use of the ordinary differential equation solver function ode45. For the numerical solution of systems of coupled ordinary differential equations, the matlab built-in ode package allows full control over fine-tuning the numerical solution process. Nevertheless, the matlab built-in matrix exponentiation function expm allows for a faster and efficient numerical solution and can be used instead of ode45. Calculations were then performed according to eqs 6–8, 10–12, and 15. Data fitting was performed by comparison of experimental S(E) values to the theoretical computed ones until the square sum of the fitting residues was minimized.
Accessible volume calculations of Cy3 attached to the 5′-end of dsDNA, in the absence or presence of BamHI, were performed using the software provided by Sindbert et al.30 The crystal structure (pdb code: 2BAM) was used for accessible volume calculations for BamHI.31
Results and Discussion
A Quantitative Photophysical Model for PIFE-FRET
The photophysics of Cy3 as a molecular rotor32,33 used in PIFE is explained following the Jablonski diagram in Figure 1. Cy3 exists in trans and cis isomers in the ground state. Although the pi-conjugated system restricts rotations about the one-dimensional polymethine group, the trans and cis ground-state isomers typically interconvert in the μs time range,34 probably via vibrational weakening of the double bond inducing double bond twisting.35 Out of the two ground-state isomers, the trans isomer has a larger absorption cross-section at λ = 532 nm, owing to its absorption spectrum peak (cis isomer is red-shifted by ∼20 nm14), higher thermodynamic stability,35 its symmetry, and its larger excitation dipole moment (in comparison to the dipole of the cis form). Nonetheless, excitation of the cis ground-state isomer may still occur. We denote the fraction of molecules excited from the trans ground-state isomer with α, and the fraction of molecules excited from the cis isomer with 1-α (see Figure 1C).
Figure 1.

Model of PIFE-FRET. (A) cis and trans isoforms of the cyanine fluorophore Cy3. (B) Excited-state Cy3 undergoes isomerization between a bright trans isomer and a dim cis isomer via a 90° isomerization intermediate. In the presence of an acceptor fluorophore, the excited trans isomer Dtrans* of Cy3 is deactivated via one of three possible pathways: (i) by Förster-type resonance energy transfer kFRET to the acceptor, (ii) direct deexcitation from excited- to ground-state trans isomer through either fluorescence or internal conversion kD, and (iii) deactivation by excited-state isomerization (kT→90). The excited intermediate state D90 is tightly coupled to the ground state 90°-transition state and hence undergoes fast de-excitation (kD,90) to the ground state of both isomers. (C) The steady state population density between the cis and trans isomers of Cy3 is shifted toward the trans isomer due to changes in the microenvironment of Cy3 caused by steric hindrance from a nearby bound protein.
After excitation, the electronic configuration of the excited state allows fast rotation around the central polymethine bond, due to a reduction in bond order following electronic excitation. This, in turn, allows Cy3 to isomerize between trans and cis through a 90° isomerization intermediate.14,36 The excited-state isomerization rate constants from trans to 90° intermediate and back are denoted by kD,trans→90, kD,90→trans, and from cis to 90° intermediate as kD,cis→90, kD,90→cis. This intermediate has been reported to be tightly coupled to the ground-state,14,35−37 allowing fast nonradiative de-excitation with branching into both cis and trans isomers.35 Therefore, the 90° intermediate serves as an efficient sink for excited-state deactivation and competes with fluorescence. The de-excitation rate from the 90° excited-state intermediate is denoted as kD,90. Excitation energy can be depleted radiatively or transferred only from planar forms of Cy3.
Altogether, the excited-state cis and trans isomers may yield fluorescence or FRET, but the 90° excited-state isomerization intermediate cannot. The de-excitation rate constants from the trans and cis isomers represent sums of all radiative and nonradiative de-excitation processes including fluorescence, internal conversion, or Förster-type resonance energy transfer (FRET) and are denoted as kD,T, and kD,C respectively. The de-excitation from the cis isomer has been reported to be mostly nonradiative.35,38 In addition, the transient absorption in the cis ground-state isomer, hundreds of ns after excitation, reports on population of the cis ground-state isomer. The isomer is reached via branching on the potential energy surface at the 90° transition-state, rather than directly from the cis isomer after de-excitation.14 Therefore, out of the three excited-state isomers, it is mostly the trans isomer for which de-excitation yields fluorescence. Hence the longer Cy3 survives in the trans excited-state isomer after excitation, the higher the probability it will yield a fluorescence photon upon relaxation back to ground state. PIFE is the results of a modulation in isomerization rate due to steric hindrance. This hindrance is responsible for enhancement in the trans isomer survival (and reduction in isomerization into the 90° isomerization intermediate).
In PIFE-FRET, an acceptor fluorophore is placed closely to the Cy3 and acts as yet another nonradiative sink for the excitation energy. Since FRET is effective for distances of ∼3–10 nm, no direct steric hindrance is imposed on Cy3 by the acceptor fluorophore. However, the FRET process reduces the time Cy3 spends in the excited-state (including in the trans isomer hence reducing the fluorescence quantum yield of the donor), which in turn will lead to a reduction in the magnitude of a possible PIFE effect. Problematically, macromolecular binding often involves an accompanied conformational change. If PIFE probes the binding of a protein proximal to a Cy3 placed on dsDNA and if the dsDNA undergoes a conformational change upon binding, a PIFE effect could potentially be masked by an increase in FRET efficiency. We will show below how this coupling can be disentangled.
Energy transfer from the trans excited-state isomer is described here as another de-excitation rate constant (eq 3):
| 3 |
where R0,T is the Förster radius, the distance at which 50% of the excitation energy is transferred via FRET to the acceptor, r is the distance between the dipole moments of Cy3 and the acceptor fluorophore, and E is the FRET efficiency from the trans donor. Energy transfer may also occur from the cis Cy3 excited-state isomer (eq 4):
| 4 |
This treatment of FRET is accurate as long as the dsDNA structures with either a protein bound or unbound can be considered static.39,40 Other cases require an extension of the model (given in the SI). In the static case, the FRET rate constant is a direct function of the FRET efficiency. Since PIFE modulates the Förster radii R0,T and R0,C, the FRET rate constant is a function of the modulated Förster radius R0 and dye distance. Since the latter might also be influenced depending on the chosen protein system, we treat the rates as functions of FRET efficiency in this uniform approach. For further discussion regarding heterogeneous and dynamic FRET systems, see discussion in the SI.
Following the Jablonski diagram (Figure 1) and the above-mentioned rationale, PIFE-FRET can be described by the following set of coupled rate equations (eqs 5):
 |
5 |
Here, DT*, D90 and DC* represent the time-dependent occupancy of Cy3 excited-state trans, Cy3 excited-state cis, and the 90° isomerization intermediate, respectively. Since the 90° isomerization intermediate is not expected to be de-excited radiatively, the fluorescence signal of Cy3 and the corresponding acceptor in PIFE-FRET can be calculated from DT, DC*. and A* which is the survival probability of the excited acceptor.
We have recently demonstrated applications of the PIFE ruler using ALEX-based PIFE-FRET (i.e., using fluorescence intensity-based measurements rather than fluorescence lifetimes measurements11). The effect of PIFE was qualitatively linked to changes in the stoichiometry measure.12 We demonstrated that our approach could simultaneously provide two dynamic molecular rulers at different length scales as long as the acceptor is insensitive to changes in its microenvironment. Here, we compare experimental results obtained before to our derived model (eqs 5). This attempt requires knowledge of FRET efficiency E and the Stoichiometry S both of which we derive from Cy3 (donor) intensity and the acceptor intensity according to
| 6 |
| 7 |
The intensities in eqs 6 and 7 are calculated for the alternation period during which the donor is excited. During the acceptor’s excitation period, only the acceptor is excited, and hence it yields fluorescence after direct excitation, with a rate and total intensity of
| 8 |
respectively.
A good practice for carrying Cy3-based PIFE-FRET measurements is the utilization of the Cy3B fluorophore in control experiments. Cy3B is the chemical equivalent of the trans Cy3 isomer without isomerization possibility. The FRET rate equations, for Cy3B acting as a donor, are therefore simplified to
 |
9 |
The fluorescence intensity of Cy3B is then calculated according to
| 10 |
The mean values of the FRET efficiency E and stoichiometry S distributions given in an E–S histogram are calculated according to
| 11 |
| 12 |
The FRET efficiency calculated for either the Cy3-donor or Cy3B-donor assumes both FRET pairs have been normalized to the same Förster radius using the R0 of the Cy3B-acceptor pair. This is achieved following the corrections’ scheme given in Ploetz and Lerner et al.11 Following this approach, we treat all data after gamma correction and convert all FRET efficiencies onto the common R0-axis of Cy3B by employing the gamma of Cy3B. The absolute quantum yield changes and absolute gamma values of complex protein system do not interfere anymore with the FRET efficiency, but are decoupled.
Incorporation of Steric Hindrance into the PIFE-FRET Model
Rotational diffusion of Cy3 on dsDNA might be hindered upon binding of a protein close to the attachment site. The fluorescence quantum yield (QY) of Cy3 is directly proportional to the degree of isomerization inhibition from the excited-state trans isomer. Since isomerization requires available space to accommodate the spatial change in the structure of Cy3, its fluorescence spectrum is sensitive to the microenvironment. The average fluorescence intensity, fluorescence lifetime, or QY of Cy3 are expected to be low when the fluorophore is free to isomerize. This occurs partly due to loss of excitation energy via nonradiative relaxation through the 90° isomerization intermediate. An induced change in the microenvironment, such as in the case of protein binding in close proximity, can sterically restrict Cy3 and hence impede its isomerization. Steric restriction will decrease the isomerization rate and thus increase radiative recombination from the trans isomer, leading to increased fluorescence intensity and an increased fluorescence QY.
According to Kramers’ kinetic theory, the isomerization rate constants (eqs 5) depend on the free energy of the excited-state isomers, on the free energy barrier between isomers (in the exponential term), and on the isomerization mobility/diffusivity (in the pre-exponential term). Steric interactions are the manifestation of volume excluded by a near-by molecular system (excluding all other types of interactions). Steric hindrance of Cy3 should therefore result in restricted isomerization mobility. Cy3 isomerization mobility could be influenced by the viscosity of its microenvironment (microviscosity)13,32,33 and/or by steric hindrance.14−16,41 These will affect the pre-exponential term of the Kramers isomerization rate constant without changing the activation barrier for isomerization. However, specific interactions of the fluorophore with a nearby molecule may also induce a delay in isomerization, which will lead to an increase in activation barrier for isomerization. Here we provide a model that accounts for PIFE as the effect of steric hindrance on cis/trans isomerization. In diffusion activated reactions, restricted rotational mobility due to steric hindrance is linearly dependent on the excluded volume.42 The modified isomerization rate of a Cy3 in the presence of a nearby protein could therefore be written as
| 13 |
where kiso represents all isomerization rates (kT→90,k90→T,kC→90,k90→C), kiso′ represents all modified isomerization rates due to steric hindrance, VT and Vf are the accessible volumes to Cy3 (see Figure 2A) in the absence and presence of steric hindrance, respectively, and B is a proportionality constant that accounts for solvent properties, tethering of the dye to the DNA, other specific interactions, etc. VT – Vf is the excluded volume, and ξ = VT/(VT – Vf) is Cy3′s normalized accessible volume in the presence of steric hindrance (eq 13). Importantly, this allows to define a universal PIFE parameter, ρ, which is the ratio of the isomerization rate constants in the absence and presence of steric hindrance.
Figure 2.

PIFE results for BamHI–DNA interaction. (A) Illustrations of dsDNA with donor (Cy3) and acceptor (ATTO 647N), separated by 40 bp. The restriction enzyme BamHI binds specifically to the DNA containing its palindromic DNA sequence (purple). Binding of BamHI restricts the available volume of Cy3 at a separation of 1 bp away from the protein-binding sequence, leading to an increased brightness. At a separation of 7 bp away from the binding site, the available volume of Cy3 is maximized, and the brightness of Cy3 is low. (B) ALEX-based PIFE-FRET experimental results (circles) and a global fit using the PIFE model (solid lines) for dsDNA labeled with Cy3(B) at the 5′-end and ATTO 647N as acceptor on the complementary strand. Control experiments with FRET distances of 33, 23, 18, and 13 bp (absence of BamHI) are shown in black. PIFE-FRET results at 33 bp separation in the presence of BamHI are shown for 1 (red), 2 (orange), 3 (green), 5 (blue), and 7 (purple) bp separation between the donor and BamHI. The obtained PIFE factors for the 5 DNA constructs are shown in the legend and in Figure 3.
In order to calculate the PIFE effect for a particular case, one needs to replace all isomerization rate constants in eq 5 with the modified isomerization rate constants of eq 13. For this, however, the volume explored by the fluorophore in the absence and presence of the bound protein needs to be evaluated. If a protein–DNA crystal structure exists for a particular interaction of interest, the volume explored by the mobile fluorophore could be estimated via published procedures.30
Utilization of the PIFE-FRET Model
In ALEX-based PIFE-FRET, a given Cy3-acceptor pair will yield a particular S value. In the presence of a nearby bound protein (or any other steric hindrance), if contact quenching does not occur, this S value will increase (assuming that there are no changes in E). Following directly from the increase in Cy3 fluorescence intensity (assuming there is no change in the acceptor’s fluorescence). Such a simple case was reported for the interaction of the restriction enzyme BamHI with dsDNA.11,16 Since the nonradiative de-excitation of Cy3 through isomerization (modulated by PIFE) and through FRET to the acceptor, the molecular target and its binding position have to be carefully chosen so that PIFE and FRET are sensitive to binding and conformation, respectively. To maximize the PIFE effect, it is advisible to position the acceptor away from Cy3 at a distance which is close-to or larger than the corresponding Förster radius R0.
In many cases, protein–DNA interactions trigger a conformational change not only to the DNA, but both to the protein and the DNA. Upon protein binding, DNA can exhibit bending (e.g., introduced by the restriction enzyme EcoRV), bubble-formation (triggered by RNA polymerases) and other types of DNA conformational changes. Such conformational changes may alter the FRET efficiency, which in turn will introduce an increase in Stoichiometry due to the decreased survival time in the excited Cy3, regardless of PIFE effects. E and S values in ALEX-based PIFE-FRET experiments are not independent and require careful calibration.
In the absence of PIFE and depending on the intrinsic rate constants and the relevant parameters (eqs 5), one could plot S values as a function of E values, i.e., S(E). This S(E) curve will dictate a lower bound on PIFE related change in S (see Figure 2B, black solid line). If Cy3 is replaced with Cy3B, and all corrections are applied, the corresponding S should, by definition, always be 0.5.11,12 So any result that points to a PIFE effect in an ALEX-based PIFE-FRET measurement should fall above the S(E) curve for Cy3 and below that for Cy3B (see Figure 2B, black dashed line).
In previous published work,11 we performed μsALEX measurement for the restriction enzyme BamHI bound to dsDNA, having Cy3 or Cy3B as a donor, and ATTO 647N as an acceptor, at different donor–acceptor separations. The results of these experiments were fitted to the PIFE-FRET model (eqs 5–12) and are shown in Figure 2 as a family of S(E) curves. The extracted best fit values are 1/kD,C = 0.39 (0.15–0.55) ns, 1/kD,90 = 0.02 (0.01–0.03) ns, 1/kT→90 = 1.00 (0.90–1.10) ns, 1/k90→T = 0.89 (0.60–1.50) ns, 1/kC→90 = 0.35 (0.20–0.55) ns, 1/k90→C = 0.09 (0.08–0.30) ns, and α = 0.95 (0.94–0.99) Using lifetimes measured by Ploetz and Lerner et al.11 for Cy3B-ATTO 647N, we also derive: 1/kA = 4.3 ± 0.2 ns and 1/kD,T = 2.2 ± 0.1 ns. A striking observation is the fast de-excitation of Cy3 via the 90° intermediate isomer in comparison to the isomerization rate constants. This observation is not only consistent with the currently accepted models for Cy3 photoisomerization, but also supports the hypothesis that this intermediate does indeed serve as a sink to the excitation energy. PIFE is therefore dominated by a decrease in isomerization yield from the trans isomer. Also note that the fraction of the excited-trans isomer is very high, as expected.
When stepping the BamHI binding site 7, 5, 3, 2, and 1 bp toward Cy3, the stoichiometry S is increased (Figure 2B, purple, blue, green, orange, and red, in that order). This data were globally fit to the PIFE-FRET model (eqs 5–13), while keeping the PIFE parameter (ρ - the fold decrease in isomerization rate) free, and fixing the photophysical rate constants of Cy3. The best fit results (Figure 2, colored lines) report on the dependence of the PIFE effect on the distance of Cy3 from the nearby bound BamHI, which is then explicitly plotted in Figure 3.
Figure 3.

Experimentally and theoretically derived PIFE rulers for BamHI. The experimental (best fit extracted; see Figure 2) PIFE parameter (ρ) and the theoretical normalized (B = 1) accessible volume (ξ) are plotted as a function of bp distance (black and red filled circles) respectively. The theoretical ruler based on the estimation of the accessible volume of Cy3 serves as a lower boundary for the experimental ruler, where specific interactions of the dye with the bound-protein can delay the isomerization from trans isomer even longer.
Figure 3 shows that the experimentally derived ρ linearly depends on the separation between the Cy3 fluorophore and the interaction interface (leading edge) of the BamHI on dsDNA. The theoretically derived30 normalized accessible volume ξ (eq 13) is also plotted on the same graph, showing a linear dependence on distance (until a PIFE separation of 5 bp) when setting the proportionality factor to be B = 1. The experimentally derived PIFE parameter values (Figure 3, black) fit with the theoretical evaluations of the ratio of Cy3 available volumes for PIFE distances 1, 2, and 7 bp away from the binding sequence (Figure 3, red). However, for PIFE distances 3 and 5 bp, the experimentally derived PIFE parameter values are higher than the theoretical estimates of Cy3 ratio of available volumes. Since the theoretical estimation of the PIFE effect shown by eq 13 are derived following the sole effect of steric hindrance and does not provide information on possible specific interactions, the results for PIFE separations 3 and 5 bp may report on specific interactions of Cy3 at these positions with the bound BamHI. The resemblance between the theoretical estimates driven solely by steric hindrance effects and some of the experimentally derived PIFE values supports the notion that PIFE of Cy3 is caused by steric hindrance from the nearby bound protein, which leads to a decrease in isomerization rate. The steric hindrance can be estimated directly from ratios of fluorophore accessible volume calculations performed on DNA in the absence and presence of a protein, given that the crystal structure of the complex is available. This theoretical estimation can act as a lower boundary for the experimental-derived PIFE parameters and allows assessing specific interactions of Cy3 with the bound protein or possible deviations of the binding mode of the protein to the DNA that may occur with the labeled DNA. The best fit of the model to PIFE data results in a S(E) curve with different E and S pair values (Figure 2, colored lines).
To provide a control experiment in which no conformational changes in the DNA duplex are induced by protein binding (observed in FRET), we also reanalyzed published data of unspecific binding of T7 DNA polymerase gp5/trx at different FRET distances.11 The unspecific sliding of the polymerase is so fast that an average PIFE effect is observed instead of multiple distinct PIFE state for different distances of polymerase and Cy3. These PIFE-FRET measurements of gp5/trx on dsDNA represent cases in which binding does induce conformational changes in the dsDNA, with data points that move on the S(E) lines due to the change in E (Figure 4). The comparison between the achieved enhancement factors for gp5/trx with BamHI (Figure 2, ρ = 2.47) clearly points to the different nature of locally involved amino acids. This difference of local environment renders it hence necessary in general, to calibrate the ruler-characteristic of any protein and applied buffer system separately in order to link the measured PIFE enhancement to an actual spatial separation.
Figure 4.

PIFE results for gp5/trx–DNA interaction. ALEX-based PIFE-FRET experimental results (circles) and a global fit using the PIFE model (solid lines). Results for dsDNA labeled with Cy3 and Cy3B as the donor are denoted with filled and open circles, respectively. The acceptor in both cases is ATTO 647N. Control experiments (absence of gp5/trx) are shown in black for 33, 28, 23, 18, 13, and 8 bp. PIFE-FRET results in the presence of gp5/trx for DNA constructs with 28, 23, and 18 bp separation are shown in magenta. gp5/trx is known to slide on DNA,1−3 hence it does not have a known PIFE separation from the bound protein. The best fit value of the PIFE parameter, ρ, to the data, is shown close to the best fit curve (4.14 (3.94–4.36)).
The Relationship between the PIFE Factor ρ and the Fold Increase in QY
In previous works,13−23 PIFE was quantified by the fold increase in Cy3 fluorescence lifetime or intensity (or the related fluorescence QY). Following the above description, we show that this treatment is indirect. The fluorescence quantum yield of Cy3 can be described as the ratio of radiative de-excitations to all de-excitation processes:
| 14 |
This expression assumes that the time it takes to reach steady-state for all isomers is much shorter than the excited-state lifetime. The probability of occupying the trans excited-state isomer is the highest immediately after excitation, and it decreases thereafter. As the best fit results to the model show (Figure 2, black), the isomerization rates are not much different from the excited-state lifetime. We therefore choose not to rely on the steady-state assumption. A temporal definition of the fluorescence QY can be given by considering the weights on isomers’ state occupancy probability:
| 15 |
At each moment after excitation, the Cy3 QY decreases as the population of the excited-state trans isomer decreases, until it reaches a steady-state. The mean QY should therefore be taken into account (Figure 5A). The mean QY can be calculated accurately (Figure 5B, black), but can also be approximated by the asymptote value of the QY curve at the long decay times (Figure 5B, gray). When referring to the PIFE effect as the fold increase in fluorescence QY, we will calculate the term in eq 15 in the absence and presence of steric hindrance and compare the ratio between the two to the PIFE parameter ρ (Figure 5B).
Figure 5.

Fold-decrease in Cy3 mobility and fold-increase in mean fluorescence quantum yield. (A) Time dependence of Cy3 and Cy3B fluorescence quantum yields (following eq 15 in the absence (ρ = 1) and presence ρ = {2,3,4,5,10}) of PIFE. (B) Time averaged ratio (black) and longtime asymptote (gray) of Cy3 QY in the presence and the absence of PIFE for different ρ values, ρ = {2–10}. The parameters used for this simulation are the ones found in the analysis reported above (Figures 2 and 3) for a candidate FRET efficiency of E = 0.4.
The fold increase in the fluorescence QY of Cy3 (either using fluorescence intensities or lifetimes) is the measure that was used to quantify PIFE in previous works.16Figure 5 shows that this measure does not directly report on the fold decrease in isomerization mobility. The nonlinear dependence between the two measures holds even for large values of QY (as in the case of BamHI16). However, note that as the PIFE effect is increasing, one PIFE parameter, the fold-increase in QY, approaches an asymptote, while another PIFE parameter, the fold-decrease in Cy3 isomerization mobility, still increases. The fold-increase in QY reports on PIFE nonlinearly. The fold-decrease in Cy3 isomerization mobility, ρ, however, has a linear dependence on the change in Cy3 accessible volume, and hence on steric hindrance. Therefore, the ρ parameter is a more direct measure of the PIFE effect. We compared our obtained values (Figure 5B) with those reported by Hwang et al.16 through a direct calculation of the fold-increase in fluorescence intensity or fluorescence lifetime, performed on the same DNA constructs in the absence and presence of BamHI16 (Figure S1). This comparison revealed that (1) the intensity-based data found with smPIFE is higher than the ALEX-based PIFE-FRET results using our model with BamHI; (2) the lifetime-based data found with smPIFE is mostly lower or equal to the ALEX-based PIFE-FRET results using our model for BamHI (note the large error values); however (3) the intensity- and lifetime-derived smPIFE data found by Hwang et al. already differ from each other with statistical significance (no intersection of error ranges for both). Most importantly the results of our re-evaluation of the BamHI PIFE experiment using ALEX-based PIFE-FRET with the herein proposed model are in the middle between the intensity- and lifetime-derived smPIFE results, and hence reconcile the two.
The Dynamic Range of ALEX-Based PIFE-FRET
In ALEX-based PIFE-FRET,11,12,43 the mean values of E and S are determined via 2D Gaussian fittings of subpopulations in the E–S histogram. These subpopulations tend to exhibit intrinsic width which depends on shot-noise and other photophysical effects. ALEX-based PIFE-FRET experiments involve measuring separately the Cy3-Acceptor dsDNA in order to characterize the system parameters in the absence of PIFE. In a next step, measurements are taken in the presence of a protein. If the protein binds in close proximity to the Cy3 fluorophore and induces an increase in its fluorescence due to PIFE, the fraction of single DNA molecules bound to the protein will show up as a second S(E) subpopulation. Due to the widths of these subpopulations, it is always better to have the mean E and S of the two well separated.
The best fit results shown in Figure 2 represent the S(E) curves for different values of the PIFE factor. They allow us to observe what will be the dynamic range of changes in the stoichiometry for different nominal FRET efficiency values: the higher the FRET efficiency value is, the smaller the changes in stoichiometry will be. In addition, if a conformational change that increases E is concurrent with protein binding (and PIFE), one should exercise great caution in correctly interpreting the increase in S, since it could be due to increase in E only and vice versa. The region in Figure 2 that is bound by the black Cy3 and Cy3B curves (no protein bound) is the region in which E and S values will report on PIFE either with or without FRET changes.
Conclusions
PIFE is a powerful single molecule spectroscopy technique that provides a distance ruler shorter than FRET but longer than contact-quenching-based rulers, such as photoinduced electron transfer. The combination of PIFE with FRET allows us not only to probe both short and long distances simultaneously, but also to study binding-induced conformational changes in nucleic acids triggered by unlabeled proteins. In this work we have provided a model that allows correct interpretation of PIFE experiments in general and of ALEX-based PIFE-FRET experiments in particular, and elucidated the nonlinear dependence of S on E in a PIFE experiment. We identified steric hindrance (aside from other possible effects such as a specific interaction of the fluorophore with the bound protein) and slowing down of Cy3 isomerization mobility as the main mechanisms responsible for PIFE. The resulting change in the fluorescence QY, the fluorescence lifetime and hence Cy3’s brightness can serve as a signal reporting on PIFE in different implementations of confocal smFRET experiments.12,26,44−47 Given that this assay can be applied for surface immobilized smFRET, the presented work represents a generalized and comprehensive framework for studying protein–nucleic acid interactions in a quantitative manner.
Acknowledgments
We thank Prof. William Gelbart and Prof. Charles Knobler for fruitful discussions. This work was funded by the NIH (GM069709 to SW) and NSF (MCB-1244175 to SW). Further financial support was granted by the Zernike Institute for Advanced Materials at RU Groningen, the Centre for Synthetic Biology at RU Groningen (Start-up grant to T.C.), an ERC Starting Grant (ERC-STG 638536 – SM-Import to T.C.), as well as a Marie-Curie Career Integration Grant (#630992 to J.H.). E.P. acknowledges a DFG fellowship (PL696/2-1).
Supporting Information Available
The Supporting Information is available free of charge on the ACS Publications website at DOI: 10.1021/acs.jpcb.6b03692.
The Supporting Information includes the Appendix where an extended version of the model provided here, is given. This model deals with the possibility of having a flexible doubly labeled macromolecule for which the donor–acceptor distance cannot be considered as rigid, hence FRET rate constant cannot be approximated by a single donor–acceptor distance. (PDF)
Employed Matlab-based scripts (ZIP)
Author Present Address
⊥ (E.P.) Physical Chemistry, Department of Chemistry, Ludwig Maximilians-Universität München, 81377 Munich, Germany
Author Contributions
# (E.L., E.P.) These authors contributed equally.
The authors declare no competing financial interest.
Supplementary Material
References
- Akabayov B.; Akabayov S. R.; Lee S. J.; Tabor S.; Kulczyk A. W.; Richardson C. C. Conformational Dynamics Of Bacteriophage T7 DNA Polymerase And Its Processivity Factor, Escherichia Coli Thioredoxin. Proc. Natl. Acad. Sci. U. S. A. 2010, 107, 15033–15038. 10.1073/pnas.1010141107. [DOI] [PMC free article] [PubMed] [Google Scholar]
- Etson C. M.; Hamdan S. M.; Richardson C. C.; van Oijen A. M. Thioredoxin Suppresses Microscopic Hopping Of T7 DNA Polymerase On Duplex DNA. Proc. Natl. Acad. Sci. U. S. A. 2010, 107, 1900–1905. 10.1073/pnas.0912664107. [DOI] [PMC free article] [PubMed] [Google Scholar]
- Hamdan S. M.; Marintcheva B.; Cook T.; Lee S. J.; Tabor S.; Richardson C. C. A Unique Loop In T7 DNA Polymerase Mediates The Binding Of Helicase-Primase, DNA Binding Protein, And Processivity Factor. Proc. Natl. Acad. Sci. U. S. A. 2005, 102, 5096–5101. 10.1073/pnas.0501637102. [DOI] [PMC free article] [PubMed] [Google Scholar]
- Förster T. Zwischenmolekulare Energiewanderung Und Fluoreszenz. Ann. Phys. 1948, 437, 55–75. 10.1002/andp.19484370105. [DOI] [Google Scholar]
- Stryer L.; Haugland R. P. Energy Transfer - A Spectroscopic Ruler. Proc. Natl. Acad. Sci. U. S. A. 1967, 58, 719–726. 10.1073/pnas.58.2.719. [DOI] [PMC free article] [PubMed] [Google Scholar]
- Jung J.; Han K. Y.; Koh H. R.; Lee J.; Choi Y. M.; Kim C.; Kim S. K. Effect Of Single-Base Mutation On Activity And Folding Of 10–23 Deoxyribozyme Studied By Three-Color Single-Molecule ALEX FRET. J. Phys. Chem. B 2012, 116, 3007–3012. 10.1021/jp2117196. [DOI] [PubMed] [Google Scholar]
- Lee S.; Lee J.; Hohng S. Single-Molecule Three-Color FRET With Both Negligible Spectral Overlap And Long Observation Time. PLoS One 2010, 5, e12270. 10.1371/journal.pone.0012270. [DOI] [PMC free article] [PubMed] [Google Scholar]
- Wallrabe H.; Sun Y.; Fang X.; Periasamy A.; Bloom G. S. Three-Color Confocal Förster (Or Fluorescence) Resonance Energy Transfer Microscopy: Quantitative Analysis Of Protein Interactions In The Nucleation Of Actin Filaments In Live Cells. Cytometry, Part A 2015, 87, 580–588. 10.1002/cyto.a.22651. [DOI] [PMC free article] [PubMed] [Google Scholar]
- Wallrabe H.; Sun Y.; Fang X.; Periasamy A.; Bloom G. Three-Color FRET Expands The Ability To Quantify The Interactions Of Several Proteins Involved In Actin Filament Nucleation. Proc. SPIE 2012, 82260J. 10.1117/12.906432. [DOI] [PMC free article] [PubMed] [Google Scholar]
- Gourse R. L.; Landick R. CoSMoS Unravels Mysteries Of Transcription Initiation. Cell 2012, 148, 635–637. 10.1016/j.cell.2012.01.042. [DOI] [PMC free article] [PubMed] [Google Scholar]
- Ploetz E.; Lerner E.; Husada F.; Roelfes M.; Chung S.; Hohlbein J.; Weiss S.; Cordes T.. Fluorescence Resonance Energy Transfer And Protein-Induced Fluorescence Enhancement As Synergetic Multi-Scale Molecular Rulers. 2016, BioRxiv:biochemistry/047779. BioRXiv.org e-Print archive. http://dx.doi.org/10.1101/047779 (accessed May 13 2016). [DOI] [PMC free article] [PubMed]
- Lee N. K.; Kapanidis A. N.; Wang Y.; Michalet X.; Mukhopadhyay J.; Ebright R. H.; Weiss S. Accurate FRET Measurements Within Single Diffusing Biomolecules Using Alternating-Laser Excitation. Biophys. J. 2005, 88, 2939–2953. 10.1529/biophysj.104.054114. [DOI] [PMC free article] [PubMed] [Google Scholar]
- Morten M. J.; Peregrina J. R.; Figueira-Gonzalez M.; Ackermann K.; Bode B. E.; White M. F.; Penedo J. C. Binding Dynamics Of A Monomeric SSB Protein To DNA: A Single-Molecule Multi-Process Approach. Nucleic Acids Res. 2015, 43, 10907–10924. 10.1093/nar/gkv1225. [DOI] [PMC free article] [PubMed] [Google Scholar]
- Stennett E. M.; Ciuba M. A.; Lin S.; Levitus M. Demystifying PIFE: The Photophysics Behind The Protein-Induced Fluorescence Enhancement Phenomenon In Cy3. J. Phys. Chem. Lett. 2015, 6, 1819–1823. 10.1021/acs.jpclett.5b00613. [DOI] [PubMed] [Google Scholar]
- Hwang H.; Myong S. Protein Induced Fluorescence Enhancement (PIFE) For Probing Protein-Nucleic Acid Interactions. Chem. Soc. Rev. 2014, 43, 1221–1229. 10.1039/C3CS60201J. [DOI] [PMC free article] [PubMed] [Google Scholar]
- Hwang H.; Kim H.; Myong S. Protein Induced Fluorescence Enhancement As A Single Molecule Assay With Short Distance Sensitivity. Proc. Natl. Acad. Sci. U. S. A. 2011, 108, 7414–7418. 10.1073/pnas.1017672108. [DOI] [PMC free article] [PubMed] [Google Scholar]
- Schauer G. D.; Huber K. D.; Leuba S. H.; Sluis-Cremer N. Mechanism Of Allosteric Inhibition Of HIV-1 Reverse Transcriptase Revealed By Single-Molecule And Ensemble Fluorescence. Nucleic Acids Res. 2014, 42, 11687–11696. 10.1093/nar/gku819. [DOI] [PMC free article] [PubMed] [Google Scholar]
- Maxwell B. A.; Suo Z. Single-Molecule Investigation Of Substrate Binding Kinetics And Protein Conformational Dynamics Of A B-family Replicative DNA Polymerase. J. Biol. Chem. 2013, 288, 11590–11600. 10.1074/jbc.M113.459982. [DOI] [PMC free article] [PubMed] [Google Scholar]
- Myong S.; Cui S.; Cornish P. V.; Kirchhofer A.; Gack M. U.; Jung J. U.; Hopfner K. P.; Ha T. Cytosolic Viral Sensor RIG-I Is A 5′-Triphosphate-Dependent Translocase On Double-Stranded RNA. Science 2009, 323, 1070–1074. 10.1126/science.1168352. [DOI] [PMC free article] [PubMed] [Google Scholar]
- Markiewicz R. P.; Vrtis K. B.; Rueda D.; Romano L. J. Single-Molecule Microscopy Reveals New Insights Into Nucleotide Selection By DNA Polymerase I. Nucleic Acids Res. 2012, 40, 7975–7984. 10.1093/nar/gks523. [DOI] [PMC free article] [PubMed] [Google Scholar]
- Marko R. A.; Liu H. W.; Ablenas C. J.; Ehteshami M.; Gotte M.; Cosa G. Binding Kinetics And Affinities Of Heterodimeric Versus Homodimeric HIV-1 Reverse Transcriptase On DNA-DNA Substrates At The Single-Molecule Level. J. Phys. Chem. B 2013, 117, 4560–4567. 10.1021/jp308674g. [DOI] [PubMed] [Google Scholar]
- Craggs T. D.; Hutton R. D.; Brenlla A.; White M. F.; Penedo J. C. Single-Molecule Characterization Of Fen1 And Fen1/PCNA Complexes Acting On Flap Substrates. Nucleic Acids Res. 2014, 42, 1857–1872. 10.1093/nar/gkt1116. [DOI] [PMC free article] [PubMed] [Google Scholar]
- Song D.; Graham T. G. W.; Loparo J. J. A General Approach To Visualize Protein Binding And DNA Conformation Without Protein Labelling. Nat. Commun. 2016, 7, 10976. 10.1038/ncomms10976. [DOI] [PMC free article] [PubMed] [Google Scholar]
- van der Velde J. H. M.; Ploetz E.; Hiermaier M.; Oelerich J.; de Vries J. W.; Roelfes G.; Cordes T. Mechanism Of Intramolecular Photostabilization In Self-Healing Cyanine Fluorophores. ChemPhysChem 2013, 14, 4084–4093. 10.1002/cphc.201300785. [DOI] [PubMed] [Google Scholar]
- Gouridis G.; Schuurman-Wolters G. K.; Ploetz E.; Husada F.; Vietrov R.; de Boer M.; Cordes T.; Poolman B. Conformational Dynamics In Substrate-Binding Domains Influences Transport In The ABC Importer GlnPQ. Nat. Struct. Mol. Biol. 2015, 22, 57–64. 10.1038/nsmb.2929. [DOI] [PubMed] [Google Scholar]
- Kapanidis A. N.; Laurence T. A.; Lee N. K.; Margeat E.; Kong X.; Weiss S. Alternating-Laser Excitation Of Single Molecules. Acc. Chem. Res. 2005, 38, 523–533. 10.1021/ar0401348. [DOI] [PubMed] [Google Scholar]
- Kapanidis A. N.; Lee N. K.; Laurence T. A.; Doose S.; Margeat E.; Weiss S. Fluorescence-Aided Molecule Sorting: Analysis Of Structure And Interactions By Alternating-Laser Excitation Of Single Molecules. Proc. Natl. Acad. Sci. U. S. A. 2004, 101, 8936–8941. 10.1073/pnas.0401690101. [DOI] [PMC free article] [PubMed] [Google Scholar]
- Eggeling C.; Berger S.; Brand L.; Fries J. R.; Schaffer J.; Volkmer A.; Seidel C. A. Data Registration And Selective Single-Molecule Analysis Using Multi-Parameter Fluorescence Detection. J. Biotechnol. 2001, 86, 163–180. 10.1016/S0168-1656(00)00412-0. [DOI] [PubMed] [Google Scholar]
- Nir E.; Michalet X.; Hamadani K. M.; Laurence T. A.; Neuhauser D.; Kovchegov Y.; Weiss S. Shot-Noise Limited Single-Molecule FRET Histograms: Comparison Between Theory And Experiments. J. Phys. Chem. B 2006, 110, 22103–22124. 10.1021/jp063483n. [DOI] [PMC free article] [PubMed] [Google Scholar]
- Sindbert S.; Kalinin S.; Nguyen H.; Kienzler A.; Clima L.; Bannwarth W.; Appel B.; Müller S.; Seidel C. A. Accurate Distance Determination Of Nucleic Acids Via Förster Resonance Energy Transfer: Implications Of Dye Linker Length And Rigidity. J. Am. Chem. Soc. 2011, 133, 2463–2480. 10.1021/ja105725e. [DOI] [PubMed] [Google Scholar]
- Viadiu H.; Aggarwal A. K. The Role Of Metals In Catalysis By The Restriction Endonuclease BamHI. Nat. Struct. Biol. 1998, 5, 910–916. 10.1038/2352. [DOI] [PubMed] [Google Scholar]
- Thompson A. J.; Herling T. W.; Kubankova M.; Vysniauskas A.; Knowles T. P. J.; Kuimova M. K. Molecular Rotors Provide Insights Into Microscopic Structural Changes During Protein Aggregation. J. Phys. Chem. B 2015, 119, 10170–10179. 10.1021/acs.jpcb.5b05099. [DOI] [PubMed] [Google Scholar]
- Thompson A. J.; Tang T. Y. D.; Herling T. W.; Che Hak C. R.; Mann S.; Knowles T. P. J.; Kuimova M. K. Quantitative Sensing Of Microviscosity In Protocells And Amyloid Materials Using Fluorescence Lifetime Imaging Of Molecular Rotors. Proc. SPIE 2014, 89471C. 10.1117/12.2037851. [DOI] [Google Scholar]
- Jia K.; Wan Y.; Xia A.; Li S.; Gong F.; Yang G. Characterization Of Photoinduced Isomerization And Intersystem Crossing Of The Cyanine Dye Cy3. J. Phys. Chem. A 2007, 111, 1593–1597. 10.1021/jp067843i. [DOI] [PubMed] [Google Scholar]
- Lee W.; von Hippel P. H.; Marcus A. H. Internally Labeled Cy3/Cy5 DNA Constructs Show Greatly Enhanced Photo-Stability In Single-Molecule FRET Experiments. Nucleic Acids Res. 2014, 42, 5967–5977. 10.1093/nar/gku199. [DOI] [PMC free article] [PubMed] [Google Scholar]
- Sanborn M. E.; Connolly B. K.; Gurunathan K.; Levitus M. Fluorescence Properties And Photophysics Of The Sulfoindocyanine Cy3 Linked Covalently To DNA. J. Phys. Chem. B 2007, 111, 11064–11074. 10.1021/jp072912u. [DOI] [PubMed] [Google Scholar]
- Stennett E. M.; Ma N.; van der Vaart A.; Levitus M. Photophysical And Dynamical Properties Of Doubly Linked Cy3-DNA Constructs. J. Phys. Chem. B 2014, 118, 152–163. 10.1021/jp410976p. [DOI] [PubMed] [Google Scholar]
- Spiriti J.; Binder J. K.; Levitus M.; van der Vaart A. Cy3-DNA Stacking Interactions Strongly Depend On The Identity Of The Terminal Basepair. Biophys. J. 2011, 100, 1049–1057. 10.1016/j.bpj.2011.01.014. [DOI] [PMC free article] [PubMed] [Google Scholar]
- Ray K.; Ma J.; Oram M.; Lakowicz J. R.; Black L. W. Single-Molecule And FRET Fluorescence Correlation Spectroscopy Analyses Of Phage DNA Packaging: Colocalization Of Packaged Phage T4 DNA Ends Within The Capsid. J. Mol. Biol. 2010, 395, 1102–1113. 10.1016/j.jmb.2009.11.067. [DOI] [PMC free article] [PubMed] [Google Scholar]
- Eis P. S.; Millar D. P. Conformational Distributions Of A Four-Way DNA Junction Revealed By Time-Resolved Fluorescence Resonance Energy Transfer. Biochemistry 1993, 32, 13852–13860. 10.1021/bi00213a014. [DOI] [PubMed] [Google Scholar]
- Wang X.; Vukovic L.; Koh H. R.; Schulten K.; Myong S. Dynamic Profiling Of Double-Stranded RNA Binding Proteins. Nucleic Acids Res. 2015, 43, 7566–7576. 10.1093/nar/gkv726. [DOI] [PMC free article] [PubMed] [Google Scholar]
- Lopezquintela M. A.; Samios J.; Knoche W. Steric Hindrance Of Diffusion Controlled Reactions. J. Mol. Liq. 1984, 29, 243–261. 10.1016/0167-7322(84)80053-7. [DOI] [Google Scholar]
- Hohlbein J.; Craggs T. D.; Cordes T. Alternating-Laser Excitation: Single-Molecule FRET And Beyond. Chem. Soc. Rev. 2014, 43, 1156–1171. 10.1039/C3CS60233H. [DOI] [PubMed] [Google Scholar]
- Lee N. K.; Kapanidis A. N.; Koh H. R.; Korlann Y.; Ho S. O.; Kim Y.; Gassman N.; Kim S. K.; Weiss S. Three-Color Alternating-Laser Excitation Of Single Molecules: Monitoring Multiple Interactions And Distances. Biophys. J. 2007, 92, 303–312. 10.1529/biophysj.106.093211. [DOI] [PMC free article] [PubMed] [Google Scholar]
- Yim S. W.; Kim T.; Laurence T. A.; Partono S.; Kim D.; Kim Y.; Weiss S.; Reitmair A. Four-Color Alternating-Laser Excitation Single-Molecule Fluorescence Spectroscopy For Next-Generation Biodetection Assays. Clin. Chem. 2012, 58, 707–716. 10.1373/clinchem.2011.176958. [DOI] [PMC free article] [PubMed] [Google Scholar]
- Müller B. K.; Zaychikov E.; Bräuchle C.; Lamb D. C. Pulsed Interleaved Excitation. Biophys. J. 2005, 89, 3508–3522. 10.1529/biophysj.105.064766. [DOI] [PMC free article] [PubMed] [Google Scholar]
- Kudryavtsev V.; Sikor M.; Kalinin S.; Mokranjac D.; Seidel C. A.; Lamb D. C. Combining MFD And PIE For Accurate Single-Pair Förster Resonance Energy Transfer Measurements. ChemPhysChem 2012, 13, 1060–1078. 10.1002/cphc.201100822. [DOI] [PubMed] [Google Scholar]
Associated Data
This section collects any data citations, data availability statements, or supplementary materials included in this article.