

See Tracey (doi:10.1093/brain/aww147) for a scientific commentary on this article.
Why some individuals progress from acute to chronic pain is unclear. Vachon-Presseau et al. monitor patients with subacute pain for three years, and show that pre-existing structural and functional connectivity within dorsal mPFC-amygdala-accumbens corticolimbic circuitry, as well as amygdala and hippocampal volumes, represent risk factors for transition to chronic pain.
Keywords: chronic pain, brain network, limbic system, magnetic resonance imaging (MRI), diffusion tensor imaging (DTI)

See Tracey (doi:10.1093/brain/aww147) for a scientific commentary on this article.
Why some individuals progress from acute to chronic pain is unclear. Vachon-Presseau et al. monitor patients with subacute pain for three years, and show that pre-existing structural and functional connectivity within dorsal mPFC-amygdala-accumbens corticolimbic circuitry, as well as amygdala and hippocampal volumes, represent risk factors for transition to chronic pain.
Abstract
See Tracey (doi:10.1093/brain/aww147) for a scientific commentary on this article.
Mechanisms of chronic pain remain poorly understood. We tracked brain properties in subacute back pain patients longitudinally for 3 years as they either recovered from or transitioned to chronic pain. Whole-brain comparisons indicated corticolimbic, but not pain-related circuitry, white matter connections predisposed patients to chronic pain. Intra-corticolimbic white matter connectivity analysis identified three segregated communities: dorsal medial prefrontal cortex–amygdala–accumbens, ventral medial prefrontal cortex–amygdala, and orbitofrontal cortex–amygdala–hippocampus. Higher incidence of white matter and functional connections within the dorsal medial prefrontal cortex–amygdala–accumbens circuit, as well as smaller amygdala volume, represented independent risk factors, together accounting for 60% of the variance for pain persistence. Opioid gene polymorphisms and negative mood contributed indirectly through corticolimbic anatomical factors, to risk for chronic pain. Our results imply that persistence of chronic pain is predetermined by corticolimbic neuroanatomical factors.
Introduction
Chronic pain is a state of continued negative emotional suffering representing a leading source of worldwide disability (Murray and Lopez, 2013) with a staggeringly high healthcare cost (Medicine, 2011). Risk factors for developing chronic pain remain poorly understood, yet its negative emotional valence implicates the involvement of limbic circuitry. In fact, both Maclean’s (1955) original formulation of the limbic brain and Melzack and Casey’s (1968) concept of the gate control theory of pain (Melzack and Wall, 1965) hypothesized that the limbic brain plays an integral role in pain states. Consistently, long-standing clinical evidence has demonstrated that injury to limbic structures diminishes the emotional overtones of pain (Raz, 2009). However, only recent human neuroimaging (Apkarian et al., 2004; Baliki et al., 2006, 2010, 2012; Geha et al., 2008; Hashmi et al., 2013; Mansour et al., 2013; Mutso et al., 2014) and complementary animal model (Neugebauer et al., 2003; Metz et al., 2009; Ji and Neugebauer, 2011; Ren et al., 2011; Mutso et al., 2012; Baliki et al., 2014; Chang et al., 2014; Schwartz et al., 2014) studies have begun to unravel the role of limbic brain properties in chronic pain.
In the present study, we focus on intrinsic properties of the corticolimbic portion of the mesocorticolimbic system. A network comprised of the prefrontal cortex (PFC) (medial and orbital cortices), nucleus accumbens, hippocampus/parahippocampus, and amygdala. Collectively, these structures support emotion, behaviour, motivation and memory functions. Converging evidence reinforces the idea that components of this circuitry are important for chronic pain. In humans, the nucleus accumbens encodes salience of impending pain and the reward value of analgesia, which is distorted in chronic back pain (Baliki et al., 2010), and functional connectivity between nucleus accumbens and medial PFC prospectively predicts chronification of pain (Baliki et al., 2012). Prefrontal cortical activity reflects subjective reports of back pain intensity in patients with chronic back pain (Baliki et al., 2006; Hashmi et al., 2013) and is thought to regulate the meaning of affective responses and influence emotional decision-making. Furthermore, the size of the amygdala and hippocampus show strong genetic dependences (Hibar et al., 2015) and both structures are implicated in emotional learning (Phelps and LeDoux, 2005), anxiety (Russo et al., 2012), and stress regulation (Vachon-Presseau et al., 2013), and exhibit changes in activity and functional connectivity during the transition to chronic pain (Mutso et al., 2012; Hashmi et al., 2013). Comparative evidence further bolsters corticolimbic involvement in chronic pain by demonstrating that single neuron morphology, excitability, and short- or long-term potentiation are distorted within and across the hippocampus (Ren et al., 2011; Mutso et al., 2012), amygdala (Neugebauer et al., 2003; Ji and Neugebauer, 2011), nucleus accumbens (Chang et al., 2014; Schwartz et al., 2014), and PFC (Metz et al., 2009; Ji and Neugebauer, 2011). Consistently, the persistence of pain-like behaviours in rodents is accompanied by a reorganization of resting state connectivity primarily across limbic brain structures (Baliki et al., 2014). Despite this compelling evidence, a comprehensive examination of corticolimbic brain contributions to chronic pain remains to be undertaken. Here we interrogate the functional and anatomical properties of the corticolimbic neural network, and its subcircuits, to unravel the interrelationships between change in pain intensity, negative emotion, and their potential genetic mediators. We report the novel finding that anatomical characteristics of specific networks and structures of the corticolimbic system predetermine risk for developing chronic pain.
Materials and methods
Additional information regarding whole brain region of interest parcellation schemes, pain and corticolimbic nodes, corticolimbic parcellation, modularity analyses of limbic structural network, and genetic analyses can be found in the Supplementary material.
Participants
The data presented are from a longitudinal observational study where we followed patients with subacute back pain (SBP) over 3 years. This report is based on the final total sample of patients. Portions of the data were used in previous publications (Baliki et al., 2012; Hashmi et al., 2013; Mansour et al., 2013; Petre et al., 2015). The study recruited 159 patients with SBP and 29 healthy control subjects. All patients with SBP were diagnosed by a clinician for back pain and reported pain intensity greater than 40/100 on a visual analogue scale (VAS, 0–100, where 100 = maximum imaginable pain and 0 = no pain) prior to enrolling in the study. Patients with SBP were recruited only if the duration of their pain was between 4–16 weeks with no back pain reported during the previous 12 months. Subjects were excluded if they reported other chronic painful conditions, systemic disease, psychiatric diseases, or history of head injuries. Subjects were also excluded if they reported high depression, which was defined as scores >19 using the Beck’s Depression Inventory (BDI) (Beck et al., 1961). From these participants, 69 SBP (34 females, 43.1 ± 10.4 years of age) and 20 healthy controls (nine females, 37.4 ± 7.5 years of age) completed the study to 1-year follow-up. These patients with SBP were dichotomized into groups with persisting pain (SBPp; n = 39) or recovery from pain at the end of the year (with recovery operationalized as 20% reduction in pain from Week 0 to Week 56; SBPr n = 30). A subsample of 39 patients with SBP (18 females, 44.2 ± 11.3 years of age) was followed for an additional visit at 3 years from pain onset. Dates of visits are shown for all subjects in Supplementary Fig. 1. The Institutional Review Board of Northwestern University approved the study and all participants signed a consent form.
Additional groups of patients and healthy controls were used to cross-sectionally examine subcortical limbic volumes: 23 with chronic back pain (nine females, 46.6 ± 6.0 years of age), 40 osteoarthritis patients (22 females, 58.6 ± 7.6 years of age), and 20 healthy age-matched controls (10 females, 57.9 ± 6.7 years of age).
Pain characteristics, depressive mood, and negative affect
Pain intensity was measured using the visual analogue scale (VAS) from the short version of the McGill Pain Questionnaire (Melzack, 1975) and disability was assessed using the Pain Disability Index (PDI) measuring the degree at which chronic pain disrupts aspects of the patients’ lives (Tait et al., 1990). Negative affect was calculated with the negative scale of the Positive and Negative Affectivity Scale (PANAS). This scale consists of a series of items describing different emotions experienced over the previous week (Watson and Clark, 1999). Depressive mood was assessed using BDI-1b. All questionnaires were given within an hour before brain scanning. Summary results for pain characteristics, depressive mood and negative affect are presented in Supplementary Table 1.
Scanning parameters
Anatomical (T1), diffusion tensor imaging (DTI), and functional MRI were collected in the same scanning session. High-resolution T1-anatomical brain images were acquired with a 3 T Siemens Trio whole-body scanner with echo-planar imaging capability using the standard radio-frequency head coil using the following parameters: voxel size = 1 × 1 × 1 mm, repetition time = 2.50 ms, echo time = 3.36 ms, flip angle = 9°, in-plane matrix resolution = 256 × 256; 160 slices, field of view = 256 mm.
Functional MRI images were acquired using the following parameters: multi-slice T2*-weighted echo-planar images with repetition time = 2.5 s, echo time = 30 ms, flip angle = 90°, number of volumes = 244, slice thickness = 3 mm, in plane resolution = 64 × 64. The 36 slices covered the whole brain from the cerebellum to the vertex.
DTI images were acquired using echo planar imaging (72 × 2-mm thick axial slices; matrix size = 128 × 128; field of view = 256 × 256 mm2, resulting in a voxel size of 2 × 2 × 2 mm). Images had an isotropic distribution along 60 directions using a b-value of 1000 s/mm2. For each set of diffusion-weighted data, eight volumes with no diffusion weighting were acquired at equidistant points throughout the acquisition.
Morphometric analyses of subcortical structures
Structural data were analysed with the standard automated processing stream of FSL 4.1 that shows very high reliability across labs (Nugent et al., 2013). The analysis entailed skull extraction, a two-stage linear subcortical registration, and segmentation using FMRIB’s Integrated Registration and Segmentation Tool (FIRST). The volumes of right and left nucleus accumbens, amygdala, hippocampus, and thalamus were calculated for each subject. Group comparisons were performed using repeated analyses of covariance with volume as the dependent factor, time of the scan and hemisphere as within-subject factors, the group as a between-subject factor (SBPp, SBPr, and healthy), and age, sex and total grey matter volume [estimated using FSL SIENAX (Smith et al., 2002)] as covariates of no interest. Post hoc comparisons were Bonferroni corrected for multiple comparisons.
From the initial 89 participants, nine were excluded because T1 was missing or because of quality control failure of the T1 image at one of the four visits. Quality control included: (i) visual inspection of the subcortical segmentation, where gross mismatches between underlying anatomy and FIRST outcome were excluded; and (ii) large deviations from the mean volume of a given structure were also excluded [greater than ±2 standard deviations (SD)]. Outliers were identified independently for hippocampus and amygdala volumes. From a total of 80 subjects, 11 were rejected from the amygdala analyses and four were rejected from the hippocampus analyses. Importantly, removing these individuals did not change the overall statistical outcomes of our results. Our subsample of patients scanned a fifth time at Week 156 included 33 patients with accurate segmentation of subcortical structures.
Differences between SBPp and SBPr in amygdala and hippocampus volumes, initially discovered using FSL, were replicated using the standard automated cortical and subcortical segmentations by Freesurfer 5.0 (http://surfer.nmr.mgh.harvard.edu/). The procedure includes motion correction, removal of the skull using watershed/surface deformation procedure, normalization in Talairach space, and segmentation of the subcortical structures based on the existing atlas containing probabilistic information on the location of structures (Fischl et al., 2002).
As hippocampus and amygdala exhibited significant group differences, we investigated whether these changes can be attributed to localized structural deformations. Vertex representation of both structures were therefore generated using FIRST (Patenaude et al., 2011). The model uses a Bayesian approach representing the structure in 3D from meshes fitting the form of the subcortical structure to a training dataset that was manually segmented. The shapes of the subcortical structures were represented from meshes parameterized by the coordinates of their vertices. A multivariate permutation test on the 3D coordinates of corresponding vertices provide the F-values representing group differences (SBPp and SBPr). Group differences in vertex localized at the boundary provided a geometric change shape of the amygdala and the hippocampus. No corrections for multiple comparisons were performed on these analyses.
Diffusion tensor imaging preprocessing
FAST (FMRIB Automated Segmentation Tool) was used to segment the 3D T1 image of the brain into different tissue types (grey matter, white matter, and CSF) while also correcting for spatial intensity variations (Supplementary material). For each subject, the grey matter and white matter masks were transformed into standard space using FSL linear registration tool (FLIRT). Those masks were then thresholded (probability > 0.25) and multiplied with each other, yielding a subject specific grey–white matter interface composed of regions having relatively equal probabilities of being in either category, thus constituting the grey–white matter boundary. Probabilistic tractography of the whole brain networks were constructed from voxels composing this grey–white matter boundary.
Analysis was performed using tools from the FMRIB Diffusion Toolbox (FDT; Behrens et al., 2003) and in-house software. DTI data were manually checked for obvious artefacts. Eddy current correction was used and simple head motion correction using affine registration to a no-diffusion reference volume for each participant. Data were then skull extracted (BET) and a diffusion tensor model was fit at each voxel determining voxel-wise fractional anisotropy. Bayesian Estimation of Diffusion Parameters Obtained using Sampling Techniques (BEDPOSTX) and probabilistic tractography (PROBTRACX) modelling two fibre tracks per voxel were used to determine the probability of connection between regions (Behrens et al., 2007). Voxel-wise principal diffusion directions were used to repetitively compute a probabilistic streamline from 5000 samples to generate posterior distribution on the ‘connectivity distribution’. Probabilistic tractography was performed in the diffusion space of each participant and then transformed to MNI space using FSL linear registration (FLIRT; Jenkinson et al., 2002). The connectivity distribution was averaged across voxels of each of the 264 and 480 regions of interest (Supplementary Fig. 3) for whole brain network analyses or across voxels of the subsample in 4 × 4 × 4 mm for the corticolimbic network analyses (1068 regions of interest; Supplementary Fig. 4). From the 89 participants, 15 were excluded because DTI images were missing at one of the four visits or because of quality control failure. From the remaining 74 patients, two patients were further excluded from the limbic network analyses because they showed connectivity counts in the dorsal medial PFC–amygdala–nucleus accumbens >3 SD from the group mean. Diffusion scans were collected in 36 patients out of the subsample of patients scanned a fifth time at Week 156.
Functional MRI preprocessing
Ten minutes of functional MRI were acquired at each visit of the study, where subjects rated spontaneous fluctuations of their pain. These data were used to examine intrinsic brain connectivity differences between groups (SBPp and SBPr). The preprocessing of each subject’s time series of functional MRI volumes was performed using the FMRIB Expert Analysis Tool (FEAT). The sequence included skull extraction using BET from FSL, slice time correction, and motion correction (Jenkinson et al., 2002). Temporal filtering between 0.01 and 0.1 Hz was applied on the blood oxygenation level-dependent (BOLD) time series. The six parameters of head motion, global mean signal measured over all voxels of the brain, the signal from a ventricular region of interest, and the signal from a region centred in the white matter were regressed as covariates of no interest from the BOLD time series. The first four volumes were removed for signal stabilization. After preprocessing, functional scans were registered into a standard MNI space using FSL FLIRT. From the 69 patients that rated their spontaneous pain fluctuations, seven were excluded because of missing functional scans at one of the four visits. Our subsample of patients scanned a fifth time at Week 156 included 34 patients with functional scans.
Construction of white matter networks
Whole brain DTI-based connectivity networks for the 480 regions of interest for SBPp and SBPr at Week 0 were constructed using methods described in (Rubinov and Sporns, 2010). For all regions of interest, the connection probability between a seed region of interest and any target region of interest in the brain is defined as the sum of sample fibre lengths connecting these two regions of interest. For each subject, a 480 × 480 and a 264 × 264-weighted directed matrices were generated from connection probabilities for all seed regions of interest with the number of target regions of interest. The resultant matrices were then symmetrized and adjusted for distance constraints by multiplication with Euclidean distance matrix. Finally, the matrix was thresholded at a value that yielded a binary undirected network of different link densities ranging from 0.02 to 0.20 (i.e. the top 2–20% of connections were assigned a value of 1, whereas the rest of the connections were assigned a value of 0; Supplementary Fig. 6). Group differences (SBPp and SBPr) in edges connecting nodes of the network were initially determined using permutation test controlling for family-wise error rate using Network Based Statistics (NBS; Zalesky et al., 2010). Corticolimbic white matter networks formed between 1068 × 1068 nodes were generated for all subjects (SBPp, SBPr and healthy controls), at each of the five visits using the same methods.
Construction of functional brain networks
To construct the limbic functional connectivity networks for each subject, we first computed the Pearson correlation coefficient (r) for the all possible pairs of the n = 1068 of cortical and subcortical limbic regions of interest time series from the preprocessed resting state functional MRI data. Similar to white matter networks, threshold was calculated to produce a fixed number of connections across link densities ranging from 0.02 to 0.20 (top 2–20% of r-values binarized), for each subject (Achard et al., 2012). The values of the threshold are therefore subject-dependent but the number of connections in the network is the same for every subject. The density of structural connections was examined with respect to the community-based organization of the white matter network. Therefore, group differences (SBPp and SBPr) in functional connectivity within and across modules determined from white matter tractography were tested using repeated measure ANOVAs entering the visits as repeated variable.
Genetic association with mesolimbic brain outcome measures
To test the idea that some of the mesolimbic brain properties associated with risk of chronic pain may underlie a genetic predisposition, we looked for associations between single nucleotide polymorphisms (SNPs) and limbic brain properties. Saliva samples were collected from all subjects who completed the study. Given the limited number of subjects in the study we decided to only examine 30 SNPs. The choice of SNPs was determined prior to having knowledge regarding the primary functional or anatomical determinants of risk for chronic pain. The 30 candidate SNPs located in 12 different genes were selected for their known involvement in neurotransmitters, receptors and metabolites associated with corticolimbic structures, and also for being related to pain or nociception. Only one gene was selected as a marker for peripheral encoding of nociception, SCN9A. A description of each gene is presented in Supplementary Table 8. Genetic analysis was done independently and with no knowledge of the results of brain analyses. Four brain outcome parameters were tested for association with the 30 selected SNPs. SNPs that passed statistical threshold (or were borderline significant) after Bonferroni multiple comparison correction were also tested for discrimination between SBPp and SBPr.
Statistical analyses
Path analyses and multiple regression models
Path analysis was used to examine the direct and mediating links between multiple variables to test a given theoretical model empirically, specifically testing the prediction for SBP grouping at Week 56 using a logistic regression model. Path analyses were performed with Mplus 7.3 using the robust weighted least squares estimator method accounting for the non-normality of the data. We calculated 95% confidence intervals for the indirect effect using a recommended bias-corrected bootstrapped method (bootstrap of 1000 iterations; Mackinnon et al., 2004); we rejected the null hypothesis when the 95% confidence interval did not contain zero.
Results
This report presents the complete results of a longitudinal study. Patients recruited while in subacute back pain were followed over the course of 1 year (n = 69 patients with SBP), with a smaller subset followed for 3 years (n = 39). Thirty-nine patients with SBP were dichotomized into persisting pain (SBPp) and 30 SBP were dichotomized into recovery from pain as they showed 20% reduction in pain intensity between Week 0 and Week 56 (SBPr). Classification of patients with SBP at 3 years was also based on the Week 56 criterion (SBPp n = 23, SBPr n = 16). Group differences in pain intensity and disability were observed as early as 8 weeks after entry into the study and maintained temporal stability up to 3 years after back pain onset (Fig. 1B). Over 3 years, no changes were observed in negative psychological traits for SBPp or SBPr (Supplementary Table 1), and medication use was not different between SBP groups (Supplementary Fig. 2).
Figure 1.

Whole-brain structural connectivity identifies corticolimbic regions conferring risk for chronic pain. (A) Timeline of brain scans and type and number of subjects studied. (B) Recovering (SBPr) and persisting (SBPp) patients were dichotomized based on 20% reduction in back pain intensity at Week 56. The two groups showed time-dependent divergence (Weeks 0–56) in pain intensity [F(2.52, 140.92); P < 0.001 repeated measure ANOVA] and pain disability [F(2.58, 110.74) = 3.44; P = 0.025 repeated measure ANOVA], sustained in the 3-year subsamples [Week 156 pain intensity t(1,33) = 3.67; P = 0.001; pain disability t(1,36) = 3.28; P = 0.002 two-sided unpaired t-tests]. *P < 0.05 between group comparison; +P < 0.05 within group comparison relative to Week 0. (C) Structural white matter-based networks were constructed from probabilistic tractography between nodes covering the whole brain. (D and F) Group comparison at link density of 0.1 at Week 0 was studied from network constructed from 480 and 264 parcellation schemes. In both networks SBPp show more white matter connections between corticolimbic nodes (P < 0.05, FDR corrected). (E) In 480-parcellation, location and number of nodes within pain and corticolimbic systems are illustrated. The SBPp > SBPr contrast indicates denser structural connections in SBPp across corticolimbic nodes, but not for pain-related nodes, for all link densities. Observed incidence of connections compared to expected incidence in a random network was significantly higher for corticolimbic nodes (chi-square test, P < 0.0001 for all link densities) but not for pain-related nodes (P > 0.28 for all link densities). Histogram is the cumulative probability (total connectivity = 1.0) for corticolimbic nodes and pain-related nodes compared to expected connectivity in a random network, averaged for all densities. (G) Concordant results were observed in 264-parcellation. Observed incidence of connections in SBPp was much higher than expected across corticolimbic nodes (chi-square test, P < 0.0001 for all link densities) but not for pain-related nodes (P > 0.28 for all link densities). Number of subjects is shown in parentheses. Error bars indicate SEM.
Whole-brain white matter connectivity
We used DTI probabilistic tractography-based structural connectivity at study entry to identify brain areas for which differences in white matter connectivity conferred greater risk for chronic pain. The DTI scans at study entry (10.8 ± 5.5 weeks from onset of back pain) were used to construct whole-brain structural networks (Supplementary Fig. 3) from different parcellation schemes of 480 and 264 regions (Fig. 1C and Supplementary Fig. 6). Permutation tests were used to identify group differences in the incidence of connections, for each parcellation scheme, across link densities ranging from 0.02 to 0.2. Example group contrast results (SBPp > SBPr, and SBPr > SBPp; Supplementary Tables 3 and 4) for both parcellations, at 0.1 link density, are illustrated in Fig. 1D and E. Connections were denser in SBPp and mostly localized across corticolimbic nodes (Supplementary Tables 5 and 6). In addition to corticolimbic nodes, we also identified nodes related to pain perception using a term-based meta-analysis tool (based on a map derived for ‘pain’ from 420 PubMed publications; www.neurosynth.org). Group differences in structural connections were localized outside pain-related nodes. Instead, the likelihood for denser connections in SBPp, compared to SBPr, was consistently higher within the corticolimbic brain compared to random networks (Fig. 1F and G). Collectively, these analyses indicate that structural connections between regions involved in pain processing were not involved in the development of chronic pain. In contrast, denser white matter connections were observed between nodes concentrated within the corticolimbic system, implying that these connections were more likely to predispose individuals to transition to chronic pain.
Corticolimbic modules contribute to risk for chronic pain
The identification of dense corticolimbic white matter connections does not provide information about underlying anatomical and functional properties of this system that may impart risk for chronic pain. Therefore, we next interrogated the intrinsic structural and functional network organization of the corticolimbic brain throughout the 3 years of observation, using higher spatial resolution data. Anatomical networks were first constructed from connections between 1068 nodes (4 × 4 × 4 mm voxels) belonging to the corticolimbic system (nucleus accumbens, amygdala, hippocampus-parahippocampus, and the prefrontal cortex) (Fig. 2A and Supplementary Fig. 4). Edges between the nodes were drawn from DTI-based probabilistic white matter tractography and from Pearson correlations between functional MRI time series (i.e. functional connections derived from functional MRI activity as patients rated back pain intensity). The structural (white matter network) and functional (functional connectivity network) graphs were constructed by binarizing the networks across different densities ranging from 0.02 to 0.20 (Supplementary Fig. 6). Derived networks were tested and confirmed to be insensitive to standard confounds (Supplementary Fig. 5).
Figure 2.

Intra-corticolimbic white matter connectivity identifies three modules, only the dorsal medial PFC–amygdala–nucleus accumbens module imparts risk for chronic pain. (A) Display of the intra-corticolimbic white matter-based structural networks generated from 1068 nodes (white matter networks) at 0.1 link density. (B) Modularity analysis performed on this network separated the system into three communities: (i) dorsal medial PFC–amygdala–nucleus accumbens (mPFCdorsal-amy-NAc); (ii) ventral medial PFC–amygdala (mPFCventral-Amy); and (iii) orbitofrontal cortex–amygdala–hippocampus (OFC-amy-hipp). (C) Normalized mutual information was used to quantify similarity between individual subject community structure and the mean group community structure presented in (B) SBPp, SBPr and healthy controls displayed similar modular organization across all time points, due to absence of group differences [F(2,69) = 2.34; P = 0.10 repeated measure ANOVA] or a time × group interaction [F(5.73, 200.65) = 0.72; P = 0.63 repeated measure ANOVA]. (D) Structural connection probability for SBPp, SBPr and healthy within the dorsal medial PFC–amygdala–nucleus accumbens module calculated across link densities ranging between 0.02 and 0.2. Incidence of white matter connections was higher in SBPp at all densities [F(2,78) = 6.10; P = 0.003 repeated measure ANOVA]. The histogram displays group differences at 0.1 link density. (E) Per cent structural connections for SBPp and SBPr and healthy controls over 3 years at 0.1 link density. Incidence of connections in the dorsal medial PFC–amygdala–nucleus accumbens module was higher in SBPp [F(2,69) = 4.74; P = 0.012 repeated measure ANOVA] for visits 0–56 weeks. Concordant results were seen at Week 156 [t(1,34) = 1.79; P = 0.08 two-sided unpaired t-tests]. Scatterplot shows 3-year stability of dorsal medial PFC–amygdala–nucleus accumbens module connectivity for all SBP. (F) Incidence of functional connections in the dorsal medial PFC–amygdala–nucleus accumbens module was higher in SBPp across 0.02 to 0.2 link densities [F(1,60) = 4.00; P = 0.05]. The histogram displays group differences at 0.1 link density. (G) SBPp showed higher incidence of functional connections in the dorsal medial PFC–amygdala–nucleus accumbens module [F(1,60) = 8.00; P = 0.006 repeated measure ANOVA], for visits 0–56 weeks at 0.1 link density. This functional connectivity, however, was not different between SBPp and SBPr subsamples at Week 156, and the scatter plot showed no within subject relationship between Weeks 0 and 156 functional connections. *P < 0.05 post hoc comparisons between SBPp and SBPp. &P = 0.08. Number of subjects is shown in parentheses. Error bars indicate standard error of the mean (SEM).
We first studied the architecture of the limbic white matter network (Fig. 2A). This fine-grained, voxel-based, intra-limbic probabilistic tractography-based white matter network revealed dense, bilateral connections of subcortical structures with each other and with the prefrontal cortex. Modularity analysis revealed that this network was composed of three distinct communities, including modules composed of (i) dorsal and medial portion of PFC, medial-inferior part of the amygdala, and most of the nucleus accumbens (dorsal medial PFC–amygdala–nucleus accumbens); (ii) most of the ventral medial frontal cortex (ventral medial PFC) and medial-superior part of the amygdala (ventral medial PFC–amygdala); and (iii) a thin layer of orbital cortex linked to lateral amygdala and most of hippocampus (orbitofrontal cortex–amygdala–hippocampus) (Fig. 2B). The stability of the community structure was preserved across different clustering thresholds (Supplementary Fig. 7). Note that our results are consistent with the anatomical subdivisions of the amygdala, based on meta-analytic functional co-activation maps of the amygdala with the rest of the brain, which also show a close correspondence to the region’s cytoarchitectonic subdivisions (Bzdok et al., 2013) (Supplementary Fig. 8).
We next studied group differences and temporal variability in density of intra-limbic white matter and functional connectivity networks, both within and between the three corticolimbic circuits. Although white matter network modular organization was common across SBPr, SBPp and healthy individuals (Fig. 2C), SBPp consistently displayed a greater frequency of white matter connections within the dorsal medial PFC–amygdala–nucleus accumbens module across all link densities (Fig. 2D), across the four visits (Fig. 2E) and 3 years after pain onset (Fig. 2E). The white matter networks of ventral medial PFC–amygdala and orbitofrontal cortex–amygdala–hippocampus modules did not differ between SBP groups (Supplementary Fig. 9A). The dorsal medial PFC–amygdala–nucleus accumbens white matter network was stable over 3 years because individual SBP values were strongly correlated between Week 0 and Week 156 for all SBP (Fig. 2E). This finding is consistent with and generalizes from a previous report that white matter regional fractional anisotropy distinguishes between SBP groups (based on a subsample of the current cohort; Mansour et al., 2013).
Examining the functional connectivity network connections in each one of the modules, defined in Fig. 2B, showed that SBPp displayed higher incidence of connections within the dorsal medial PFC–amygdala–nucleus accumbens module at all densities (Fig. 2F), at all four visits (Fig. 2G), a finding that expands on our previous report of stronger (seed-to-target) medial PFC–nucleus accumbens functional connectivity in a subgroup of SBPp (Baliki et al., 2012). However, the SBP group difference in dorsal medial PFC–amygdala–nucleus accumbens functional network connectivity was not maintained 3 years later (Fig. 2G and Supplementary Fig. 10A and B), with non-significant correlations between study entry and Week 156 (Fig. 2H). The functional connectivity networks of ventral medial PFC–amygdala and orbitofrontal cortex–amygdala–hippocampus modules did not differ between SBP groups (Supplementary Fig. 9B). Taken together, these results reinforce that the functional connectivity within the dorsal medial PFC–amygdala–nucleus accumbens is predictive of the transition to chronic pain 1 year later; in contrast, its impact dissipates by Year 3, suggesting that it is not required for the longer term maintenance of chronic pain.
Amygdala, hippocampus and risk for chronic pain
Morphometric measures of the amygdala and hippocampus (Fig. 3A and B) were examined because they both show strong genetic dependence (Hibar et al., 2015), represent risk factors for developing pathological emotional states such as anxiety (Russo et al., 2012) and depression (Drevets et al., 2008), and previous studies suggest that both may be involved in pain chronification (Metz et al., 2009; Ji and Neugebauer, 2011; Baliki et al., 2012; Hashmi et al., 2013). Given our white matter and functional connectivity network findings, we also examined the volumes of nucleus accumbens (a main component of the dorsal medial PFC–amygdala–nucleus accumbens module) and thalamus, as the latter is a primary relay for nociceptive transmission to the cortex through the spinothalamocortical projections. SBPp exhibited ∼10% smaller amygdala (Fig. 3C) and hippocampus (Fig. 3D) total volumes (left + right), as compared to SBPr and healthy controls (Supplementary Table 7). This effect was sustained over 3 years with strong correlations for volumes between study entry to Week 156 for all SBP, for the amygdala and hippocampus. These results were replicated using Freesurfer as an alternative segmentation tool for extracting subcortical volumes (Supplementary Fig. 11). However, no significant group differences were observed for volumes of the nucleus accumbens or the thalamus. Exploratory analyses further revealed that smaller amygdala and hippocampus volumes were accompanied by thinning of mainly the right amygdala shape in SBPp at all visits (Fig. 3G). We previously have shown that the hippocampus volume is smaller in patients with chronic pain (Mutso et al., 2012). Here we replicate the finding in two new patient groups suffering from longstanding chronic back pain and osteoarthritis and show reduced volumes for both amygdala and hippocampus. More importantly comparison between these groups and SBPp shows that extent of volume decrease is similar across chronic pain patients and SBPp at Week 0 (Fig. 3E and F). Given that both amygdala and hippocampus volumes distinguished between SBP groups, their morphologies did not change over 3 years, and smaller amygdala and hippocampus volumes were comparable between SBPp and multiple chronic pain conditions, these volumetric measures (derived and validated using two unbiased measurements, which are replicated in many labs in more than 30 000 subjects; Hibar et al., 2015) most likely reflect pre-existing circuit abnormalities that induce risk for chronic pain, across multiple chronic pain conditions.
Figure 3.

Amygdala and hippocampus volumes are risk factors for chronic pain. (A and B) Subcortical structures were segmented, corresponding volumes summed across hemispheres, and compared between groups as a function of time (Supplementary Tables 4 and 5). Heat maps display overlap of automated segmentation across SBPp, SBPr, and healthy controls at week 0. (C and D) Repeated measure ANCOVAs (group and time effects; covariate for age, gender, and grey matter volume) revealed that SBPp showed smaller amygdala [F(2,63) = 7.94; P < 0.001] and hippocampus [F(2,70) = 6.35; P = 0.003], but no main effect of time (P-values > 0.69) or group by time interaction (P-values > 0.23). Bar graphs illustrate group differences at 3 years. Scatterplots show volume reproducibility over 3 years across all SBP. *P < 0.05 SBPp versus SBPr, and SBPp versus healthy controls. (E and F) Age-matched chronic back pain patients showed significant smaller amygdala [t(1,42) = 2.71; P = 0.009 two-sided unpaired t-tests] and hippocampus [t(1,43) = 1.99; P = 0.05 two-sided unpaired t-tests] than SBPr, matching the volumes observed in SBPp. Similarly, osteoarthritis patients displayed at least marginally smaller amygdala [t(1,52) = 2.21; P = 0.03 two-sided unpaired t-tests] and hippocampus [t(1,52) = 1.95; P = 0.057 two-sided unpaired t-tests] when compared to age matched healthy controls. *P < 0.05, &P < 0.06. (G) Vertex-wise shape analyses of the amygdala and the hippocampus indicated that SBPp had thinner right amygdala across all visits. Number of subjects is shown in parentheses. Error bars indicate SEM.
Genetic associations with limbic risk factors
Data from twin studies show that chronic back pain is 20–67% heritable (Ferreira et al., 2013). Given the recent notion that genetic variants of some pathologies are more penetrant at the level of brain measures (Rose and Donohoe, 2013), we explored the hypothesis that gene variations can be linked to corticolimbic risk factors for chronic pain. We used an imaging–genetics approach to examine associations between SNPs and corticolimbic brain risk factors. In total, 30 candidate SNPs located in 12 different genes were selected for their known involvement in limbic functions and also to pain or nociception (Supplementary Tables 9–11). Genotypes were compared with regard to amygdala and hippocampus volumes, and dorsal medial PFC–amygdala–nucleus accumbens white matter and functional connectivity network connectivity for Week 0 values. Then, we secondarily tested if these genes could also differentiate between SBP groups as identified at Week 56. After correcting for multiple comparisons, the opioid receptor delta 1 (OPRD1) rs678849 SNP was associated with amygdala volume, and opioid receptor mu 1 (OPRM1) rs1799971 SNP was associated with incidence of connections within the dorsal medial PFC–amygdala–nucleus accumbens white matter network. Moreover, OPRD1 rs678849 SNP was also related to SBP groups at Week 56 (Supplementary Fig. 12 and Supplementary Table 12). These findings provide suggestive evidence that the OPRD1 polymorphism is a genetic candidate for mediating corticolimbic-based risk of chronic pain.
Modelling risk and symptom severity for chronic pain
We performed path analysis to unravel the relationships between the identified gene, pain at time of entry into the study, and corticolimbic risk factors for predicting chronic pain (Fig. 4). The three primary identified risk factors, each of which predicted SBPp/r groupings at 1 year based on measures collected at study entry, explained 60% of the variance for pain chronification (the explained variance would be closer to 90% if only right amygdala volume was used in the model, yet the model using bilateral amygdala volume should be more robust as this measure is replicated using different segmentation tools), and the gene–chronic pain relationship was fully mediated through the indirect effect of the amygdala volume, accounting for 4% of the total variance (Fig. 4A).
Figure 4.
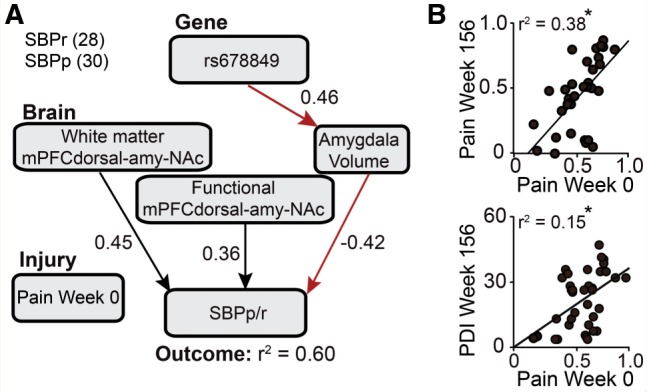
Corticolimbic characteristics determine risk for chronic pain but symptom severity depends only on initial pain intensity. (A) Path analysis was used to identify the contribution of rs678849 SNP, pain at Week 0, and brain parameters on risk for developing chronic pain (SBPp/r at Week 56). The white matter network (White matter) and functional connectivity network (Functional) connections of dorsal medial PFC–amygdala–nucleus accumbens (mPFCdorsal-amy-NAc) module and bilateral total amygdala volume, at Week 0, were independent predictors of pain persistence or recovery (SBPp/r) at Week 56 (all P-values ≤ 0.01). The relationship between OPRD1 rs678849 and pain persistence/recovery was fully mediated through the bilateral amygdala volume (indirect pathway 95% confidence interval: −0.021 and −0.173; R2 = 0.04 of unique variance). Covariance coverage within and between variables exceeded 88%. Numbers of subjects are shown in parentheses. (B) Scatterplots show that pain intensity at Week 0 significantly correlated with pain intensity and pain disability at Week 156 (P-values ≤ 0.001).
Although back pain intensity measured at entry in the study did not influence risk factor for chronic pain, it was the only parameter of the risk factors that explained 30% and 38% of the variance in pain intensity at 1 year and at 3 years, respectively (Fig. 4B). Restricting the regression model only to SBPp subjects, back pain at the time of entry into the study was the only parameter that explained 76% and 51% of the variance of back pain at 1 year and 3 years, respectively. These results imply that although the injury or inciting event-related back pain at time of entry into the study does not influence SBP groupings, initial back pain intensity has a large influence on symptom severity, especially in subjects where the pain persists.
Influence of negative affect on risk for chronic pain
Epidemiological studies indicate high prevalence of depression and negative affect in chronic pain patients, and propose these conditions reciprocally aggravate each other (Gerrits et al., 2015). Our data showed that neither negative affect nor depression changed over 3 years in SBP (Supplementary Table 1), which at least in this cohort discounts the influence of the development of chronic pain on negative moods. The converse influence of mood on the development of chronic pain remains a possibility. We addressed this issue by testing whether depression, and negative affect, influence future pain outcome through the mediating effects of uncovered corticolimbic risk factors, using path analysis. We observed that the density of connections within dorsal medial PFC–amygdala–nucleus accumbens white matter network mediated an indirect effect of depression on transition to chronic pain (accounting for 5% of total variance), with additional independent contributions of the volume of bilateral total amygdala volume and connections within dorsal medial PFC–amygdala–nucleus accumbens functional connectivity network (Supplementary Fig. 13). A similar mediation path was observed for negative affect (Supplementary Fig. 13). It is noteworthy that SBP were only mildly depressed, yet their negative mood influenced pain chronification through white matter connectivity of the medial dorsal PFC–amygdala–nucleus accumbens module. Maladaptive genotype-driven neural responsiveness may pave the way to development of chronic pain. As the dorsal medial PFC–amygdala–nucleus accumbens white matter network path is also influenced by the OPRM1 rs1799971, we here uncover a brain–gene relationship for the influence of mood on development of chronic pain.
Discussion
The present study tested the role of the corticolimbic system in development of chronic back pain. Earlier analyses of subsamples of these data (Baliki et al., 2012; Mansour et al., 2013) show that functional and white matter properties of some limbic regions impart risk for chronic pain. Yet identification of these factors was based on whole-brain contrasts. Here we used a completely unbiased approach, with around double the number of subjects, and tracked properties of identified risk factors for 3 years. Whole-brain multi-resolution white matter network comparisons at study entry indicated that structural connections predisposing the development of chronic pain at 1 year were located outside pain-related regions but within the corticolimbic brain. Higher-resolution examination of the corticolimbic white matter network identified three separate modules, where only the dorsal medial PFC–amygdala–nucleus accumbens module differentiated between SBP groups based on both white matter and functional connectivity. The white matter network connectivity of dorsal medial PFC–amygdala–nucleus accumbens remained constant over 3 years, but its functional network connectivity dissipated by 3 years relative to values at time 0. Both amygdala and hippocampus volumes differentiated between SBP groups, remained invariant over 3 years, and robustly distinguished between SBPp and SBPr.
The present results identify three segregated white matter network connectivity-based corticolimbic circuits, with only the dorsal medial PFC–amygdala–nucleus accumbens network contributing to risk for chronic pain. What are the functional properties of this module? The amygdala subdivisions of each mesolimbic module show correspondence with its function-based and cytoarchitecture-based parcellation (Bzdok et al., 2013). The portion of the amygdala incorporated within dorsal medial PFC–amygdala–nucleus accumbens network matched best to the basolateral nucleus, which functionally shows preferential involvement in sensory input processing (Bzdok et al., 2013). On the other hand, the corticolimbic circuits also subdivided the prefrontal cortex into dorsal, ventral and orbital subdivisions. These divisions may be viewed equivalent to the rodent medial frontal cortex with respective correspondences with pre-limbic, infra-limbic, and orbital cortices. Within this perspective, the cortical component of the dorsal medial PFC–amygdala–nucleus accumbens network becomes analogous to the rodent pre-limbic cortex. In the rodent, pre-limbic is necessary for expression of acquired fear but not for innate fear (Corcoran and Quirk, 2007), which parallels the evidence that human medial PFC represents intensity of chronic but not acute back pain (Hashmi et al., 2013). In rodent models of persistent pain, pre-limbic pyramidal neurons undergo rapid morphological changes (Metz et al., 2009), and amygdala inputs shift the balance between inhibitory and excitatory synaptic transmission in pre-limbic neurons (Ji et al., 2010). Three recent independent studies now also show that activation of pre-limbic neurons diminishes or blocks persistent, but do not influence acute pain behaviour (Lee et al., 2015; Wang et al., 2015; Zhang et al., 2015). One of these reports also demonstrates that projections from pre-limbic to nucleus accumbens mediate the relief from persistent pain (Lee et al., 2015). Therefore, the mesolimbic pre-limbic circuitry and the control of persistent pain by pre-limbic activity suggest that the dorsal medial PFC–amygdala–nucleus accumbens module should be considered its human homologue.
We recently proposed that, from a behaviour selection viewpoint, pain and negative emotions must be conceptualized as a continuum of processes necessary for survival (Baliki and Apkarian, 2015). Current results support the idea by demonstrating that smaller amygdala and hippocampal volumes, parameters commonly associated with negative affective disorders (Gilbertson et al., 2002), are also predictive of pain chronification. In SBP, amygdala and hippocampus volumes remained invariant over 3 years, and the reduced volumes seen in SBPp matched those observed in patients with chronic pain. Thus, we can generalize these results to chronic negative mood disorders where we presume the observed decreased volumes most likely also reflect predispositions. Recent evidence indicates that amygdala and hippocampus volumes impact emotional learning and sociability abilities. Healthy subjects with larger amygdala volume perform better in fear acquisition (Winkelmann et al., 2015), while subjects with larger hippocampus show higher fear contingency awareness (Cacciaglia et al., 2015) and more accurate discrimination of contextual fear (Pohlack et al., 2012). These limbic volume-related differential response characteristics may, therefore, represent personality traits predisposing subjects to both chronic pain and negative mood disorders.
We observed that the OPRD1 rs678849 SNP mediated through amygdala volume risk for chronic pain. Earlier studies associate this gene with cocaine, opiate, and heroin addiction, as well as with smaller regional brain volume (http://www.snpedia.com/index.php/Rs678849). This genetic evidence is consistent and complimentary to the role of dorsal medial PFC–amygdala–nucleus accumbens module in determining risk for chronic pain, as the latter module is also commonly implicated in addictive pathologies. Collectively these observations argue for chronic pain being a maladaptive response, contingent on corticolimbic properties that render the brain addicted to pain. We, however, emphasize the important caveat that the gene–brain–behaviour associations illustrated here are based on sampling few SNPs in a small number of subjects. They must be viewed as proof-of-concept exemplars, and larger and multi-centred collaborative gene–brain studies are necessary to unravel genes critical in the transition to chronic pain.
In conclusion, these results challenge long-standing views of the science of pain. Traditionally, the field has emphasized the inciting injury and related nociceptive spinal processes as primary culprits of pain chronification. Instead, here we establish that the gross anatomical properties of the corticolimbic brain, not the initial back pain, determine most of the risk for developing chronic pain. As the anatomical risk factors were stable across 3 years, they were presumably hardwired and present prior to the event initiating back pain. These results pave the way for the development of novel and distinct approaches to prevention and treatment of chronic pain.
Supplementary Material
Acknowledgements
We thank all patients and volunteers that participated in the study, and members of Apkarian lab for technical support and helpful suggestions.
Glossary
Abbreviations
- DTI
diffusion tensor imaging
- PFC
prefrontal cortex
- SBP
subacute back pain
- SNP
single nucleotide polymorphism
Funding
This work was supported by funds from the National Institute of Neurological Disorders and Stroke (NS035115, A.V.A.). E.V.P. and P.T. were funded from Canadian Institutes of Health Research (CIHR), E.C. was funded from Swedish Council for Working Life and Social Research (FAS: 2011-0627) and Uppsala University. M.N.B. was partially funded by an anonymous foundation.
Supplementary material
Supplementary material is available at Brain online.
References
- Achard S, Delon-Martin C, Vertes PE, Renard F, Schenck M, Schneider F, et al. Hubs of brain functional networks are radically reorganized in comatose patients. Proc Natl Acad Sci USA 2012; 109: 20608–13. [DOI] [PMC free article] [PubMed] [Google Scholar]
- Apkarian AV, Sosa Y, Sonty S, Levy RE, Harden RN, Parrish TB, et al. Chronic back pain is associated with decreased prefrontal and thalamic gray matter density. J Neurosci 2004; 24: 10410–5. [DOI] [PMC free article] [PubMed] [Google Scholar]
- Baliki MN, Apkarian AV. Nociception, pain, negative moods, and behavior selection. Neuron 2015; 87: 474–91. [DOI] [PMC free article] [PubMed] [Google Scholar]
- Baliki MN, Chang PC, Baria AT, Centeno MV, Apkarian AV. Resting-sate functional reorganization of the rat limbic system following neuropathic injury. Sci Rep 2014; 4: 6186. [DOI] [PMC free article] [PubMed] [Google Scholar]
- Baliki MN, Chialvo DR, Geha PY, Levy RM, Harden RN, Parrish TB, et al. Chronic pain and the emotional brain: specific brain activity associated with spontaneous fluctuations of intensity of chronic back pain. J Neurosci 2006; 26: 12165–73. [DOI] [PMC free article] [PubMed] [Google Scholar]
- Baliki MN, Geha PY, Fields HL, Apkarian AV. Predicting value of pain and analgesia: nucleus accumbens response to noxious stimuli changes in the presence of chronic pain. Neuron 2010; 66: 149–60. [DOI] [PMC free article] [PubMed] [Google Scholar]
- Baliki MN, Petre B, Torbey S, Herrmann KM, Huang L, Schnitzer TJ, et al. Corticostriatal functional connectivity predicts transition to chronic back pain. Nat Neurosci 2012; 15: 117–19. [DOI] [PMC free article] [PubMed] [Google Scholar]
- Beck AT, Ward CH, Mendelson M, Mock J, Erbaugh J. An inventory for measuring depression. Arch Gen Psychiatry 1961; 4: 561–71. [DOI] [PubMed] [Google Scholar]
- Behrens TE, Berg HJ, Jbabdi S, Rushworth MF, Woolrich MW. Probabilistic diffusion tractography with multiple fibre orientations: what can we gain? Neuroimage 2007; 34: 144–55. [DOI] [PMC free article] [PubMed] [Google Scholar]
- Behrens TE, Woolrich MW, Jenkinson M, Johansen-Berg H, Nunes RG, Clare S, et al. Characterization and propagation of uncertainty in diffusion-weighted MR imaging. Magn Reson Med 2003; 50: 1077–88. [DOI] [PubMed] [Google Scholar]
- Bzdok D, Laird AR, Zilles K, Fox PT, Eickhoff SB. An investigation of the structural, connectional, and functional subspecialization in the human amygdala. Hum Brain Mapp 2013; 34: 3247–66. [DOI] [PMC free article] [PubMed] [Google Scholar]
- Cacciaglia R, Pohlack ST, Flor H, Nees F. Dissociable roles for hippocampal and amygdalar volume in human fear conditioning. Brain Struct Funct 2015; 220: 2575–86. [DOI] [PubMed] [Google Scholar]
- Chang PC, Pollema-Mays SL, Centeno MV, Procissi D, Contini M, Baria AT, et al. Role of nucleus accumbens in neuropathic pain: linked multi-scale evidence in the rat transitioning to neuropathic pain. Pain 2014; 155: 1128–39. [DOI] [PMC free article] [PubMed] [Google Scholar]
- Corcoran KA, Quirk GJ. Activity in prelimbic cortex is necessary for the expression of learned, but not innate, fears. J Neurosci 2007; 27: 840–4. [DOI] [PMC free article] [PubMed] [Google Scholar]
- Drevets WC, Price JL, Furey ML. Brain structural and functional abnormalities in mood disorders: implications for neurocircuitry models of depression. Brain Struct Funct 2008; 213: 93–118. [DOI] [PMC free article] [PubMed] [Google Scholar]
- Ferreira PH, Beckenkamp P, Maher CG, Hopper JL, Ferreira ML. Nature or nurture in low back pain? Results of a systematic review of studies based on twin samples. Eur J Pain 2013; 17: 957–71. [DOI] [PubMed] [Google Scholar]
- Fischl B, Salat DH, Busa E, Albert M, Dieterich M, Haselgrove C, et al. Whole brain segmentation: automated labeling of neuroanatomical structures in the human brain. Neuron 2002; 33: 341–55. [DOI] [PubMed] [Google Scholar]
- Geha PY, Baliki MN, Harden RN, Bauer WR, Parrish TB, Apkarian AV. The brain in chronic CRPS pain: abnormal gray-white matter interactions in emotional and autonomic regions. Neuron 2008; 60: 570–81. [DOI] [PMC free article] [PubMed] [Google Scholar]
- Gerrits MM, van Marwijk HW, van Oppen P, van der Horst H, Penninx BW. Longitudinal association between pain, and depression and anxiety over four years. J Psychosom Res 2015; 78: 64–70. [DOI] [PubMed] [Google Scholar]
- Gilbertson MW, Shenton ME, Ciszewski A, Kasai K, Lasko NB, Orr SP, et al. Smaller hippocampal volume predicts pathologic vulnerability to psychological trauma. Nat Neurosci 2002; 5: 1242–7. [DOI] [PMC free article] [PubMed] [Google Scholar]
- Hashmi JA, Baliki MN, Huang L, Baria AT, Torbey S, Hermann KM, et al. Shape shifting pain: chronification of back pain shifts brain representation from nociceptive to emotional circuits. Brain 2013; 136(Pt 9): 2751–68. [DOI] [PMC free article] [PubMed] [Google Scholar]
- Hibar DP, Stein JL, Renteria ME, Arias-Vasquez A, Desrivieres S, Jahanshad N, et al. Common genetic variants influence human subcortical brain structures. Nature 2015; 520: 224–9. [DOI] [PMC free article] [PubMed] [Google Scholar]
- Jenkinson M, Bannister P, Brady M, Smith S. Improved optimization for the robust and accurate linear registration and motion correction of brain images. Neuroimage 2002; 17: 825–41. [DOI] [PubMed] [Google Scholar]
- Ji G, Neugebauer V. Pain-related deactivation of medial prefrontal cortical neurons involves mGluR1 and GABA(A) receptors. J Neurophysiol 2011; 106: 2642–52. [DOI] [PMC free article] [PubMed] [Google Scholar]
- Ji G, Sun H, Fu Y, Li Z, Pais-Vieira M, Galhardo V, et al. Cognitive impairment in pain through amygdala-driven prefrontal cortical deactivation. J Neurosci 2010; 30: 5451–64. [DOI] [PMC free article] [PubMed] [Google Scholar]
- Lee M, Manders TR, Eberle SE, Su C, D'Amour J, Yang R, et al. Activation of corticostriatal circuitry relieves chronic neuropathic pain. J Neurosci 2015; 35: 5247–59. [DOI] [PMC free article] [PubMed] [Google Scholar]
- Mackinnon DP, Lockwood CM, Williams J. Confidence limits for the indirect effect: distribution of the product and resampling methods. Multivariate Behav Res 2004; 39: 99. [DOI] [PMC free article] [PubMed] [Google Scholar]
- MacLean PD. The limbic system (“visceral brain”) in relation to the central gray and reticulum of the brain stem.Psychosom Med 1955; 17: 355–66. [DOI] [PubMed] [Google Scholar]
- Mansour AR, Baliki MN, Huang L, Torbey S, Herrmann KM, Schnitzer TJ, et al. Brain white matter structural properties predict transition to chronic pain. Pain 2013; 154: 2160–8. [DOI] [PMC free article] [PubMed] [Google Scholar]
- Medicine Io. Relieving pain in America: a blueprint for transforming prevention, care, education, and research. 2011. Available from: http://www.iom.edu. [PubMed] [Google Scholar]
- Melzack R. The McGill Pain Questionnaire: major properties and scoring methods. Pain 1975; 1: 277–99. [DOI] [PubMed] [Google Scholar]
- Melzack R, Casey K. Sensory, motivational, and central contol determinants of pain. The skin senses. Springfield: Charles C. Thomas; 1968. p. 423–43. [Google Scholar]
- Melzack R, Wall PD. Pain mechanisms: a new theory. Science 1965; 150: 971–9. [DOI] [PubMed] [Google Scholar]
- Metz AE, Yau HJ, Centeno MV, Apkarian AV, Martina M. Morphological and functional reorganization of rat medial prefrontal cortex in neuropathic pain. Proc Natl Acad Sci USA 2009; 106: 2423–8. [DOI] [PMC free article] [PubMed] [Google Scholar]
- Murray CJ, Lopez AD. Measuring the global burden of disease. N Engl J Med 2013; 369: 448–57. [DOI] [PubMed] [Google Scholar]
- Mutso AA, Petre B, Huang L, Baliki MN, Torbey S, Herrmann K, et al. Reorganization of hippocampal functional connectivity with transition to chronic back pain. J Neurophysiol 2014; 111: 1065–76. [DOI] [PMC free article] [PubMed] [Google Scholar]
- Mutso AA, Radzicki D, Baliki MN, Huang L, Banisadr G, Centeno MV, et al. Abnormalities in hippocampal functioning with persistent pain. J Neurosci 2012; 32: 5747–56. [DOI] [PMC free article] [PubMed] [Google Scholar]
- Neugebauer V, Li W, Bird GC, Bhave G, Gereau RW. Synaptic plasticity in the amygdala in a model of arthritic pain: differential roles of metabotropic glutamate receptors 1 and 5. J Neurosci 2003; 23: 52–63. [DOI] [PMC free article] [PubMed] [Google Scholar]
- Nugent AC, Luckenbaugh DA, Wood SE, Bogers W, Zarate CA, Jr., Drevets WC. Automated subcortical segmentation using FIRST: test-retest reliability, interscanner reliability, and comparison to manual segmentation. Hum Brain Mapp 2013; 34: 2313–29. [DOI] [PMC free article] [PubMed] [Google Scholar]
- Patenaude B, Smith SM, Kennedy DN, Jenkinson M. A Bayesian model of shape and appearance for subcortical brain segmentation. Neuroimage 2011; 56: 907–22. [DOI] [PMC free article] [PubMed] [Google Scholar]
- Petre B, Torbey S, Griffith JW, De Oliveira G, Herrmann K, Mansour A, et al. Smoking increases risk of pain chronification through shared corticostriatal circuitry. Hum Brain Mapp 2015; 36: 683–94. [DOI] [PMC free article] [PubMed] [Google Scholar]
- Phelps EA, LeDoux JE. Contributions of the amygdala to emotion processing: from animal models to human behavior. Neuron 2005; 48: 175–87. [DOI] [PubMed] [Google Scholar]
- Pohlack ST, Nees F, Liebscher C, Cacciaglia R, Diener SJ, Ridder S, et al. Hippocampal but not amygdalar volume affects contextual fear conditioning in humans. Hum Brain Mapp 2012; 33: 478–88. [DOI] [PMC free article] [PubMed] [Google Scholar]
- Raz M. The painless brain: lobotomy, psychiatry, and the treatment of chronic pain and terminal illness. Perspect Biol Med 2009; 52: 555–65. [DOI] [PubMed] [Google Scholar]
- Ren WJ, Liu Y, Zhou LJ, Li W, Zhong Y, Pang RP, et al. Peripheral nerve injury leads to working memory deficits and dysfunction of the hippocampus by upregulation of TNF-alpha in rodents. Neuropsychopharmacology 2011; 36: 979–92. [DOI] [PMC free article] [PubMed] [Google Scholar]
- Rose EJ, Donohoe G. Brain vs behavior: an effect size comparison of neuroimaging and cognitive studies of genetic risk for schizophrenia. Schizophr Bull 2013; 39: 518–26. [DOI] [PMC free article] [PubMed] [Google Scholar]
- Rubinov M, Sporns O. Complex network measures of brain connectivity: uses and interpretations. Neuroimage 2010; 52: 1059–69. [DOI] [PubMed] [Google Scholar]
- Russo SJ, Murrough JW, Han MH, Charney DS, Nestler EJ. Neurobiology of resilience. Nat Neurosci 2012; 15: 1475–84. [DOI] [PMC free article] [PubMed] [Google Scholar]
- Schwartz N, Temkin P, Jurado S, Lim BK, Heifets BD, Polepalli JS, et al. Chronic pain. Decreased motivation during chronic pain requires long-term depression in the nucleus accumbens. Science 2014; 345: 535–42. [DOI] [PMC free article] [PubMed] [Google Scholar]
- Smith SM, Zhang Y, Jenkinson M, Chen J, Matthews PM, Federico A, et al. Accurate, robust, and automated longitudinal and cross-sectional brain change analysis. Neuroimage 2002; 17: 479–89. [DOI] [PubMed] [Google Scholar]
- Tait RC, Chibnall JT, Krause S. The pain disability index: psychometric properties. Pain 1990; 40: 171–82. [DOI] [PubMed] [Google Scholar]
- Vachon-Presseau E, Roy M, Martel MO, Caron E, Marin MF, Chen J, et al. The stress model of chronic pain: evidence from basal cortisol and hippocampal structure and function in humans. Brain 2013; 136(Pt 3): 815–27. [DOI] [PubMed] [Google Scholar]
- Wang GQ, Cen C, Li C, Cao S, Wang N, Zhou Z, et al. Deactivation of excitatory neurons in the prelimbic cortex via Cdk5 promotes pain sensation and anxiety. Nat Commun 2015; 6: 7660. [DOI] [PMC free article] [PubMed] [Google Scholar]
- Watson D, Clark LA. The PANAS-X manual for the positive and negative affect schedule–Expanded form. University of Iowa; 1999. [Google Scholar]
- Winkelmann T, Grimm O, Pohlack ST, Nees F, Cacciaglia R, Dinu-Biringer R, et al. Brain morphology correlates of interindividual differences in conditioned fear acquisition and extinction learning. Brain Struct Funct 2015, in press. [DOI] [PubMed] [Google Scholar]
- Zalesky A, Fornito A, Bullmore ET. Network-based statistic: identifying differences in brain networks. Neuroimage 2010; 53: 1197–207. [DOI] [PubMed] [Google Scholar]
- Zhang Z, Gadotti VM, Chen L, Souza IA, Stemkowski PL, Zamponi GW. Role of prelimbic GABAergic circuits in sensory and emotional aspects of neuropathic pain. Cell Rep 2015; 12: 752–9. [DOI] [PubMed] [Google Scholar]
Associated Data
This section collects any data citations, data availability statements, or supplementary materials included in this article.