

Abstract
Objective
To review and complete meta‐analysis of studies estimating standardised mortality ratios (SMRs) in bipolar affective disorder (BPAD) for all‐cause and cause‐specific mortalities.
Method
Cause‐specific mortality was grouped into natural and unnatural causes. These subgroups were further divided into circulatory, respiratory, neoplastic and infectious causes, and suicide and other violent deaths. Summary SMRs were calculated using random‐effects meta‐analysis. Heterogeneity was examined via subgroup analysis and meta‐regression.
Results
Systematic searching found 31 studies meeting inclusion criteria. Summary SMR for all‐cause mortality = 2.05 (95% CI 1.89–2.23), but heterogeneity was high (I 2 = 96.2%). This heterogeneity could not be accounted for by date of publication, cohort size, mid‐decade of data collection, population type or geographical region. Unnatural death summary SMR = 7.42 (95% CI 6.43–8.55) and natural death = 1.64 (95% CI 1.47–1.83). Specifically, suicide SMR = 14.44 (95% CI 12.43–16.78), other violent death SMR = 3.68 (95% CI 2.77–4.90), deaths from circulatory disease = 1.73 (95% CI 1.54–1.94), respiratory disease = 2.92 (95% CI 2.00–4.23), infection = 2.25 (95% CI 1.70–3.00) and neoplasm = 1.14 (95% CI 1.10–1.21).
Conclusion
Despite considerable heterogeneity, all summary SMR estimates and a large majority of individual studies showed elevated mortality in BPAD compared to the general population. This was true for all causes of mortality studied.
Keywords: bipolar disorder, mortality, life expectancy
Summations.
All‐cause and cause‐specific mortalities are elevated in individuals with bipolar affective disorder relative to the general population.
As well as dramatic elevations in suicide risk, there is a mortality gap from all medical illnesses examined.
Considerations.
Heterogeneity was high in all‐cause and in many cause‐specific standardised mortality ratio estimates.
Heterogeneity could not be accounted for by any of the study‐level variables available.
Introduction
An increasing body of research has shown that bipolar affective disorder (BPAD) is associated with premature mortality. Where previously it was believed this was mostly attributable to unnatural causes such as suicide, homicide and accidents, it has also been shown that patients with BPAD are also at risk of premature death from a range of medical illnesses 1. In 1998, Harris and Barraclough 2 reviewed mortality in all mental disorders. Six studies contributed to their meta‐analysis of mortality in BPAD. A more recent review published in 2009 included 13 studies 1. However, this review only searched one database and included patients without a clear diagnosis of BPAD (such as mixed unipolar/bipolar groups). Since these publications, a number of large database studies have derived standardised mortality ratio (SMR) estimates. The SMR is an indirect method of standardisation calculated by the ratio of observed deaths in the study group to expected deaths in the general population.
The issue of premature mortality, beyond suicide, has been understudied in BPAD compared with other disorders, such as schizophrenia and unipolar depression 3, and there is a lack of clear evidence in this area. There is likely to be considerable heterogeneity amongst SMR estimates. Overreliance on either inpatient data or community‐based samples is an important limitation. The sole use of inpatient data may potentially result in bias and poor generalisability by including only more severe cases, whereas community‐based samples are often limited by insufficient sample sizes. Heterogeneity may also be introduced by period effects and by comparing treated and untreated groups.
Aims of the study
To estimate all‐cause and cause‐specific mortalities in bipolar affective disorder via a systematic review and meta‐analysis of cohort studies.
Material and methods
Existing studies of SMR in BPAD were systematically reviewed to examine the association between BPAD and all‐cause and cause‐specific mortality. Cause‐specific mortality was grouped into natural and unnatural causes. These subgroups were further divided into suicide and other violent deaths, and deaths from circulatory, respiratory, neoplastic and infectious causes. Heterogeneity was assessed by geographical region, population type, cohort size, mid‐decade of cohort data collection and decade of publication. We closely followed the guidance provided by the PRISMA statement and MOOSE proposal for reporting 4, 5.
Identification of studies
To identify all studies examining mortality in BPAD, the Medical Subject Heading (MeSH) terms and keywords for BPAD and mortality were searched in PsycINFO, MEDLINE and EMBASE. MeSH terms were as follows: bipolar disorder, mortality, life expectancy, death, death and dying. Keywords searched were as follows: bipolar illness, manic depression, bipolar disorder, bipolar affective disorder, life expectancy, mortality and death (full search terms are available from the corresponding author on request). All databases were searched from their inception until 30 July 2014. JFH and JM performed the searches individually and then compared results. The abstracts of potentially relevant articles were reviewed by both JFH and JM. Additional articles and conference papers including primary data were identified from citations in relevant studies and reviews, the Cochrane database of systematic reviews and Google Scholar. Emails were then sent to senior authors of articles that met inclusion criteria to attempt to identify all missing studies. One extra‐published study was identified by this method, and no further unpublished data were made available (Fig. 1).
Figure 1.
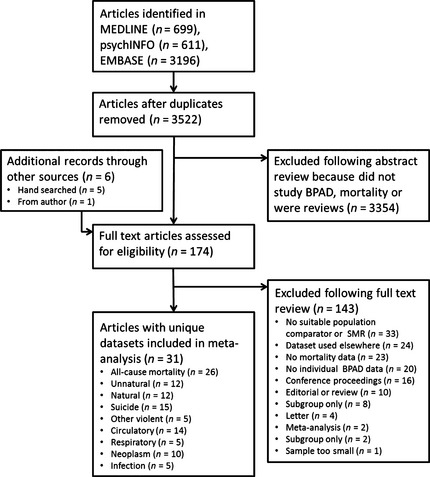
Flow diagram of the published articles evaluated for inclusion in this meta‐analysis.
Inclusion and exclusion criteria
Included studies met all of the following a priori defined criteria:
Published between 1 January 1960 and 30 July 2014.
Reported deaths of people diagnosed with BPAD; studies were included if BPAD was diagnosed by any criteria.
Individuals included in the study were 16 years or older.
Primary data on all‐cause mortality or cause‐specific mortality were included; specific subcategories of mortality were as follows: natural deaths, unnatural deaths, suicide, other violent deaths, infection, neoplasm, respiratory and circulatory system disease.
Reported data on observed and expected deaths, or SMR allowing the number of observed and expected deaths to be calculated.
Studies were excluded if they:
Involved cohorts that could not be defined as having BPAD (i.e. studies which grouped together affective disorders).
Included a cohort of <50 patients (to avoid including cohorts in which there were no observed deaths).
Were not standardised by age.
Reported mortality in a particular subgroup of the population with BPAD (i.e. prison population).
Reported duplicate data (or data sets from overlapping time periods at the same site).
Study‐level information was filtered to identify data from multiple studies that overlapped in place and time. The most informative paper was then used as the representative mortality estimate for inclusion in the meta‐analysis (i.e. larger samples and longer time periods were preferred).
Data extraction
Once a study was included, data were extracted and entered into a database that included study‐level variables [authors, country, year of publication, years of data collection, length follow‐up, which covariates the mortality was standardised by, the site of collection (i.e. multiple site or population level), the population type (i.e. inpatient or community)] and estimate‐level variables (number of men and women in the cohort, deaths from all causes and specific causes for both men and women, and population‐level estimates of expected deaths).
JFH and JM individually extracted data used in the analysis using a standardised form. If disagreements arose, these were resolved by consensus. When required, we contacted the original authors for clarification of issues.
Statistical methods
The SMR gives the ratio of death in BPAD compared to the general population. For each cause of death, SMRs and their 95% confidence intervals were extracted from each publication or calculated (observed deaths/expected deaths).
The statistical significance of the SMR is based on the Poisson distribution (two‐tailed) using 95% confidence intervals. The SMR is significantly raised when the lower confidence interval is >1.00. For each study, 95% CIs were calculated using the Rothman–Greenland method 6. Pooled SMRs with 95% CI for all‐cause and cause‐specific mortalities were calculated using the DerSimonian and Laird method, a random‐effects model that incorporates both between‐study and within‐study variation 7. Using this method assumes that significant heterogeneity exists between studies.
Statistical heterogeneity was assessed in a number of ways. First, the I 2 index and chi‐square test were used to investigate differences amongst studies with respect to SMRs. Additionally, meta‐regression analysis was performed for heterogeneity of the all‐cause SMR because of decade of publication, cohort size, geographical region, mid‐decade of cohort data collection and population type (i.e. inpatient or community). Subgroup analyses were performed to assess potential sources of heterogeneity separately as a result of the following available patient‐level and study‐level factors: geographical region of study, patient population type and decade of the middle year of patient observation. These were considered to be the key sources of potential bias in the included studies. Funnel plots and Egger's regression were used to assess for publication and small‐study bias in groups containing 10 or more studies 8.
All analysis was completed using metan and associated commands in stata 13 9.
Results
The inclusion criteria were met by 31 published studies including unique data sets 10, 11, 12, 13, 14, 15, 16, 17, 18, 19, 20, 21, 22, 23, 24, 25, 26, 27, 28, 29, 30, 31, 32, 33, 34, 35, 36, 37, 38, 39, 40 (Fig. 1, Table 1). Of these, 64% were inpatient cohorts. A large number (45%) of studies came from Scandinavian countries (Norway, Sweden, Denmark and Finland). Overall, there were 305 859 people with a diagnosis of BPAD (not including individuals in studies 24 and 31, which only presented person‐years at risk). Data collection ranged from 1935 to 2010.
Table 1.
Studies included in the meta‐analysis
| Author (year) | Country | Years of collection | Total, N | N, Men | N, Women | Standardised by | Site of collection | Population type | Mortality outcome |
|---|---|---|---|---|---|---|---|---|---|
| Bratfos & Haug (1968) (10) | Norway | 1950–1963 | 207 | Age, Sex | Single site | Inpatient | All‐cause, suicide | ||
| Innes & Miller (1970) (11) | United Kingdom | 1964–1969 | 374 | Age | Population | Inpatient & community | All‐cause | ||
| Kay & Petterson (1977) (12) | Sweden | 1961–1970 | 192 | 84 | 108 | Age, sex | Multiple site | Inpatient | All‐cause |
| Tsuang et al. (1980) (13) | United States | 1935–1974 | 100 | 45 | 55 | Age, sex | Single site | Inpatient | All‐cause, unnatural, natural, infectious , neoplasm, circulatory |
| Norton et al. (1984) (14) | United Kingdom | 1967–1976 | 791 | Age, sex | Population | Inpatient & community | All‐cause, suicide, infectious, neoplasm, circulatory | ||
| Black et al. (1987) (15) | United States | 1970–1981 | 586 | 266 | 320 | Age, sex, time at risk | Single site | Inpatient | All‐cause, unnatural, natural |
| Weeke et al. (1987) (16) | Denmark | 1969–1976 | 417 | 185 | 232 | Age, sex, time at risk | Inception cohort | Inpatient | All‐casue, unnatural, natural, suicide, other violent, neoplasm, circulatory |
| Newman & Bland (1991) (17) | Canada | 1976–1985 | 1429 | Age, sex, time at risk | Multiple site | Inpatient & community | All‐cause, suicide | ||
| Vestergaard & Aagaard (1991) (18) | Denmark | 1981–1988 | 133 | Age, sex | Multiple site | Inpatient | All‐cause, suicide, circulatory, respiratory | ||
| Jorgensen & Mortensen (1992) (19) | Denmark | 1970–1988 | 18293 | Age, sex | Inception cohort | Inpatient | All‐cause | ||
| Sharma et al. (1994) (20) | United Kingdom | 1970–1987 | 472 | Age, sex | Population | Inpatient & community | All‐cause, suicide, circulatory, respiratory | ||
| Ahrens et al. (1995) (21) | Denmark, Germany, Canada, Austria | 1962–1992 | 440 | 189 | 251 | Age, sex | Multiple site | Inpatient & community | All‐cause, suicide, circulatory |
| Nilson (1995) (22) | Sweden | 1970–1991 | 362 | Age, sex | Single site | Inpatient | All‐cause | ||
| Saku et al. (1995) (23) | Japan | 1948–1982 | 187 | 119 | 68 | Age | Single site | Inpatient | All‐cause, neoplasm |
| Hiroeh et al. (2001) (24) | Denmark | 1973–1993 | N/A | N/A | N/A | Age, sex, time at risk | Population | Inpatient | Unnatural, suicide, other violent |
| Osby et al. (2001) (25) | Sweden | 1973–1995 | 15386 | 6578 | 8808 | Age, sex | Population | Inpatient | All‐cause, unnatural, natural, suicide, other violent, infectious, neoplasm, circulatory, respiratory |
| Schneider et al. (2001) (26) | Germany | 1983–1988 | 74 | 24 | 50 | Age, sex | Single site | Inpatient | All‐cause, unnatural |
| Angst et al. (2002) (27) | Switzerland | 1959–1997 | 220 | Age | Single site | Inpatient | All‐cause, unnatural, natural, suicide, other violent, neoplasm, circulatory | ||
| Amaddeo et al. (2007) (28) | Italy | 1982–2001 | 278 | Age, sex | Population | Community | All‐cause | ||
| Dutta et al. (2007) (29) | United Kingdom | 1965–1999 | 135 | 102 | 133 | Age, sex | Inception cohort | Community | All‐cause, natural, suicide, neoplasm |
| Osborn et al. (2007) (30) | United Kingdom | 1987–2002 | 69056 | Age, sex | Population | Community | Circulatory | ||
| Hiroeh et al. (2008) (31) | Denmark | 1973–1993 | N/A | N/A | N/A | Age, sex, time at risk | Population | Inpatient | Natural, infectious, neoplasm, circulatory, respiratory |
| Osborn et al. (2008) (32) | United Kingdom | 1987–2002 | 10742 | Age, sex | Population | Community | Suicide | ||
| Chang et al. (2010) (33) | United Kingdom | 2007–2009 | 2700 | Age, sex | Inception cohort | Community | All‐cause | ||
| Hoang et al. (2011) (34) | United Kingdom | 1999–2006 | 75718 | Age, sex | Population | Inpatient | All‐cause, unnatural, natural | ||
| Nordentoft et al. (2011) (35) | Denmark | 1970–2006 | 5927 | 2571 | 3356 | Age, sex | Inception cohort | Inpatient & community | Suicide |
| Ajetunmobi et al. (2013) (36) | United Kingdom | 1986–2010 | 3839 | Age, sex, deprivation, time at risk | Inception cohort | Inpatient | All‐cause, unnatural, natural, suicide, infectious, neoplasm, circulatory | ||
| Crump et al. (2013) (37) | Sweden | 2003–2009 | 6618 | 2700 | 3918 | Age, sex | Population | Inpatient & community | All‐cause, unnatural, natural, suicide, other violent, infectious, neoplasm, circulatory, respiratory |
| Hoang et al. (2013) (38) | United Kingdom | 2006–2008 | 34707 | Age, sex | Population | Inpatient | All‐cause | ||
| Laursen et al. (2013a) (39) | Sweden | 2000–2007 | 18355 | 7367 | 10988 | Age, sex | Population | Inpatient | All‐cause, unnatural, natural, circulatory |
| Laursen et al. (2013b) (39) | Finland | 2000–2007 | 9919 | 4489 | 5430 | Age, sex | Population | Inpatient | All‐cause, unnatural, natural, circulatory |
| Laursen et al. (2013c) (39) | Denmark | 2000–2007 | 11101 | 4280 | 6821 | Age, sex | Population | Inpatient | All‐cause, unnatural, natural, circulatory |
| Westman et al. (2013) (40) | Sweden | 1987–2006 | 17101 | 8208 | 8893 | Age, sex | Population | Inpatient | All‐cause, unnatural, natural, circulatory |
N/A, not available
Hiroeh et al. (24 & 31) presented person‐years at risk (PYAR) rather than individuals: men = 155337 PYAR, women = 309639 PYAR.
The reported SMRs for all‐cause mortality in patients with BPAD ranged from 1.24 (95% CI 0.83–1.17) to 4.65 (95% CI 1.27–11.91). Within the 26 individual studies assessing all‐cause mortality, all SMR point estimates were elevated, but four of 26 had confidence intervals that overlapped one 13, 21, 26, 29, and these were all relatively small studies (N < 440). The all‐cause summary SMR for bipolar disorder was 2.05 (95% CI 1.89–2.23). There was significant heterogeneity between these studies (I 2 = 96.2%, 95% CI 95.6–96.7, P < 0.001) (Fig. 2).
Figure 2.
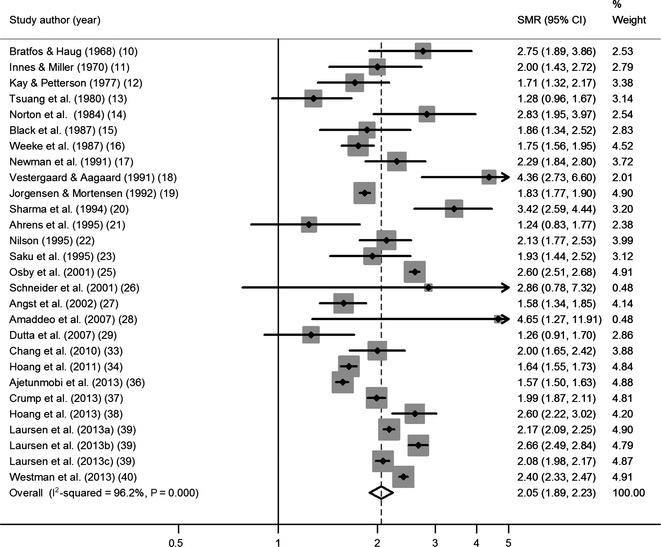
Standardised mortality ratio (SMR) of all‐cause mortality. CI, confidence interval; % weights are from random‐effects analysis.
Sex‐specific all‐cause mortality showed similarly elevated summary estimates, but again the studies were highly heterogeneous (Table 2). This was also true for mortality grouped as natural and unnatural. Studies had heterogeneous SMR estimates for suicide, other violent deaths and circulatory disease mortality. Estimates for SMRs for infectious and neoplastic deaths were more homogenous. Summary estimates suggested increased rates of death from all causes in people with bipolar disorder (Table 2).
Table 2.
Summary SMRs for all‐cause and cause specific mortalities
| No. of studies | Number of individualsa | Summary SMR (95°% CI) | I 2 (95% CI) | Het P | |
|---|---|---|---|---|---|
| All‐cause | 26 | 220 134 | 2.05 (1.89–2.23) | 96.2 (95.6–96.7) | <0.001 |
| Men | 15 | 34 636 | 2.17 (2.01–2.34) | 83.6 (74.8–88.3) | <0.001 |
| Women | 15 | 46 075 | 2.11 (1.93–2.31) | 84.4 (83.4–91.39) | <0.001 |
| Natural | 12 | 159 495 | 1.64 (1.47–1.83) | 98.0 (98.0–98.5) | <0.001 |
| Men | 9 | 34 220 | 1.72 (1.54–1.93) | 94.5 (92.5–95.8) | <0.001 |
| Women | 9 | 45 598 | 1.74 (1.51–1.99) | 97.6 (97.1–98.0) | <0.001 |
| Unnatural | 12 | 159 434 | 7.42 (6.43–8.55) | 95.6 (93.9–96.2) | <0.001 |
| Men | 9 | 34 142 | 7.89 (7.05–8.81) | 82.4 (68.1–88.6) | <0.001 |
| Women | 9 | 45 515 | 9.23 (7.14–11.94) | 96.6 (95.6–97.2) | <0.001 |
| Suicide | 15 | 46 756 | 14.44 (12.43–16.78) | 87.0 (80.4–90.7) | <0.001 |
| Men | 9 | 12 325 | 13.31 (10.62–16.69) | 87.8 (78.7–91.9) | <0.001 |
| Women | 9 | 16 698 | 15.74 (12.84–19.31) | 81.7 (63.4–88.7) | <0.001 |
| Other violent | 5 | 22 641 | 3.68 (2.77–4.90) | 89.5 (77.2–93.8) | <0.001 |
| Men | 4 | 9463 | 3.06 (2.19–4.03) | 86.2 (57.6–92.8) | <0.001 |
| Women | 4 | 12 958 | 5.53 (1.60–19.14) | 99.0 (98.7–99.19) | <0.001 |
| Circulatory | 14 | 153 948 | 1.73 (1.54–1.94) | 95.2 (93.9–96.1) | <0.001 |
| Men | 9 | 34 041 | 1.81 (1.61–2.05) | 90.3 (85.1–93.1) | <0.001 |
| Women | 9 | 45 396 | 1.72 (1.46–2.03) | 96.0 (94.8–96.82) | <0.001 |
| Respiratory | 5 | 22 609 | 2.92 (2.00–4.23) | 94.14 (89.8–96.1) | <0.001 |
| Men | 4 | 9278 | 2.73 (1.76–4.24) | 90.2 (75.9–94.5) | <0.001 |
| Women | 4 | 12 726 | 2.72 (1.78–4.20) | 91.3 (80.0–94.99) | <0.001 |
| Infection | 5 | 22 895 | 2.25 (1.70–3.00) | 45.4 (0.0–78.5) | 0.12 |
| Men | 4 | 9323 | 2.76 (1.94–3.92) | 43.1 (0.0–80.0) | 0.15 |
| Women | 4 | 12 781 | 1.77 (1.30–2.40) | 20.9 (0.0–74.1) | 0.29 |
| Neoplasm | 10 | 27 693 | 1.14 (1.10–1.21) | 20.7 (0.0–61.9) | 0.25 |
| Men | 7 | 9729 | 1.11 (1.05–1.17) | 0.0 (0.0–58.5) | 0.47 |
| Women | 7 | 13 214 | 1.19 (1.05–1.37) | 56.3 (0.0–79.3) | 0.03 |
SMR, standardised mortality ratio; CI, confidence interval; I 2, index of heterogeneity; Het P, from x 2 test.
Not including individuals in studies 24 and 31.
In univariable meta‐regression, all‐cause mortality was not significantly associated with decade of publication (P = 0.63), cohort size (P = 0.75), geographical region (P = 0.55), mid‐decade of cohort data collection (P = 0.89) or population type (P = 0.65). After accounting for all of these possible explanatory variables in multivariable meta‐regression, residual variation due to heterogeneity amongst all‐cause mortality SMRs remained (I 2 = 88.3%, 95% CI 84.6–90.7, P < 0.001).
Subgroup analyses were performed stratified by geographical region, population type and mid‐decade of study (Table 3). Stratifying by these covariates had little effect on heterogeneity in summary estimates for all‐cause, natural and unnatural death SMRs, which remained high.
Table 3.
Summary SMRs by subgroup for all‐cause mortality, and natural and unnatural death
| No. of studies | Summary SMR (95% CI) | I 2 (95% CI) | Het P | |
|---|---|---|---|---|
| All‐cause | ||||
| Geographical region | ||||
| Scandinavia | 10 | 2.20 (2.01–2.41) | 96.5 (95.2–97.5) | <0.001 |
| North America | 3 | 1.77 (1.24–2.53) | 81.4 (42.7–94.0) | 0.005 |
| UK | 8 | 2.06 (1.74–2.34) | 91.7 (86.0–95.1) | <0.001 |
| Other European | 4 | 1.67 (1.18–2.38) | 51.7 (0.0–84.1) | 0.1 |
| Japan | 1 | 1.93 (1.44–2.52) | – | – |
| Population type | ||||
| Inpatient | 17 | 2.05 (1.86–2.25) | 97.3 (96.9–97.7) | <0.001 |
| Inpatient and community | 6 | 2.21 (1.79–2.73) | 80.6 (49.1–89.4) | <0.001 |
| Community | 3 | 1.85 (1.16–2.94) | 77.6 (0.0–91.1) | 0.01 |
| Mid‐point of study | ||||
| 1950s | 2 | 1.86 (0.88–3.94 | 90.9a | 0.001 |
| 1960s | 3 | 1.85 (1.58–2.17) | 0.0 (0.0–72.9) | 0.7 |
| 1970s | 6 | 1.93 (1.67–2.24) | 82.5 (60.8–89.8) | <0.001 |
| 1980s | 6 | 2.30 (1.84–2.87) | 84.1 (62.3–90.9) | <0.001 |
| 1990s | 3 | 2.12 (1.42–3.14) | 99.3 (99.0–99.4) | <0.001 |
| 2000s | 5 | 2.13 (1.90–2.39) | 95.7 (93.9–96.8) | <0.001 |
| Natural | ||||
| Geographical region | ||||
| Scandinavia | 6 | 1.79 (1.56–2.05) | 98.8 (98.6–99.0) | <0.001 |
| North America | 2 | 1.34 (0.90–2.00) | 64.9a | 0.09 |
| UK | 3 | 1.42 (0.95–2.12) | 98.7 (98.1–99.0) | <0.001 |
| Other European | 1 | 1.40 (1.17–1.66) | – | – |
| Population type | ||||
| Inpatient | 10 | 1.67 (1.48–1.88) | 96.1 (95.0–96.9) | <0.001 |
| Inpatient and community | 1 | 1.79 (1.68–1.91) | – | – |
| Community | 1 | 1.03 (0.71–1.44) | – | – |
| Mid‐point of study | ||||
| 1950s | 1 | 1.10 (0.79–1.49) | – | – |
| 1960s | 0 | – | – | – |
| 1970s | 3 | 1.36 (1.23–1.51) | 0.0 (0.0–72.9) | 0.43 |
| 1980s | 3 | 1.51 (1.14–2.00) | 99.1 (98.8–99.3) | <0.001 |
| 1990s | 2 | 2.06 (2.00–2.12) | 0.0a | 0.62 |
| 2000s | 3 | 1.75 (1.50–2.03) | 97.1 (95.8–97.9) | <0.001 |
| Unnatural | ||||
| Geographical region | ||||
| Scandinavia | 6 | 8.15 (7.20–9.24) | 94.0 | <0.001 |
| North America | 2 | 3.12 (1.97–4.96) | 0a | 0.75 |
| UK | 2 | 7.90 (3.16–19.73) | 99.2a | <0.001 |
| Other European | 2 | 5.60 (2.42–12.95) | 31.8a | 0.23 |
| Population type | ||||
| Inpatient | 11 | 7.56 (6.52–8.77) | 95.4 (94.0–96.3) | <0.001 |
| Inpatient and community | 1 | 6.05 (5.14–7.12) | – | – |
| Community | 0 | – | – | |
| Mid‐point of study | ||||
| 1950s | 1 | 2.93 (1.52–5.13) | – | – |
| 1960s | 0 | – | – | – |
| 1970s | 3 | 5.46 (3.03–9.85) | 84.3 (15.7–93.0) | 0.002 |
| 1980s | 3 | 8.75 (6.39–11.97) | 97.3 (95.4–982) | <0.001 |
| 1990s | 2 | 6.93 (3.60–13.34) | 98.9a | <0.001 |
| 2000s | 3 | 8.26 (6.53–10.44) | 94.9 (91.6–96.6) | <0.001 |
SMR, standardised mortality ratio; CI, confidence interval: I 2, index of heterogeneity; Het P, from chi‐square test.
95% CI cannot be calculated due to 1 degree of freedom.
For all‐cause mortality SMR, Eggers test did not suggest significant publication bias (P = 0.63). The same was true for SMR of unnatural deaths (P = 0.55) and suicide (P = 0.40). However, given the high heterogeneity publication bias cannot be ruled out with certainty in these groups. It is even more likely to be present in studies of natural deaths (P = 0.05) and circulatory disease (P = 0.17).
Discussion
This review of mortality in patients with BPAD highlights the increased risk of death from all causes. Summary SMR estimates from random‐effects meta‐analysis showed that all‐cause mortality in BPAD is double that expected in the general population. Natural deaths are over 1.5 times greater in BPAD than the general population; these natural deaths are made up of an almost double risk of deaths from circulatory illnesses (heart attacks, strokes, etc.) and three times risk of deaths from respiratory illness (COPD, asthma, etc.). Unnatural deaths are around seven times more common, with increased risk of suicide of around 14 times and other violent deaths (accidents, homicide, etc.) almost four times as likely. Deaths by all causes were similarly elevated in both men and women. Of particular concern is the lack of association between mid‐decade of cohort follow‐up and SMR: having BPAD in the 2000s has the same mortality risk compared to the general population as it did in the 1950s. With the increased use of second‐generation antipsychotics in these cohorts 41, 42 and associated elevated risk of cardiovascular disease, the failure of smoking cessation policy to address the needs of the severely mentally ill, relative to the general population 43, 44 and the continued lack of equality in access to health care for people with BPAD 43, this gap in deaths from medical illness may to widen unless it is directly addressed. In terms of modifying the increased rate of unnatural deaths, particular attention needs to be paid to comorbid substance misuse, risk of coercion, exploitation, receipt and perpetration of violence, and suicidal ideation 43, 44, 45.
Heterogeneity across studies was high (less so for deaths from cancer and infection). Heterogeneity in all‐cause mortality, and natural and unnatural death SMRs could not be accounted for by year of publication, study size, mid‐point of data collection, geographical region or population type. Whilst it is possible that some of these factors were imperfectly adjusted for in the analysis (for example some cohorts spanned many decades), the results suggest that there are unidentified factors that led to differences in outcomes for different cohorts of patients with BPAD. It has been shown that patients with BPAD in the United States have worse physical health and greater comorbidity than those in Germany and the Netherlands 47; however, it may be the case that there are even more localised differences in BPAD outcomes. This meta‐analysis suggests that within the US or Europe, mortality estimates for BPAD are not homogenous. Adjusting for cohort size did little to reduce the heterogeneity, despite the increased accuracy in SMR estimates larger studies should provide. Stratifying by decade of data collection did not affect heterogeneity, suggesting that the differences are not down to improvements in treatment over time. Studies of inpatient populations and community cohorts were also heterogeneous, suggesting these differences are not down to engagement with services or severity of illness.
There are several limitations of studies included in this review. SMRs were often only age and sex adjusted; therefore, other characteristics of the study populations, such as illness duration and lifestyle factors, may have contributed to the significant heterogeneity. For example, it was not possible to assess whether current or former smoking contributed to excess respiratory mortality. Disease severity was not assessed in all of the included studies, and therefore, it is not possible to assess heterogeneity in the overall mortality by severity. It has been recognised that patients with bipolar disorder accumulate numerous medical risk factors including smoking, use of alcohol and other illicit drugs, prescribed medication and comorbid anxiety and eating disorders that lead to earlier disease onset, poor engagement with health care and poor long‐term outcomes 48. These risk factors may be assigned differentially, both geographically and temporally. In many of the included studies, cause of death was ascertained from death certificates and therefore may be subject to potential misclassification bias. Having a mental health diagnosis has been shown to increase the risk of a coroners verdict of suicide rather than accidental or undetermined death 49 but may also reduce diagnosis of terminal illness leading to miscoding of physical cause of death 43.
This meta‐analysis highlights differential mortality in patients with BPAD and the general population. Similarly to schizophrenia, patients with BPAD have over twice the all‐cause mortality 50. Mortality from all physical conditions and unnatural causes is elevated. Variation in all‐cause mortality is considerable across time and place. There is no evidence that all‐cause mortality for patients with BPAD has improved over time relative to the general population.
Declaration of interest
None.
Acknowledgements
JFH is supported by a Medical Research Council Population Health Scientist Fellowship (grant code: MR/K021362/1).
Hayes JF, Miles J, Walters K, King M, Osborn DPJ. A systematic review and meta‐analysis of premature mortality in bipolar affective disorder.
References
- 1. Roshanaei‐Moghaddam B, Katon W. Premature mortality from general medical illnesses among persons with bipolar disorder: a review. Psychiatr Serv 2009;60:147–156. [DOI] [PubMed] [Google Scholar]
- 2. Harris EC, Barraclough B. Excess mortality of mental disorder. Br J Psychiatry 1998;173:11–53. [DOI] [PubMed] [Google Scholar]
- 3. McIntyre RS, Soczynska JK, Beyer JL et al. Medical comorbidity in bipolar disorder: reprioritizing unmet needs. Curr Opin Psychiatry 2007;20:406–416. [DOI] [PubMed] [Google Scholar]
- 4. Moher D, Liberati A, Tetzlaff J, Altman DG. Preferred reporting items for systematic reviews and meta‐analyses: the PRISMA statement. Ann Intern Med 2009;151:264–269. [DOI] [PubMed] [Google Scholar]
- 5. Stroup DF, Berlin JA, Morton SC et al. Meta‐analysis of observational studies in epidemiology: a proposal for reporting. JAMA 2000;283:2008–2012. [DOI] [PubMed] [Google Scholar]
- 6. Rothman KJ, Greenland S, Lash TL, eds. Modern epidemiology. Philadelphia, PA, USA: Lippincott Williams & Wilkins, 2008. [Google Scholar]
- 7. DerSimonian R, Laird N. Meta‐analysis in clinical trials. Control Clin Trials 1986;7:177–188. [DOI] [PubMed] [Google Scholar]
- 8. Sterne JA, Egger M, Moher D. Addressing reporting biases In: Higgins JP, Green S, eds. Cochrane handbook for systematic reviews of interventions. Chichester, UK: John Wiley & Sons, Ltd, 2008:297–333. [Google Scholar]
- 9. STATACORP . Stata statisitcal software: release 13. College Station, TX, USA: StataCorp LP, 2013. [Google Scholar]
- 10. Bratfos O, Haug JO. The course of manic‐depressive psychosis. A follow up investigation of 215 patients. Acta Psychiatr Scand 1968;44:89–112. [DOI] [PubMed] [Google Scholar]
- 11. Innes G, Millar W. Mortality among psychiatric patients. Scott Med J 1970;15:143–148. [DOI] [PubMed] [Google Scholar]
- 12. Kay DWK, Petterson U. VI. Mortality. Acta Psychiatr Scand 1977;56:55–60. [Google Scholar]
- 13. Tsuang MT, Woolson RF, Fleming JA. Premature deaths in schizophrenia and affective disorders. An analysis of survival curves and variables affecting the shortened survival. Arch Gen Psychiatry 1980;37:979–983. [DOI] [PubMed] [Google Scholar]
- 14. Norton B, Whalley LJ. Mortality of a lithium‐treated population. Br J Psychiatry 1984;145:277–282. [DOI] [PubMed] [Google Scholar]
- 15. Black DW, Winokur G, Nasrallah A. Mortality in patients with primary unipolar depression, secondary unipolar depression, and bipolar affective disorder: a comparison with general population mortality. Int J Psychiatry Med 1987;17:351–360. [DOI] [PubMed] [Google Scholar]
- 16. Weeke A, Juel K, Vaeth M. Cardiovascular death and manic‐depressive psychosis. J Affect Disord 1987;13:287–292. [DOI] [PubMed] [Google Scholar]
- 17. Newman SC, Bland RC. Suicide risk varies by subtype of affective disorder. Acta Psychiatr Scand 1991;83:420–426. [DOI] [PubMed] [Google Scholar]
- 18. Vestergaard P, Aagaard J. Five‐year mortality in lithium‐treated manic‐depressive patients. J Affect Disord 1991;21:33–38. [DOI] [PubMed] [Google Scholar]
- 19. Jorgensen P, Mortensen PB. Cause of death in reactive psychosis. Acta Psychiatr Scand 1992;85:351–353. [DOI] [PubMed] [Google Scholar]
- 20. Sharma R, Markar HR. Mortality in affective disorder. J Affect Disord 1994;31:91–96. [DOI] [PubMed] [Google Scholar]
- 21. Ahrens B, Mulleroerlinghausen B, Schou M et al. Excess cardiovascular and suicide mortality of affective‐disorders may be reduced by lithium prophylaxis. J Affect Disord 1995;33:67–75. [DOI] [PubMed] [Google Scholar]
- 22. Nilsson A. Mortality in recurrent mood disorders during periods on and off lithium‐a complete population study in 362 patients. Pharmacopsychiatry 1995;28:8–13. [DOI] [PubMed] [Google Scholar]
- 23. Saku M, Tokudome S, Ikeda M et al. Mortality in psychiatric patients, with a specific focus on cancer mortality associated with schizophrenia. Int J Epidemiol 1995;24:366–372. [DOI] [PubMed] [Google Scholar]
- 24. Hiroeh U, Appleby L, Mortensen PB, Dunn G. Death by homicide, suicide, and other unnatural causes in people with mental illness: a population‐based study. Lancet 2001;358:2110–2112. [DOI] [PubMed] [Google Scholar]
- 25. Osby U, Brandt L, Correia N, Ekbom A, Sparen P. Excess mortality in bipolar and unipolar disorder in Sweden. Arch Gen Psychiatry 2001;58:844–850. [DOI] [PubMed] [Google Scholar]
- 26. Schneider B, Muller MJ, Philipp M. Mortality in affective disorders. J Affect Disord 2001;65:263–274. [DOI] [PubMed] [Google Scholar]
- 27. Angst F, Stassen HH, Clayton PJ, Angst J. Mortality of patients with mood disorders: follow‐up over 34–38 years. J Affect Disord 2002;68:167–181. [DOI] [PubMed] [Google Scholar]
- 28. Amaddeo F, Barbui C, Perini G, Biggeri A, Tansella M. Avoidable mortality of psychiatric patients in an area with a community based system of mental health care. Acta Psychiatr Scand 2007;115:320–325. [DOI] [PubMed] [Google Scholar]
- 29. Dutta R, Boydell J, Kennedy N, Vano J, Fearon P, Murray RM. Suicide and other causes of mortality in bipolar disorder: a longitudinal study. Psychol Med 2007;37:839–847. [DOI] [PubMed] [Google Scholar]
- 30. Osborn DP, Levy G, Nazareth I, Petersen I, Islam A, King MB. Relative risk of cardiovascular and cancer mortality in people with severe mental illness from the United Kingdom's General Practice Research Database. Arch Gen Psychiatry 2007;64:242. [DOI] [PubMed] [Google Scholar]
- 31. Hiroeh U, Kapur N, Webb R, Dunn G, Mortensen PB, Appleby L. Deaths from natural causes in people with mental illness: a cohort study. J Psycho Res 2008;64:275?283. [DOI] [PubMed] [Google Scholar]
- 32. Osborn D, Levy G, Nazareth I, King M. Suicide and severe mental illnesses. Cohort study within the UK general practice research database. Schizophr Res 2008;99:134–138. [DOI] [PubMed] [Google Scholar]
- 33. Chang CK, Hayes RD, Broadbent M et al. All‐cause mortality among people with serious mental illness (SMI), substance use disorders, and depressive disorders in southeast London: a cohort study. BMC Psychiatry 2010;10:77. [DOI] [PMC free article] [PubMed] [Google Scholar]
- 34. Hoang U, Stewart R, Goldacre MJ. Mortality after hospital discharge for people with schizophrenia or bipolar disorder: retrospective study of linked English hospital episode statistics, 1999–2006. BMJ 2011;343:5422. [DOI] [PMC free article] [PubMed] [Google Scholar]
- 35. Nordentoft M, Mortensen PB, Pedersen CB. Absolute risk of suicide after first hospital contact in mental disorder. Arch Gen Psychiatry 2011;68:1058–1064. [DOI] [PubMed] [Google Scholar]
- 36. Ajetunmobi O, Taylor M, Stockton D, Wood R. Early death in those previously hospitalised for mental healthcare in Scotland: a nationwide cohort study, 1986–2010. BMJ Open 2013;3:e002768. [DOI] [PMC free article] [PubMed] [Google Scholar]
- 37. Crump C, Sundquist K, Winkleby MA, Sundquist J. Comorbidities and mortality in bipolar disorder: a Swedish national cohort study. JAMA Psychiatry 2013;70:931–939. [DOI] [PubMed] [Google Scholar]
- 38. Hoang U, Goldacre MJ, Stewart R. Avoidable mortality in people with schizophrenia or bipolar disorder in England. Acta Psychiatr Scand 2013;127:195–201. [DOI] [PubMed] [Google Scholar]
- 39. Laursen TM, Wahlbeck K, Hallgren J et al. Life expectancy and death by diseases of the circulatory system in patients with bipolar disorder or schizophrenia in the Nordic countries. PLoS ONE 2013;8:e67133. [DOI] [PMC free article] [PubMed] [Google Scholar]
- 40. Westman J, Hallgren J, Wahlbeck K, Erlinge D, Alfredsson L, Osby U. Cardiovascular mortality in bipolar disorder: a population‐based cohort study in Sweden. BMJ Open 2013;3:e002373. [DOI] [PMC free article] [PubMed] [Google Scholar]
- 41. Hayes J, Prah P, Nazareth I et al. Prescribing trends in bipolar disorder: cohort study in the United Kingdom THIN primary care database 1995–2009. PLoS ONE 2011;6:e28725. [DOI] [PMC free article] [PubMed] [Google Scholar]
- 42. Alexander GC, Gallagher SA, Mascola A, Moloney RM, Stafford RS. Increasing off‐label use of antipsychotic medications in the United States, 1995–2008. Pharmacoepidemiol Drug Saf 2011;20:177–184. [DOI] [PMC free article] [PubMed] [Google Scholar]
- 43. Hert M, Correll CU, Bobes J et al. Physical illness in patients with severe mental disorders. I. Prevalence, impact of medications and disparities in health care. World Psychiatry 2011;10:52–77. [DOI] [PMC free article] [PubMed] [Google Scholar]
- 44. Cassidy F, Ahearn EP, Carroll BJ. Substance abuse in bipolar disorder. Bipolar Disord 2001;3:181–188. [PubMed] [Google Scholar]
- 45. Khalifeh H, Dean K. Gender and violence against people with severe mental illness. Int Rev Psychiatry 2010;22:535–546. [DOI] [PubMed] [Google Scholar]
- 46. Gonda X, Pompili M, Serafini G et al. Suicidal behavior in bipolar disorder: epidemiology, characteristics and major risk factors. J Affect Disord 2012;143:16–26. [DOI] [PubMed] [Google Scholar]
- 47. Post RM, Altshuler L, Kupka R et al. More pernicious course of bipolar disorder in the United States than in many European countries: implications for policy and treatment. J Affect Disord 2014;160:27–33. [DOI] [PubMed] [Google Scholar]
- 48. Kilbourne AM, Cornelius JR, Han X et al. Burden of general medical conditions among individuals with bipolar disorder. Bipolar Disord 2004;6:368–373. [DOI] [PubMed] [Google Scholar]
- 49. Rosenberg ML, Davidson LE, Smith JC et al. Operational criteria for the determination of suicide. J Forensic Sci 1988;33:1445–1456. [PubMed] [Google Scholar]
- 50. Saha S, Chant D, McGrath J. A systematic review of mortality in schizophrenia: is the differential mortality gap worsening over time? Arch Gen Psychiatry 2007;64:1123–1131. [DOI] [PubMed] [Google Scholar]