

Abstract
The stress-inducible chaperone protein HSP70 (HSPA1) is implicated in melanoma development and HSP70 inhibitors exert tumor-specific cytotoxic activity in cancer. In this study, we documented that a significant proportion of melanoma tumors express high levels of HSP70, particularly at advanced stages, and that phospho-FAK (PTK2) and BRAF are HSP70 client proteins. Treatment of melanoma cells with HSP70 inhibitors decreased levels of phospho-FAK along with impaired migration, invasion, and metastasis in vitro and in vivo. Moreover, the HSP70 inhibitor PET-16 reduces levels of mutant BRAF, synergized with the BRAF inhibitor PLX4032 in vitro and enhanced the durability of response to BRAF inhibition in vivo. Collectively, these findings provide strong support for HSP70 inhibition as a therapeutic strategy in melanoma, especially as an adjuvant approach for overcoming the resistance to BRAF inhibitors frequently observed in melanoma patients.
Keywords: HSP70, cancer, melanoma, PTK2/FAK, BRAF, metastasis, Vemurafenib
Introduction
Metastatic melanoma is an aggressive and usually fatal malignancy. Advanced melanomas have multiple oncogenic drivers, and despite advances with BRAF and immune checkpoint inhibitors, resistance to therapy is a significant problem (1). Given the incomplete efficacy and durability of current treatment options, and the enormous propensity of melanomas for resistance, there is an urgent need to identify new molecular targets for melanoma. In this work we test the hypothesis that the major stress-inducible heat shock protein 70 (also called HSP72 or HSPA1A but hereafter referred to as HSP70) might provide a novel therapeutic avenue, both alone and in combination with current therapies.
The HSP70 family has over ten members, many of which show tissue-specific expression and/or organelle-specific localization (2,3). In contrast to constitutively expressed forms like HSPA5 (Bip, GRP78), HSPA8 (HSC70) and HSPA9 (GRP75), all of which are required for cell viability, the major stress-induced form, HSP70, is expressed at extremely low levels in unstressed cells and is not required for life (4). Consequently, HSP70 inhibitors show tumor-selective cytotoxicity, with limited toxicity in normal, non-transformed cells (5). We have developed and characterized a series of HSP70 inhibitors, beginning with the ‘first-in-class’ compound, PES (2-Phenylethynesulfonamide, empirical formula C8H7NO2S, molecular weight 181.2). PES binds specifically to the lesser-conserved substrate-binding domain (SBD) of HSP70, and it does not bind to family members like BiP and GRP75, or to the chaperone HSP90 (6). We found that PES is broadly cytotoxic to cancer but not normal cells, and it markedly protects Eμ-myc mice from lymphoma, without any evidence of organ or general toxicity (6). Subsequently we have developed and characterized two derivatives of PES, called PES-Cl and PET-16, which show superior cytotoxicity and enhanced efficacy as anti-cancer agents, both in vitro and in vivo (7–9). The chemical structures of PES, PES-Cl and PET-16 are depicted (Supp. Fig. 1). Notably, silencing or deletion of HSP70 (HSPA1A/A1B) in tumor cells reduces the cytotoxicity of these compounds, supporting the premise that they are specific for HSP70 and not other family members (6,9). Mechanistically, these compounds are cytotoxic by virtue of their ability to inhibit proteasome function, alter the solubility and proper folding of HSP70 client proteins, and via their ability to inhibit autophagy, a cancer-critical survival pathway (6–8,10). We elucidated the mechanism of action of PES, PES-Cl and PET-16 using a combination of isothermal calorimetry and by solving the crystal structure of PET-16 bound to the SBD of the closely-related bacterial orthologue of HSP70, DnaK. These analyses revealed that PET-16 interacts with loop alpha-beta of the SBD, and functions as an allosteric regulator to prevent allosteric cycling of HSP70 (9). The specificity of PES derivatives for HSP70, and their efficacy on tumor lines in vitro, provided us a unique opportunity to study the role of this chaperone in melanoma.
In this work we conducted the first tumor micro-array of melanoma for HSP70, using an antibody specific for the major stress-induced form that does not cross reactive with other isoforms (11). We show that HSP70 is highly expressed in a large percentage of melanomas, and that expression of this protein increases with advanced stage. We use the technique of reverse phase protein array (RPPA) in melanomas to identify HSP70 client proteins, and identify pFAK and BRAF as two melanoma-relevant and specific client proteins of HSP70. We show that inhibition of pFAK using the HSP70 inhibitor PET-16 leads to decreased ability of melanomas to migrate, invade and metastasize in vivo. Additionally, we show that the V600E mutant form of BRAF, present in up to 50% of melanoma tumors, is a client of HSP70. Along these lines, we show that PET-16 synergizes with BRAF inhibitors, retains cytotoxicity in melanomas resistant to BRAF inhibitors, and extends the durability of treatment with BRAF inhibitors. These combined data augur well for the eventual use of HSP70 inhibitors for melanoma therapy.
Materials and Methods
Cell lines, treatments, and reagents
All human melanoma cell lines were obtained from the Wistar Institute collection, and were confirmed by genotyping. These cells were maintained in MCDB153 (Sigma)/Leibovitz’s L-15 (Cellgro) medium (4:1 ratio) supplemented with 2% FCS and 2 mM CaCl2. H1299 cells, B16-F10 and fibroblasts were obtained from the ATCC within six months of their use, and were maintained in DMEM (Invitrogen). The FS5 cell line, kindly provided by Ashani Weeraratna (Wistar) was maintained in RPMI 1640, and the Yumm1.7 cell line (kindly provided by Marcus Bosenburg, Yale University) was maintained in DMEM/F12 (Invitrogen). All the above media were supplemented with 10% fetal bovine serum (Invitrogen) and 100 U/ml penicillin and streptomycin. Cell stocks were fingerprinted using AmpFLSTR® Identifiler® PCR Amplification Kit from Life Technologies TM at The Wistar Institute Genomics Facility. PET-16 (Triphenyl(phenylethynyl)phosphonium bromide) (Sigma, catalog #S16773) and Vemurafenib/PLX4032 (S1267, Selleckchem) were prepared as 50 mM stock solutions in DMSO and stored at −80°C.
Western blotting, immunoprecipitation, shRNA
Western blotting was performed as described (7). Primary antibodies used in this study include HSP70 (4873S, Cell Signaling), anti-HA (3724, Cell Signaling), total FAK (EMD Millipore, 05-537), FAK Tyr-397-P (44-625G, Invitrogen), BRAF (sc-5284, Santa Cruz Biotechnology), and GAPDH (14C10, Cell Signaling, 2118). Secondary antibodies conjugated to Horseradish peroxidase were used at a dilution of 1:10,000 (Jackson Immunochemicals). ECL (Amersham, RPN2232) was applied to blots and protein levels were detected using autoradiography. Densitometry quantification of protein signals was performed using ImageJ software (NIH). For IP-westerns, 1000 μg of lysate was immunoprecipitated as described (12) with 0.5 ug of antisera to HSP70, followed by SDS-PAGE, transfer, and western analysis using antisera to total FAK, FAK Tyr-397-P and BRAF. The 1205Lu cell line with shRNA knockdown of PTK2/FAK was generated by infection with the lentiviral vector pLKO.1-puro carrying either of two shRNA sequences against human PTK2: shRNA (CCGGTCGAATGATAAGGTGTA; TRCN0000001620 and CAACAGGTGAAGAGCGATTAT; TRCN0000194984). Stable cells were selected using puromycin (1 μg/ml), and PTK2/FAK knockdown was confirmed by Western blot.
Cell Viability assays, drug synergy testing
Human melanoma cells were plated at 2,000 cells per well in 96-well plates. After 24 hours, cells were treated with serial dilutions of individual drugs or combinations of two drugs at a constant molar ratio. After 72 hours, cell viability was measured with Alamar blue (Life Technologies, DAL1025) using a SynergyHT plate reader (BioTek). Combination index (CI) values, established by the Chou–Talalay method (13), were calculated using the CompuSyn software package (CompuSyn). BRAF inhibitor resistant cells were generated by growing parental cells in the presence of 1 uM, 5 uM, or 10 uM PLX4720 for at least four passages. Resistance was confirmed by IC50 analysis.
Immunofluorescence, immunohistochemistry, Tumor tissue microarray
Immunofluorescence of fixed paraffin-embedded tissue sections was performed as previously described (14). The following primary antibodies were used: FAK Tyr-397-P (44-625G, Invitrogen), FAK Tyr-397-P (700255, Life Technologies), SQSTM1/p62 (ab56416, Abcam), SQSTM1/p62 (sc-28359, Santa Cruz Biotechnology). Tissue microarrays (TMAs) containing 0.9 mm cores of 77 nevi, 8 in-situ, 50 invasive and 103 metastatic malignant melanomas constructed at the Fox Chase Cancer Center (Philadelphia, USA); full details about these samples are previously described (15). Paired melanoma tissue specimens before and after Vemurafenib treatment were obtained at the Abramson Cancer Center. All samples were procured under approved IRB protocols at the relevant institution. The HSP70 monoclonal antibody (1:100; Cell Signaling Technology, 4873S) is specific for the major stress-induced form of HSP70, and does not cross react with other family members (11). This was incubated with the tissue after heat-induced epitope retrieval with citrate buffer (pH 6.0). The samples were incubated with primary antibody overnight followed by incubation with a biotinylated secondary antibody (Jackson Immuno Research; 1:200) for 30 min. Detection was performed using Nova Red for 15 minutes and the slides were counterstained with hematoxylin (Fisher Scientific, Pittsburgh, PA). Immunohistochemical stain for HSP70 was interpreted semi-quantitatively by assessing the intensity and extent of staining on the tissue sections present on the slides according using the H-Score method as previously described (16). HSP70 expression was scored in blinded manner by a board certified dermatopathologist (Xiaowei Xu, University of Pennsylvania).
Organotypic 3D Skin Reconstructs
Human skin reconstructs were generated as previously described (17). Briefly, dermal reconstructs consisted of rat tail type I collagen contracted for 4 days with embedded dermal fibroblasts (7.5 × 10⁴ per dish) before seeding 1205Lu cells (0.83 × 10⁵) together with keratinocytes (4.17 × 10⁵) on top of the dermal reconstructs over an 4-day period in media before air exposure until day 18 to allow epidermal differentiation. During the last 7 days skin reconstructs were treated with DMSO or PET-16 that were added to the medium. At day 18, skin reconstructs were harvested and fixed in 10% neutral buffered formalin for 2–3 hours, embedded into paraffin, sectioned (5 μm), then stained with Hematoxylin and Eosin.
Reverse phase protein array (RPPA)
Triplicate samples of WM793 and 1205Lu cells were treated with vehicle, 1 μM, 3 μM, 5 μM and 10 μM PET-16 for 24 hours. Following standard protocols of the RPPA Core Facility at MD Anderson Cancer Center (Houston, TX), cells were lysed on ice, and lysates cleared by centrifugation and denatured in SDS sample buffer, then submitted for analysis as described (18,19). The pair-wise group comparisons were done using two-sample t-test and the Benjamini-Hochberg method was used for correction for multiple testing. Proteins that for a PET-16 concentration passed FDR<5% in both cell lines, and fold change > 1.2 threshold in at least one cell line were considered significantly differentially expressed. Data were visualized as expression heatmaps using Microsoft Excel.
Wound healing, invasion, Transwell migration assay
For wound healing assays melanoma cells were seeded in 24-well plates and grown to 90 – 95% confluency. Subsequently, a scratch was placed in the middle of the well with a sterile 200μl pipette tip. After washing once with serum-free media, the respective treatments were performed. Media with DMSO was added to control wells and media with different drugs was added to respective wells before starting the time-lapse imaging. The concentrations of drug used were shown not to induce cell death using live/dead staining (Calcein/PI, Sigma Aldrich). Images were captured every 15 minutes for 72 hours. Each reading was performed in triplicate. For transwell migration assays, 6-well transwell assay dishes (3414, Corning Life Sciences) were used to examine the migration of melanoma cells. 1205Lu cells were pre-treated with PET-16 for 24 hours, and then seeded onto the filters in serum free media at 20 × 104 cells/well. Media containing 20% FCS was placed in the lower well to act as a chemo-attractant. Following a 24-h incubation period at 37°C, the inserts were removed and washed three times in phosphate-buffered saline (PBS). Cells remaining on the upper surface of the insert (non-migrated cells) were removed gently using a cotton swab, and cells on the lower surface were stained with Differential Quick Stain Kit (24606-250, Polysciences, Inc.). After staining, inserts were rinsed three times by dipping into PBS and left to air-dry. Colored cells that had migrated through the pores of the polycarbonate membrane were visualized using a Nikon Eclipse E600 microscope.
Experimental lung metastasis, allograft and xenograft models
All animal experiments were approved by the Institutional Animal Care and Use Committee (IACUC) and were performed in an Association for the Assessment and Accreditation of Laboratory Animal Care (AAALAC) accredited facility. B16-F10 cells were pre-treated with DMSO, 3 μM PES-CL or 3 μM PET-16 for 24 hours and were injected (2.5×10⁵ cells/100 μl PBS) into the tail vein of C57BL/6 mice (The Jackson Laboratory, Bar Harbor, ME). At day 7 weekly intra-peritoneal injections with DMSO vehicle, 20 mg/kg PES-CL or 5mg/kg PET-16 were initiated in randomly assigned groups of 10 mice for each treatment arm (n=10). After 3 weeks, the mice were euthanized, the lungs were harvested, photographed and embedded in paraffin for further immunohistochemical analysis. For the allograft model, 1×10⁶ of pooled, transfected Yumm1.7 mouse melanoma cells engineered to express high level of HSP70 versus a parental cell line were subcutaneously injected into the right flank of C57Bl/6 mice. For the next 20 days tumor burden was monitored twice a week by volume calculation using caliper measurements. For the xenograft model, 5×10⁵ of 1205Lu human melanoma cells were subcutaneously injected into the right flank of female NOD.Cg-Prkdcscid Il2rgtm1Wjl/SzJ (NSG) mice at a Matrigel®/culture medium ratio of 1:1. When tumors reached an average tumor volume of ~120–200 mm³ animals were randomized into treatment groups. Mice were treated with (i) PET-16 (5mg/kg per i.p. injection twice a week, n=10), (ii) Vemurafenib/PLX4720 (200 mg/kg of PLX-containing chow, n=10), (iii), Vemurafenib/PLX4720 (200 mg/kg of PLX-containing chow) plus [5 mg/kg] PET-16 (n=10) and (iv), with PET-16 (10mg/kg per i.p. injection twice a week, n=5). Buffered saline (n=10) and normal chow served as vehicle controls. Tumor growth was measured every 3–4 days using calipers; tumor volumes were calculated according to the formula V=(L×W×W)/2[mm³], where V is tumor volume, L is tumor length, W is tumor width. At day 27 the study was completed, and the tumors were harvested and embedded in paraffin for further immunohistochemical analysis.
Statistical analysis of data
For in vitro studies, the student’s t test was performed using at least three independent experiments. For animal experiments, tumor weight was compared using t-test between two groups. The effect of treatment on the change of tumor volume was examined using mixed model analysis. For TMA scores from human tissues, the Wilcoxon rank sum test was used to compare TMA scores between melanoma and nevi. Cuzik’s trend test was used to examine the trend of TMA scores from the tissues without melanoma to tissues with different stage of melanoma. Paired t-test was used to compare TMA scores between pre- and post-therapy. A p value<0.05 was considered significant.
Results
HSP70 is markedly overexpressed in metastatic melanoma
There are some reports that show that HSP70 (HSPA1A/B) is overexpressed in melanoma, and may be associated with drug-resistant melanoma (20–22). However to date no studies have performed a comprehensive staining for the major, heat shock inducible form of HSP70 protein in melanoma tumors versus benign nevi. Toward this end we used an HSP70 monoclonal antibody specific for the cytosolic stress-induced form of this protein, and not cross-reactive with other family members, in order to stain a tissue microarray (TMA) composed of 77 nevi, 8 melanoma in situ, 50 invasive primary melanomas, and 103 metastatic melanomas. There was a statistically significant difference in HSP70 staining in melanomas compared to nevi (mean +/− SD score melanoma versus nevi p=0.0003; Figure 1A–C). Additionally, there was a significant correlation between HSP70 expression and increasing stage of cancer, and the highest median scores for HSP70 were in metastatic melanoma (Cuzik’s trend test p<0.0001; Figure 1D).
Figure 1. HSP70 is overexpressed in melanoma, plays a role in melanoma progression/prognosis, and plays a role as a driver of melanoma tumorigenesis.
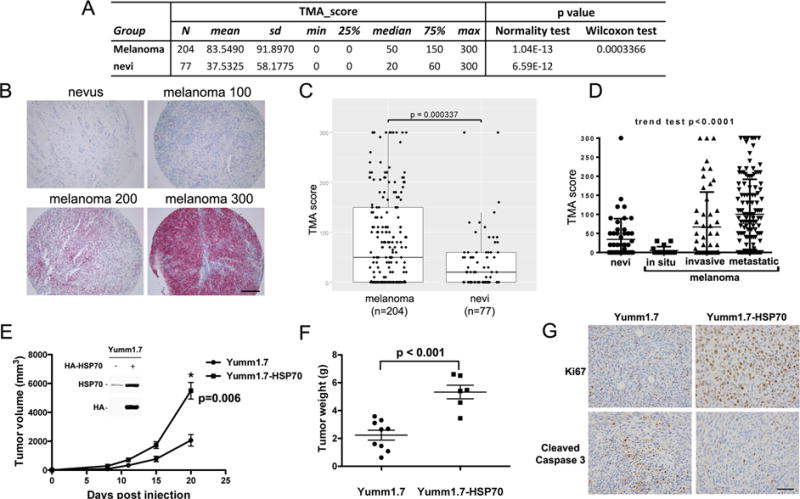
A. Description of data from the tissue microarray samples from 204 patients with melanoma and 77 patients with benign nevi, analyzed by immunohistochemistry for HSP70. The difference in HSP70 immuno-staining in benign nevi versus melanoma is significant (p<0.0004)
B. Examples of negative (0, nevus) and positive samples (scored as 100, 200 and 300) stained for HSP70. Samples were stained and scored in blinded manner.
C. Scatter plot analysis of the melanoma and benign nevi HSP70 scores from 0–300 in the TMA. The Wilcoxon rank sum test was used to compare TMA scores between all melanoma and nevi.
D. TMA scores for HSP70 in different stages of melanoma (nevus, melanoma in situ, invasive melanoma, and metastatic melanoma). Cuzik’s trend test was used to examine the trend of TMA scores over the level of malignancy. A positive trend with increased HSP70 expression with increasing malignancy was observed (p<0.0001).
E. Yumm1.7 cells were stably transfected with vector alone or CMV-driven HA-tagged HSP70. Equal numbers of pooled transfected cells were injected subcutaneously into the flank of C57Bl/6 mice and tumor volume was assessed over time. The mean tumor volumes are depicted over time; n=5 mice per cell line. The data are representative of results in two independent clones of each cell line. The error bars mark standard error. Inset: Western analysis for HSP70, and using HA antibody and HSP70 antibody.
F. Scatter plot analysis of final tumor weights at day 20 from Yumm1.7-vector and Yumm1.7- HSP70 cell lines. The error bars mark standard error of measurement.
G. Immunohistochemical staining for Ki67 and Cleaved Caspase 3 in the tumors isolated from mice described in (E, F). Samples shown are representative of multiple independent tumors. Scale bar = 100 μm.
We next determined whether HSP70 mRNA levels correlated with patient survival using the program PrognoScan, which analyzes expression data and survival information from the TCGA database (23). This analysis revealed that in 38 melanoma samples, the increased level of HSP70 mRNA was significantly associated with poorer survival (p=0.001, Supp. Figure 2). This association did not hold true for other family members (not shown). These data support the assignment of HSP70 as a potential marker of melanoma aggressiveness, but they do not reveal whether HSP70 overexpression is a driver, or a consequence, of melanoma progression. To address this issue, we generated matching melanoma cell lines that express low and high levels of HSP70, and compared their tumorigenic properties. Specifically we obtained the Yumm1.7 murine melanoma cell line generated from the BRAF-V600E/PTEN conditional knockout mouse (24). This cell line expresses modest levels of HSP70, and it was used to create pooled subclones that express high levels of HA-tagged HSP70 (Yumm1.7-HSP70; Figure 1E inset). Parental Yumm1.7 and HSP70-overexpressing cell lines were injected into C57Bl/6 mice as xenografts, and tumor volume was assessed over time. Notably, there was a marked increase in melanoma growth rate, tumor volume, and tumor weight in two independent lines that overexpress HSP70 compared to vector-alone controls (Figure 1E and F). We also noted increased Ki67 staining, indicative of proliferating cells, as well as decreased staining for cleaved caspase-3, a marker of apoptotic cells, in tumors that overexpress HSP70, relative to parental controls (Figure 1G). These data support HSP70 as a significant driver of melanoma growth and progression.
Phospho-FAK and BRAF-V600E are ‘clients’ of HSP70
To determine the underlying mechanism whereby increased HSP70 is associated with melanoma tumorigenesis, we sought to identify melanoma-relevant ‘client’ proteins for HSP70. In this case we define a ‘client’ protein as one whose solubility/folding requires HSP70, and that interacts with HSP70. To identify these we first used the technique of reverse phase protein arrays (RPPA; (19,25)) in order to identify proteins whose signal was decreased following 24 hr treatment with different concentrations of PET-16. This analysis revealed 34 proteins that showed significantly decreased expression in two different cell lines at several different doses of PET-16 after 24 hours, representing candidate HSP70 client proteins (Supp. Figure 3). Expression for six of these proteins that had a FDR <5% in both cell lines and a fold change > 1.5 are depicted (Figure 2A). Of these six, we selected two for further analysis due to their significance to melanoma and metastasis: these were phospho-FAK (p-FAK/PTK2) and BRAF. Western analysis to confirm RPPA results revealed a marked decrease in the level of p-FAK (Y397) and BRAF following 24 hr of PET-16 treatment in three different melanoma lines with mutant (1205Lu and WM793) and wild type (WM852) BRAF (26) (Figure 2B). To confirm this finding, we performed immunofluorescence for p-FAK in PET-16-treated cells. This analysis revealed a dramatic loss of p-FAK staining in WM793 and WM852 cell lines after PET-16 treatment (Figure 2C); notably, this loss of p-FAK staining was evident after as little as 2 hr exposure to PET-16 (Anna Budina-Kolomets, unpublished data). Immunoprecipitation-western blot analysis confirmed that both p-FAK and BRAF were detectable in a complex with HSP70 (Figures 2D and E and Supp. Fig. 4A). These analyses confirm p-FAK and BRAF as HSP70 client proteins.
Figure 2. Identification of phospho-FAK (p-FAK, Y397) and BRAF as novel HSP70 ‘client’ proteins.
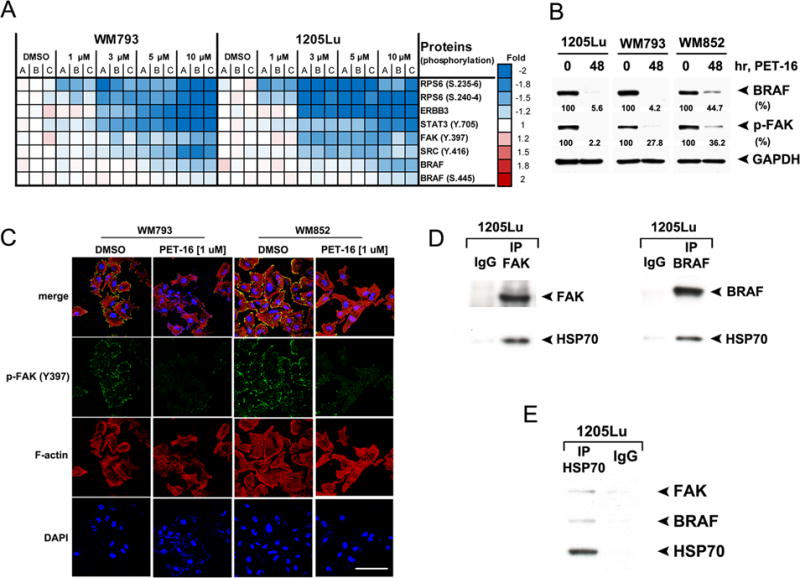
A. WM793 and 1205Lu cells (mutant BRAF) were treated with DMSO or with the indicated concentrations of PET-16 for 24 hours and then subjected to RPPA analysis. The heat map visualizes expression levels for melanoma-related proteins with significantly reduced expression following PET-16 treatment. A, B and C are individual samples from three independent experiments.
B. Melanoma cell lines 1205Lu, WM793 and WM852 were treated with DMSO or 20 μM PET-16 for 48 hours. Whole cell lysates were then subjected to immunoblot analysis for BRAF and p-FAK. GAPDH is included as a loading control. Densitometric quantification of BRAF and p-FAK levels is shown below.
C. Immunofluorescence analysis of WM793 and WM852 cells treated with DMSO or 1 μM PET-16 for 24 hours, immunostained with antisera to p-FAK (Y-397) followed by fluorescent secondary, along with fluorescent-labeled phalloidin (red) and DAPI (blue). Scale bar = 100 μm.
D. Immunoprecipitation with FAK antibody (left panel), BRAF antibody (right panel) or equal amount of IgG followed by western analysis for the level of associated HSP70 in 1205Lu cells.
E. Immunoprecipitation with HSP70 antibody or equal amount of IgG followed by western analysis for the level of associated FAK and BRAF in 1205Lu cells.
HSP70 inhibitors block melanoma migration, invasion, and metastatic capability
Given the role of FAK (particularly the auto-phosphorylated, activated p-Y397 form) in tumor invasive phenotypes, we next sought to assess the impact of PET-16 on migration and invasion. We first performed conventional “scratch-wound” assays where-in the ability of tumor cells to migrate and fill in an area is assessed by time lapse microscopy. For these studies we were careful to use concentrations and timepoints of PET-16 treatment were not cytotoxic, and which did not inhibit cell proliferation (Supp. Fig. 4B and C). These scratch-wound assays revealed that after PET-16 treatment, the ability of 1205Lu cells to migrate and fill in a wound was markedly impaired (Figure 3A). By 48 hours, the DMSO control sample was completely filled in, while the PET-16 sample was less than 50% completed (Figure 3B). Time-lapse microscopy confirmed that PET-16 treated cells continued to proliferate, while ceasing to migrate (See Supplemental Movie). To extend this finding we performed transwell migration assays. Again, at doses that are non-cytotoxic or cytostatic, we noted significantly impaired migration of 1205Lu cells following treatment with PET-16 (Figure 3C).
Figure 3. The HSP70 inhibitor PET-16 inhibits melanoma migration and invasion.
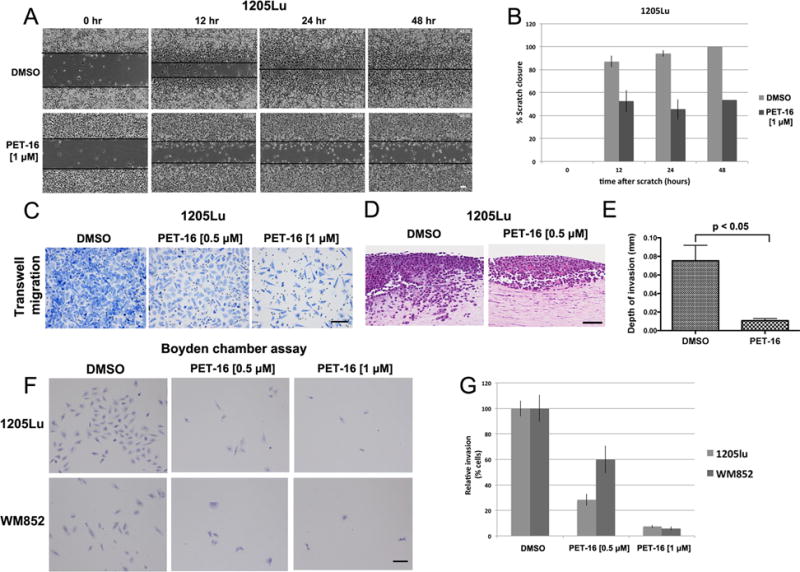
A. 1205Lu cells were seeded and allowed to form a confluent monolayer. Cells were scratched with a pipet tip and treated with DMSO or 1 μM PET, and then imaged at 0, 12, 24 and 48 hours. Scale bar = 100 μm.
B. Quantification of the percentage of scratch closure in (A) at 0, 12, 24, 48 hours in DMSO versus PET-16 treated cells. The data depicted represent the combined results from three independent experiments. The error bars mark standard error of the mean.
C. Representative images of transwell migration assay of 1205Lu cells pre-treated with DMSO or the indicated doses of PET-16 for 24 hours. Equal number of cells was loaded into the upper chamber of the transwell, incubated for 24 hours and the migrated cells were stained and imaged on the lower surface of the membrane. Scale bar = 100 μm.
D. Organotypic 3D skin reconstructions consisting of normal human fibroblasts, 1205Lu melanoma cells, and normal human keratinocytes were generated and treated with DMSO or 0.5 μM PET-16 for 1 week. Representative hematoxylin and eosin (H&E) staining of melanoma cells treated with DMSO or PET-16 are shown. Scale bar = 100 μm.
E. The invasion depth of 1205Lu melanoma cells in (D) was measured in five random fields of each of the skin reconstructs using ImageJ software, with the dermo-epidermal junction as a starting point. Error bars mark standard deviations.
F. Boyden chamber invasion assay of 1205Lu and WM852 cells pre-treated with DMSO or the indicated doses of PET-16 for 24 hours. Equal numbers of cells were seeded in the Boyden chamber and incubated for 24 hours; the cells that invaded through the Matrigel were stained. Scale bar = 100 μm.
G. The number of invaded cells from (F) was evaluated in five different fields for each experimental group and averaged. All values were normalized to the DMSO control; data are the averaged results of three independent experiments. Error bars mark the standard deviations.
We next assessed the impact of low doses of PET-16 on the ability of metastatic melanoma to invade in three dimensional (3D) skin reconstructions. The skin reconstructions recapitulate human skin by including keratinocytes, fibroblasts and melanoma cells, embedded in a collagen matrix (17). Highly invasive melanoma tumors then invade into the fibroblast/collagen matrix, reminiscent of the actual scenario in the skin. Skin reconstructs made with the 1205Lu melanoma and treated with DMSO showed extensive ability to invade into the fibroblast layer (Figure 3D, left panel). In contrast, 1205Lu cells treated with 0.5 μM PET-16 failed to invade (right panel). The depth of invasiveness in multiple skin reconstructs was measured, and the difference in invasiveness between DMSO and PET-16 treated cells was highly significant (0.08 mm versus 0.01 mm, p<0.05; Figure 3E). Similar findings were made in the primary melanoma line FS5 (Supp. Fig. 4D). Boyden chamber assays were then used to measure the ability of melanoma cells to migrate and invade through a collagen matrix. These assays confirmed that melanoma invasiveness is markedly impeded by PET-16 (Figure 3F and G). Time course analyses indicated that invasion of 1205Lu cells was impaired after as little as two hours of incubation with PET-16 (Supp. Fig. 4E and F). We next sought to determine whether the inhibition of invasiveness by PET-16 was due to the specific inhibition of p-FAK. To address this, we silenced FAK in 1205Lu cells using either of two different short hairpins, and assessed the ability of PET-16 to inhibit invasion. As expected, silencing of FAK with either of two short hairpins (Supp. Fig. 4G) markedly diminished the ability of cells to invade in Boyden chamber assays (Figure 4A and B). Notably, however, silencing FAK diminished the ability of PET-16 to further inhibit invasion, and the percent inhibition of invasion by PET-16 was markedly greater in shControl cells, compared to shFAK (p=0.005, Figure 4B and C). These data point to FAK as a significant target for the ability of PET-16 to inhibit melanoma invasion and migration.
Figure 4. FAK is required for the ability of PET-16 to inhibit melanoma invasiveness.
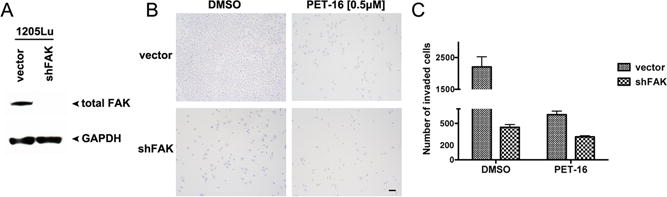
A. Western blot analysis of the level of total FAK in pooled 1205Lu cells infected with a lentiviral control vector (shControl) or a short hairpin directed at FAK (shFAK). The level of GAPDH serves as a loading control.
B. Boyden chamber invasion assay of 1205Lu cells described in (A) treated with DMSO or 0.5 μM of PET-16 for 24 hours. Equal numbers of cells were seeded in the Boyden chamber and incubated for 24 hours. After 24 hours the cells invaded through the Matrigel were stained. Scale bar = 100 μm.
C. The number of invaded cells from (B) was quantified in five different fields for each experimental group and averaged. Data are the averaged results of three independent experiments. The error bars mark the standard error. The difference in percent inhibition of invasion by PET-16 in Vector and shFAK cell lines is highly significant (p=0.005).
We next sought to assess the ability of HSP70 inhibitors to inhibit melanoma metastasis. To do this, we utilized the B16-F10 melanoma cell line, which is commonly used in metastasis assays because it is pigmented and easy to track as lung metastases after tail vein injection. We first established the IC50 for PET-16 and PES-Cl in the B16-F10 cell line. We found that this cell line shows an IC50 of 15.5 μM and 17.5 μM for PES-Cl and PET-16, respectively (Supp. Fig. 5A and B). We pre-treated B16-F10 cells for 24 hrs with dilution vehicle alone, or 3 μM of either PES-Cl or PET-16; this low dose caused no loss of cell viability of B16-F10 cells, even when cells were treated every other day for 10 days (Supp. Fig. 5C). Cells were treated for 24 hours and then injected into the tail veins of C57Bl/6 mice; after one week, mice were treated once per week with intra-peritoneal doses of dilution vehicle, PES-Cl (20 mg/kg) or PET-16 (5 mg/kg) (Figure 5A). After three treatments, we analyzed the lungs of these mice for the number and size of metastases. Treatment with DMSO resulted in lungs that were full of melanoma tumors after three weeks (Figure 5B). However, treatment with either PES-Cl or to a greater extent PET-16 resulted in a profound reduction in the number and volume of metastases in mice. This was evident visually by melanin pigment (Figure 5B), and by hematoxylin and eosin staining of sectioned lungs (Figure 5B lower panels). Quantification of metastases in PES-Cl and PET-16-treated mice revealed a marked decrease in metastases in these mice, compared to control (Figure 5C). Immunofluorescent staining of the melanoma tumors in treated mice revealed that phospho-FAK staining was markedly reduced in the tumors of treated mice, confirming that the drugs reached these tumors (Figure 5D). We confirmed that the autophagy scaffold protein p62SQSTM1, which accumulates and aggregates following PET-16 treatment, showed accumulation in the tumors of treated mice, especially in mice treated with PET-16 (Supp. Fig. 5D and E).
Figure 5. Inhibition of metastasis by the HSP70 inhibitors PES-Cl and PET-16.
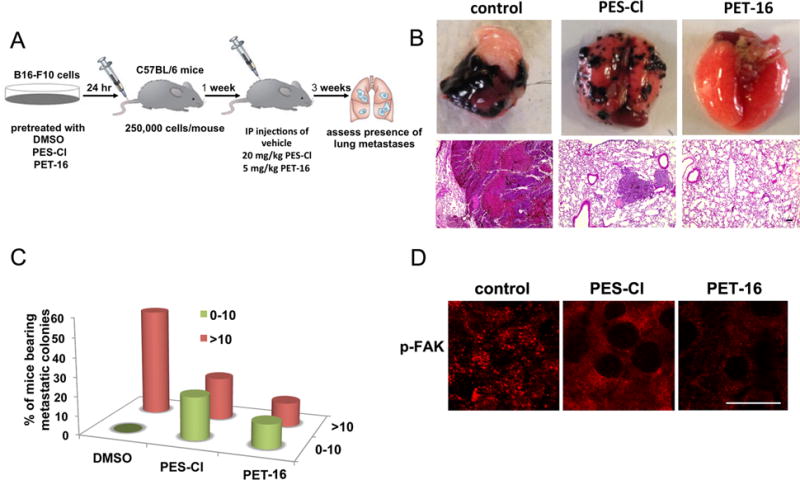
A. Schematic representation of the metastasis assay. B16-F10 cells were pretreated with DMSO or 3 μM PES-Cl or PET-16 for 24 hours. After 24 hours cells were monitored for viability by live/dead assay and 2.5×10⁴ viable cells were injected into the tail vein of C57Bl/6 mice. At day 7, weekly treatment was initiated with PES-Cl and PET-16 at the doses indicated. After 3 weeks mice the lungs of mice were assessed for the presence of metastatic nodules.
B. Representative images of lung metastases (top panel) and hematoxylin and eosin staining (bottom panel) from C57Bl/6 mice following treatment with vehicle, PES-Cl or PET-16. Scale bar = 100 μm.
C. Graphical representation of the data from B, where-in lungs were scored in blinded manner for metastases (n=10 mice/group).
D. Immunofluorescence analysis for phospho-FAK (pTyr-397) in the lungs from mice described in (A). Scale bar = 15 μm.
The HSP70 inhibitor PET-16 synergizes with BRAF inhibitors in vitro, and enhances the efficacy of BRAF inhibition in vivo
In addition to p-FAK, our data indicated that BRAF is a client of HSP70. To explore this further we obtained 5 matched pairs of melanoma biopsy samples from patients, prior to treatment with the BRAF inhibitor Vemurafenib (pre-therapy), and after resistance and relapse from therapy (post-therapy). These matched samples were stained with HSP70 antibody and scored in a blinded manner. Notably, in all five matched samples, the level of staining of HSP70 (red stain) increased significantly following the emergence of resistance (Figure 6A), in a manner that was statistically significant (p<0.05, Figure 6B). To extend this finding, we next assessed the IC50 for the BRAF inhibitor Vemurafenib (PLX4032) in the presence and absence of PET-16. At a constant molar ratio of 10:1 (PET-16:PLX4032), the IC50 for PLX4032 decreased 4-fold and 8-fold, respectively, in 1205Lu and WM35 cells, suggesting that these two drugs cooperate (Figure 6C and D). We next assessed synergy using the combination index analysis in five different melanoma cell lines with mutant BRAF, as per (13). Notably, there was evidence for synergy of PET-16 and PLX4032 in all five cell lines, and there was strong synergy (cI<0.5) in two lines, WM35 and WM164 (Figure 6E). Synergy was evident at several different ratios of each drug (Supp. Table 1), and was consistent using an independent assay for cell viability (Trypan Blue, Supp. Fig. 7C). Recent studies indicating that other autophagy inhibitors can synergize with BRAF inhibitors, mediated by the induction of ER stress (27); however, we found limited evidence that PET-16 causes significant ER stress in melanoma (Supp. Figure 6).
Figure 6. The HSP70 inhibitor PET-16 is efficacious as a single agent for melanoma, and synergizes with the BRAF inhibitor Vemurafenib.
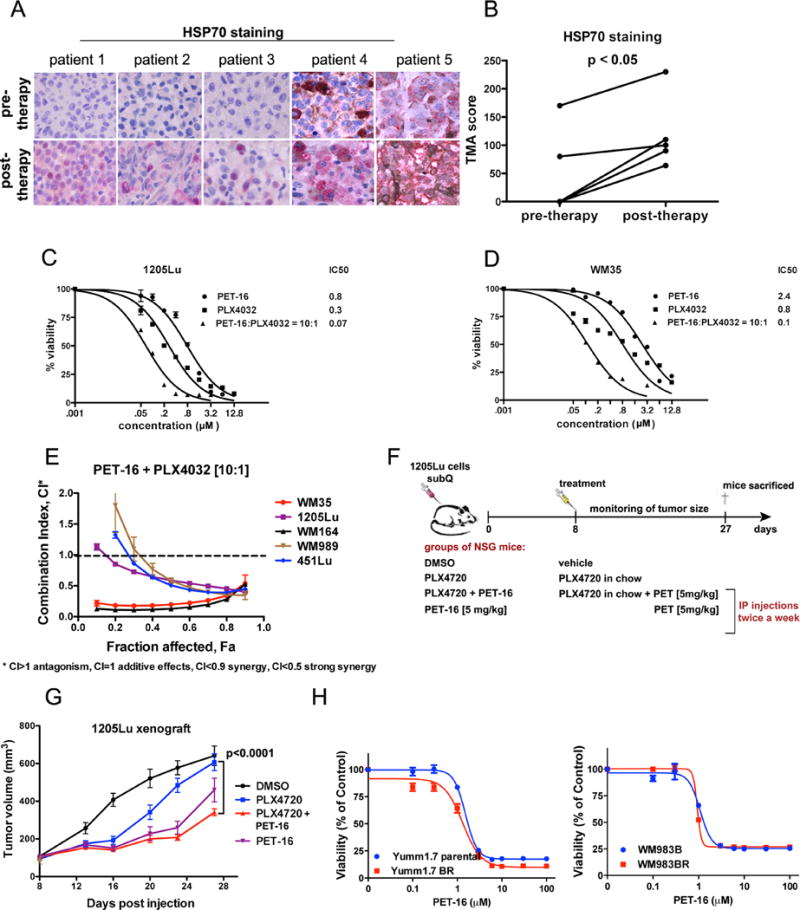
A. Immunohistochemical staining of HSP70 in 5 different matched melanoma patient samples prior to therapy with Vemurafenib, and after the development of resistance (post-therapy). Red stain = HSP70.
B. HSP70 expression in samples from (A) was scored according to its intensity and the number of cells expressing the protein. The paired t-test was used to compare HSP70 staining at pre- and post-therapy.
C. Cell viability analysis of 1205Lu melanoma cells treated with DMSO or the indicated doses of PET-16, PLX4032 or a combination PET-16:PLX4032 (molar ration 10:1) for 72 hours. The data depicted are the averaged results of 3 independent experiments. Error bars indicate standard deviations.
D. Cell viability analysis of WM35 melanoma cells treated with DMSO or the indicated doses of PET-16, PLX4032 or a combination PET-16:PLX4032 (molar ration 10:1) for 72 hours. The data depicted are the averaged results of 3 independent experiments. Error bars indicate standard deviations.
E. Cell viability analysis of 1205Lu, WM35, WM164, WM989 and 451Lu cell lines with combinations of PET-16 and PLX4032 at fixed 10:1 molar ratios. Data were analyzed using CompuSyn software and combination index (CI) values were established using the Chou–Talalay method. This drug combination resulted in significant synergistic cytotoxic effects as indicated by their combination index CI < 1. The data depicted are averaged from 3 independent experiments. Error bars mark standard deviation.
F. Experimental design to assess the efficacy of PET-16 for xenografts of melanoma, alone and in combination with PLX4720 (in mouse chow).
G. Tumor volume analysis in 1205Lu xenograft tumors starting at day 8 when tumor formation had initiated. A statistically significant decrease in tumor volume was noted by combined treatment with PET-16 and PLX4720, compared to PLX4720 alone. Error bars represent standard error.
H. Cell viability analysis of parental Yumm1.7 (left panel) and WM983B (right panel) melanoma cells and their sublines with in vitro acquired resistance to vemurafenib treated with DMSO or the indicated doses of PET-16 for 72 hours. The data depicted are the averaged results of 3 independent experiments. Error bars indicate standard deviations.
It next became logical to test the efficacy of combination therapy using these two compounds. Toward this end we analyzed sub-cutaneous tumors from the 1205Lu cell line in immunocompromised mice; this cell line was chosen because it shows only moderate sensitivity to BRAF inhibition (28). Forty mice were injected sub-cutaneously with 1205Lu cells and tumors were allowed to engraft for eight days, after which mice were randomly separated into four groups. Each group of ten mice was treated twice weekly with intra-peritoneal doses of dilution vehicle alone, PET-16 (5 mg/kg), PLX4720 in chow (PLX4032 is the clinical analogue of PLX4720), or the combination of PET-16 (5 mg/kg) plus PLX4720 in chow (Figure 6F). There were linear increases in tumor volume in DMSO-treated mice, while PLX4720 led to an initial decrease in tumor volume, followed by waning anti-tumor efficacy with time (blue line, Figure 6G). Addition of low dose (5mg/kg) PET-16 greatly enhanced the efficacy of PLX4720 (p<0.0001 comparing PLX4720 vs. PET-16 (5mg/kg) plus PLX4720; Figure 6G, red line). Immunofluorescence and IHC analyses confirmed markedly decreased p-FAK and BRAF staining in PET-16-treated tumors (Supp. Fig. 7A and B). We did not observe any weight loss or signs of toxicity for any of these treatment arms (A. Budina-Kolomets, unpublished data). As a final confirmation of the usefulness of PET-16 for melanoma treatment, we analyzed the efficacy of this compound in tumors with acquired resistance to BRAF inhibitors. We found no difference in the cytotoxicity of PET-16 in tumor cells resistant to PLX4032, compared to parental tumor lines (Figure 6H). These data support the use of HSP70 inhibitors for melanoma therapy.
Discussion
It is well established that one of the best markers for the detection of tumor versus normal cells is the stress-induced heat shock protein HSP70 (5). In this study we chose to focus on HSP70 and melanoma, due to the enormous propensity in this tumor type for aneuploidy and mutation, both of which lead to considerable proteotoxic stress (29). Currently the role for HSP70 in melanoma is not clear. Two studies showed that HSP70 overexpression occurs in melanoma and is associated with BRAF mutation (20) and drug resistance (21). In contrast, another study found high levels of HSP70 associated with improved prognosis, especially in patients with tumors greater than 1.5 mm in size (22). In this study we provide evidence that HSP70 supports melanoma progression. We show that HSP70 overexpression causes increased tumor proliferation and decreased apoptosis, and that this protein shows the highest expression in metastatic melanoma. The reasons for the discrepancies regarding the role of HSP70 in melanoma are unclear, but may reflect the fact that this protein can localize to different compartments in the cell. When HSP70 localizes to cytosolic, nuclear and lysosomal compartments, it promotes cancer progression; alternatively this protein can be extra-cellular, and promote anti-tumor immunity (30).
One consistent finding among multiple groups is that silencing or inhibiting HSP70 in melanoma cell lines and other tumors leads to senescence and apoptosis (7,31–34). Both a peptide aptamer that binds and inhibits this chaperone (35) and a small molecule inhibitor of HSP70 (36) have shown anti-cancer efficacy in an allograft model of mouse melanoma. HSP70 is an obligate co-chaperone for HSP90, and targeting HSP90 has shown significant promise in the treatment of melanoma (37,38). Therefore, HSP70 is a compelling new therapeutic target for this tumor. The group of Garrido showed previously that a peptide-aptamer inhibitor of HSP70 was efficacious against the murine melanoma allograft model B16-F10, grown subcutaneously. Interestingly, in the tumors of treated mice, this group noted that regression of the tumors was accompanied by significant immune cell infiltration (35). To explore this same possibility, we analyzed PET-16-treated melanoma tumors, and found that these treated tumors also showed marked accumulation of leukocytes infiltrating the tumors, compared to the vehicle controls (Supp. Fig. 5F, arrows). These data indicate that HSP70 inhibitors may affect immune cell recruitment, and they support the testing in pre-clinical models of combinations of HSP70 inhibitors with immune checkpoint antibodies. We are currently pursuing this avenue.
In this work we show that pFAK is a novel HSP70 client protein, and that inhibition of p-FAK by PET-16 explains part of the mechanism for reduced invasiveness following HSP70 inhibition. We should note however that two other proteins implicated in melanoma metastasis were identified in our RPPA assay as down-regulated following PET-16 treatment: ERBB3 and FOXM1 (39,40) (Supp. Fig. 3). Therefore it remains formally possibly that the inactivation of these proteins also contributes to the ability of PET-16 to inhibit melanoma metastasis. We also find that mutant B-RAF is an HSP70 client protein, and that treatment of tumor cell lines in vitro and in vivo leads to markedly decreased expression of mutant B-RAF. Further, we find that PET-16 synergizes with PLX4032 in five different melanoma cell lines, and that PET-16 improves the durability of response to BRAF inhibition. There are two possible explanations for this synergy. The first is that PET-16 and BRAF inhibit BRAF in parallel. The second is that common mechanisms for resistance to BRAF inhibitors include overexpression of AKT, mTOR, C-RAF and RB (41); these were all identified as HSP70 client proteins in our RPPA analysis (Supp. Figure 3). The emergence of resistance to BRAF inhibitors is a significant clinical problem, so the identification of compounds like PET-16 is an important advance.
Supplementary Material
Acknowledgments
We thank Gao Zhang and Meenhard Herlyn for help with the RPPA analysis, and members of the Murphy laboratory (Pat Kung and Subhasree Basu) for help and advice. This work utilized the following Core facilities at The Wistar Institute: the Laboratory Animal Facility, the Imaging facility, the Histochemistry facility, and the Bio-informatics Facility.
Grant support
This work was supported by NIH R01 139319 (M. E. Murphy), P01 114046-07 (to M. E. Murphy, D. L. George and A. T. Weeraratna), and R01 CA174746-01 (to A. T. Weeraratna), as well as T32 CA009171-36 (M. R. Webster). The IHC and IF studies were supported by the Molecular Pathology & Imaging Core, Perelman School of Medicine, University of Pennsylvania (NIH P30 DK050306). The RPPA analysis was funded by the Dr. Miriam and Sheldon G. Adelson Medical Research Foundation to Meenhard Herlyn (The Wistar Institute). Support for Core Facilities utilized in this study was provided by Cancer Center Support Grant (CCSG) CA010815 to The Wistar Institute.
Footnotes
Disclosure of potential conflicts of interest
The authors declare there are no conflicts of interest.
References
- 1.Fedorenko IV, Gibney GT, Sondak VK, Smalley KS. Beyond BRAF: where next for melanoma therapy? Br J Cancer. 2015;112(2):217–26. doi: 10.1038/bjc.2014.476. [DOI] [PMC free article] [PubMed] [Google Scholar]
- 2.Murphy ME. The HSP70 family and cancer. Carcinogenesis. 2013;34(6):1181–8. doi: 10.1093/carcin/bgt111. [DOI] [PMC free article] [PubMed] [Google Scholar]
- 3.Daugaard M, Rohde M, Jaattela M. The heat shock protein 70 family: Highly homologous proteins with overlapping and distinct functions. FEBS Lett. 2007;581(19):3702–10. doi: 10.1016/j.febslet.2007.05.039. [DOI] [PubMed] [Google Scholar]
- 4.Hunt CR, Dix DJ, Sharma GG, Pandita RK, Gupta A, Funk M, et al. Genomic instability and enhanced radiosensitivity in Hsp70.1- and Hsp70.3-deficient mice. Mol Cell Biol. 2004;24(2):899–911. doi: 10.1128/MCB.24.2.899-911.2004. [DOI] [PMC free article] [PubMed] [Google Scholar]
- 5.Ciocca DR, Calderwood SK. Heat shock proteins in cancer: diagnostic, prognostic, predictive, and treatment implications. Cell Stress Chaperones. 2005;10(2):86–103. doi: 10.1379/CSC-99r.1. [DOI] [PMC free article] [PubMed] [Google Scholar]
- 6.Leu JI, Pimkina J, Frank A, Murphy ME, George DL. A small molecule inhibitor of inducible heat shock protein 70. Mol Cell. 2009;36(1):15–27. doi: 10.1016/j.molcel.2009.09.023. [DOI] [PMC free article] [PubMed] [Google Scholar]
- 7.Balaburski GM, Leu JI, Beeharry N, Hayik S, Andrake MD, Zhang G, et al. A modified HSP70 inhibitor shows broad activity as an anticancer agent. Mol Cancer Res. 2013;11(3):219–29. doi: 10.1158/1541-7786.MCR-12-0547-T. [DOI] [PMC free article] [PubMed] [Google Scholar]
- 8.Leu JI, Pimkina J, Pandey P, Murphy ME, George DL. HSP70 inhibition by the small-molecule 2-phenylethynesulfonamide impairs protein clearance pathways in tumor cells. Mol Cancer Res. 2011;9(7):936–47. doi: 10.1158/1541-7786.MCR-11-0019. [DOI] [PMC free article] [PubMed] [Google Scholar]
- 9.Leu JI, Zhang P, Murphy ME, Marmorstein R, George DL. Structural basis for the inhibition of HSP70 and DnaK chaperones by small-molecule targeting of a C-terminal allosteric pocket. ACS Chem Biol. 2014;9(11):2508–16. doi: 10.1021/cb500236y. [DOI] [PMC free article] [PubMed] [Google Scholar]
- 10.Budina-Kolomets A, Balaburski GM, Bondar A, Beeharry N, Yen T, Murphy ME. Comparison of the activity of three different HSP70 inhibitors on apoptosis, cell cycle arrest, autophagy inhibition, and HSP90 inhibition. Cancer Biol Ther. 2014;15(2):194–9. doi: 10.4161/cbt.26720. [DOI] [PMC free article] [PubMed] [Google Scholar]
- 11.Milani V, Frankenberger B, Heinz O, Brandl A, Ruhland S, Issels RD, et al. Melanoma-associated antigen tyrosinase but not Melan-A/MART-1 expression and presentation dissociate during the heat shock response. Int Immunol. 2005;17(3):257–68. doi: 10.1093/intimm/dxh203. [DOI] [PubMed] [Google Scholar]
- 12.Frank AK, Leu JI, Zhou Y, Devarajan K, Nedelko T, Klein-Szanto A, et al. The codon 72 polymorphism of p53 regulates interaction with NF-{kappa}B and transactivation of genes involved in immunity and inflammation. Mol Cell Biol. 2011;31(6):1201–13. doi: 10.1128/MCB.01136-10. [DOI] [PMC free article] [PubMed] [Google Scholar]
- 13.Chou TC, Talalay P. Quantitative analysis of dose-effect relationships: the combined effects of multiple drugs or enzyme inhibitors. Adv Enzyme Regul. 1984;22:27–55. doi: 10.1016/0065-2571(84)90007-4. [DOI] [PubMed] [Google Scholar]
- 14.Robertson D, Savage K, Reis-Filho JS, Isacke CM. Multiple immunofluorescence labelling of formalin-fixed paraffin-embedded (FFPE) tissue. BMC Cell Biol. 2008;9:13. doi: 10.1186/1471-2121-9-13. [DOI] [PMC free article] [PubMed] [Google Scholar]
- 15.Xu XZ, Garcia MV, Li TY, Khor LY, Gajapathy RS, Spittle C, et al. Cytoskeleton alterations in melanoma: aberrant expression of cortactin, an actin-binding adapter protein, correlates with melanocytic tumor progression. Mod Pathol. 2010;23(2):187–96. doi: 10.1038/modpathol.2009.157. [DOI] [PMC free article] [PubMed] [Google Scholar]
- 16.Kumar SM, Acs G, Fang D, Herlyn M, Elder DE, Xu X. Functional erythropoietin autocrine loop in melanoma. Am J Pathol. 2005;166(3):823–30. doi: 10.1016/S0002-9440(10)62303-6. [DOI] [PMC free article] [PubMed] [Google Scholar]
- 17.Li L, Fukunaga-Kalabis M, Herlyn M. The three-dimensional human skin reconstruct model: a tool to study normal skin and melanoma progression. J Vis Exp. 2011(54) doi: 10.3791/2937. [DOI] [PMC free article] [PubMed] [Google Scholar]
- 18.Iadevaia S, Lu Y, Morales FC, Mills GB, Ram PT. Identification of optimal drug combinations targeting cellular networks: integrating phospho-proteomics and computational network analysis. Cancer research. 2010;70(17):6704–14. doi: 10.1158/0008-5472.CAN-10-0460. [DOI] [PMC free article] [PubMed] [Google Scholar]
- 19.Tibes R, Qiu Y, Lu Y, Hennessy B, Andreeff M, Mills GB, et al. Reverse phase protein array: validation of a novel proteomic technology and utility for analysis of primary leukemia specimens and hematopoietic stem cells. Mol Cancer Ther. 2006;5(10):2512–21. doi: 10.1158/1535-7163.MCT-06-0334. [DOI] [PubMed] [Google Scholar]
- 20.Kannengiesser C, Spatz A, Michiels S, Eychene A, Dessen P, Lazar V, et al. Gene expression signature associated with BRAF mutations in human primary cutaneous melanomas. Mol Oncol. 2008;1(4):425–30. doi: 10.1016/j.molonc.2008.01.002. [DOI] [PMC free article] [PubMed] [Google Scholar]
- 21.Parker KA, Glaysher S, Polak M, Gabriel FG, Johnson P, Knight LA, et al. The molecular basis of the chemosensitivity of metastatic cutaneous melanoma to chemotherapy. J Clin Pathol. 2010;63(11):1012–20. doi: 10.1136/jcp.2010.080119. [DOI] [PubMed] [Google Scholar]
- 22.Ricaniadis N, Kataki A, Agnantis N, Androulakis G, Karakousis CP. Long-term prognostic significance of HSP-70, c-myc and HLA-DR expression in patients with malignant melanoma. Eur J Surg Oncol. 2001;27(1):88–93. doi: 10.1053/ejso.1999.1018. [DOI] [PubMed] [Google Scholar]
- 23.Mizuno H, Kitada K, Nakai K, Sarai A. PrognoScan: a new database for meta-analysis of the prognostic value of genes. BMC Med Genomics. 2009;2:18. doi: 10.1186/1755-8794-2-18. [DOI] [PMC free article] [PubMed] [Google Scholar]
- 24.Dankort D, Curley DP, Cartlidge RA, Nelson B, Karnezis AN, Damsky WE, Jr, et al. Braf(V600E) cooperates with Pten loss to induce metastatic melanoma. Nat Genet. 2009;41(5):544–52. doi: 10.1038/ng.356. [DOI] [PMC free article] [PubMed] [Google Scholar]
- 25.Tabchy A, Hennessy BT, Gonzalez-Angulo AM, Bernstam FM, Lu Y, Mills GB. Quantitative proteomic analysis in breast cancer. Drugs Today (Barc) 2011;47(2):169–82. doi: 10.1358/dot.2011.47.2.1576695. [DOI] [PubMed] [Google Scholar]
- 26.Smalley KS, Haass NK, Brafford PA, Lioni M, Flaherty KT, Herlyn M. Multiple signaling pathways must be targeted to overcome drug resistance in cell lines derived from melanoma metastases. Mol Cancer Ther. 2006;5(5):1136–44. doi: 10.1158/1535-7163.MCT-06-0084. [DOI] [PubMed] [Google Scholar]
- 27.Ma XH, Piao SF, Dey S, McAfee Q, Karakousis G, Villanueva J, et al. Targeting ER stress-induced autophagy overcomes BRAF inhibitor resistance in melanoma. J Clin Invest. 2014;124(3):1406–17. doi: 10.1172/JCI70454. [DOI] [PMC free article] [PubMed] [Google Scholar]
- 28.O’Connell MP, Marchbank K, Webster MR, Valiga AA, Kaur A, Vultur A, et al. Hypoxia induces phenotypic plasticity and therapy resistance in melanoma via the tyrosine kinase receptors ROR1 and ROR2. Cancer Discov. 2013;3(12):1378–93. doi: 10.1158/2159-8290.CD-13-0005. [DOI] [PMC free article] [PubMed] [Google Scholar]
- 29.Shibata Y, Morimoto RI. How the nucleus copes with proteotoxic stress. Curr Biol. 2014;24(10):R463–74. doi: 10.1016/j.cub.2014.03.033. [DOI] [PMC free article] [PubMed] [Google Scholar]
- 30.Juhasz K, Lipp AM, Nimmervoll B, Sonnleitner A, Hesse J, Haselgruebler T, et al. The complex function of hsp70 in metastatic cancer. Cancers (Basel) 2013;6(1):42–66. doi: 10.3390/cancers6010042. [DOI] [PMC free article] [PubMed] [Google Scholar]
- 31.Powers MV, Clarke PA, Workman P. Dual targeting of HSC70 and HSP72 inhibits HSP90 function and induces tumor-specific apoptosis. Cancer Cell. 2008;14(3):250–62. doi: 10.1016/j.ccr.2008.08.002. [DOI] [PubMed] [Google Scholar]
- 32.Rohde M, Daugaard M, Jensen MH, Helin K, Nylandsted J, Jaattela M. Members of the heat-shock protein 70 family promote cancer cell growth by distinct mechanisms. Genes Dev. 2005;19(5):570–82. doi: 10.1101/gad.305405. [DOI] [PMC free article] [PubMed] [Google Scholar]
- 33.Yaglom JA, Gabai VL, Sherman MY. High levels of heat shock protein Hsp72 in cancer cells suppress default senescence pathways. Cancer Res. 2007;67(5):2373–81. doi: 10.1158/0008-5472.CAN-06-3796. [DOI] [PubMed] [Google Scholar]
- 34.Gabai VL, Yaglom JA, Waldman T, Sherman MY. Heat shock protein Hsp72 controls oncogene-induced senescence pathways in cancer cells. Mol Cell Biol. 2009;29(2):559–69. doi: 10.1128/MCB.01041-08. [DOI] [PMC free article] [PubMed] [Google Scholar]
- 35.Rerole AL, Gobbo J, De Thonel A, Schmitt E, Pais de Barros JP, Hammann A, et al. Peptides and aptamers targeting HSP70: a novel approach for anticancer chemotherapy. Cancer Res. 2011;71(2):484–95. doi: 10.1158/0008-5472.CAN-10-1443. [DOI] [PubMed] [Google Scholar]
- 36.Colvin TA, Gabai VL, Gong J, Calderwood SK, Li H, Gummuluru S, et al. Hsp70-Bag3 interactions regulate cancer-related signaling networks. Cancer Res. 2014;74(17):4731–40. doi: 10.1158/0008-5472.CAN-14-0747. [DOI] [PMC free article] [PubMed] [Google Scholar]
- 37.Paraiso KH, Haarberg HE, Wood E, Rebecca VW, Chen YA, Xiang Y, et al. The HSP90 inhibitor XL888 overcomes BRAF inhibitor resistance mediated through diverse mechanisms. Clin Cancer Res. 2012;18(9):2502–14. doi: 10.1158/1078-0432.CCR-11-2612. [DOI] [PMC free article] [PubMed] [Google Scholar]
- 38.Smyth T, Paraiso KH, Hearn K, Rodriguez-Lopez AM, Munck JM, Haarberg HE, et al. Inhibition of HSP90 by AT13387 delays the emergence of resistance to BRAF inhibitors and overcomes resistance to dual BRAF and MEK inhibition in melanoma models. Mol Cancer Ther. 2014;13(12):2793–804. doi: 10.1158/1535-7163.MCT-14-0452. [DOI] [PMC free article] [PubMed] [Google Scholar]
- 39.Ueno Y, Sakurai H, Tsunoda S, Choo MK, Matsuo M, Koizumi K, et al. Heregulin-induced activation of ErbB3 by EGFR tyrosine kinase activity promotes tumor growth and metastasis in melanoma cells. Int J Cancer. 2008;123(2):340–7. doi: 10.1002/ijc.23465. [DOI] [PubMed] [Google Scholar]
- 40.Raychaudhuri P, Park HJ. FoxM1: a master regulator of tumor metastasis. Cancer Res. 2011;71(13):4329–33. doi: 10.1158/0008-5472.CAN-11-0640. [DOI] [PMC free article] [PubMed] [Google Scholar]
- 41.Spagnolo F, Ghiorzo P, Orgiano L, Pastorino L, Picasso V, Tornari E, et al. BRAF-mutant melanoma: treatment approaches, resistance mechanisms, and diagnostic strategies. Onco Targets Ther. 2015;8:157–68. doi: 10.2147/OTT.S39096. [DOI] [PMC free article] [PubMed] [Google Scholar]
Associated Data
This section collects any data citations, data availability statements, or supplementary materials included in this article.