

ABSTRACT
Genomic imprinting is an epigenetic mechanism that leads to parental-allele-specific gene expression. Approximately 150 imprinted genes have been identified in humans and mice but less than 30 have been described as imprinted in cattle. For the purpose of de novo identification of imprinted genes in bovine, we determined global monoallelic gene expression in brain, skeletal muscle, liver, kidney and placenta of day ∼105 Bos taurus indicus × Bos taurus taurus F1 conceptuses using RNA sequencing. To accomplish this, we developed a bioinformatics pipeline to identify parent-specific single nucleotide polymorphism alleles after filtering adenosine to inosine (A-to-I) RNA editing sites. We identified 53 genes subject to monoallelic expression. Twenty three are genes known to be imprinted in the cow and an additional 7 have previously been characterized as imprinted in human and/or mouse that have not been reported as imprinted in cattle. Of the remaining 23 genes, we found that 10 are uncharacterized or unannotated transcripts located in known imprinted clusters, whereas the other 13 genes are distributed throughout the bovine genome and are not close to any known imprinted clusters. To exclude potential cis-eQTL effects on allele expression, we corroborated the parental specificity of monoallelic expression in day 86 Bos taurus taurus × Bos taurus taurus conceptuses and identified 8 novel bovine imprinted genes. Further, we identified 671 candidate A-to-I RNA editing sites and describe random X-inactivation in day 15 bovine extraembryonic membranes. Our results expand the imprinted gene list in bovine and demonstrate that monoallelic gene expression can be the result of cis-eQTL effects.
KEYWORDS: A-to-I RNA editing, allele-specific gene expression, genomic imprinting, next generation sequencing, X chromosome inactivation
Abbreviations
- A-to-I
adenosine-to-inosine
- ADARs
adenosine deaminase acting on RNAs
- B. t. indicus
Bos taurus indicus
- B. t. taurus
Bos taurus taurus
- CDS
coding sequence
- cis-eQTL
cis-regulating expression quantitative trait loci
- CPAT
Coding Potential Assessment Tool
- DMR
differentially methylated region
- EEM
extraembryonic membranes
- FDR
false discovery rate
- GATK
Genome Analysis ToolKit
- ICR
imprinting control region
- Indel
insertion/deletion
- IGV
Integrative Genome Viewer
- LOI
loss-of-imprinting
- LOS
large offspring syndrome
- PAR
pseudoautosomal region
- PCR
polymerase chain reaction
- RDD
RNA-DNA differences
- SNP
single nucleotide polymorphism
- UTR
untranslated region
- XCI
X-chromosome inactivation
Introduction
In mammals, approximately 150 genes have been shown to be expressed in a parental-allele-specific manner.1 These genes, collectively known as imprinted genes, are essential for normal embryonic growth, placental function, and postnatal behavior2 and their misregulation has been linked to several developmental syndromes and types of cancers.3,4 Most imprinted genes are organized in clusters and are regulated by cluster-specific DNA elements termed imprinting control regions (ICRs).1 ICRs are marked with DNA methylation and histone posttranslational modifications in a sex-specific manner during gametogenesis.1 These epigenetic signatures are maintained during development and serve to differentiate the parental alleles in somatic cells, when both genomes are found within the same nucleus.1 Since the discovery of the first 3 imprinted genes in 1991,5-7 more than 100 imprinted genes have been identified in humans and mice (http://igc.otago.ac.nz; http://www.har.mrc.ac.uk/research/genomic_imprinting/). However, the list of imprinted genes is not yet comprehensive as their expression can vary by tissue and stage of development.1,2
Many fewer imprinted genes (a total of 34) have been reported in domestic farm animal species.8 In addition, most imprinted genes in cow, pig, sheep, and rabbit have been characterized in studies designed to corroborate the allele-specific expression of genes previously described as imprinted in human and/or mouse.9-15 As in human and mouse, allele specificity in monoallelic expression of these genes is a requirement for proper embryonic and fetal growth; loss-of-imprinting (LOI) has been associated with abnormal development of the conceptus.8,12,16,17 One such example is large offspring syndrome (LOS) in bovine and ovine,18 a fetal overgrowth condition that is phenotypically and epigenetically similar to the LOI condition Beckwith-Wiedemann syndrome in human.12 In a previous study,13 we analyzed a group of genes known to have imprinted expression in human and/or mouse and showed loss of monoallelic expression and differential transcript abundance of multiple imprinted genes in LOS. We also found that some of the genes (e.g., COPG2, IMPACT, HTR2A) do not express in the expected monoallelic fashion but rather are biallelically expressed in the bovine conceptus. The species specificity of genomic imprinting suggests that certain genes may only be imprinted in cattle; therefore, de novo identification of imprinted genes using genome-wide scale approaches is required in order to achieve a more thorough understanding of this epigenetic mechanism and its role in fetal development of this economically important species.
Advances in high throughput sequencing technology provide an unprecedented opportunity for the discovery of imprinted genes at the transcriptome level and has led to the discovery of additional imprinted genes in mice and humans.19 In mice, transcriptome wide identification of imprinted genes relies on RNA sequencing (from here on referred to as RNAseq) of F1 offspring resulting from reciprocal crosses of distantly related inbred mice to identify parental-allele-specific gene expression.20,21 While this approach has been successful, bioinformatics analyses alone can suffer from a high false positive rate due to the potential technical artifacts of RNAseq.22 Thus, the use of next generation sequencing to identify imprinted genes requires independent validation through traditional methods (i.e., Sanger sequencing). In human, systemic characterization of genomic imprinting using RNAseq has recently been performed in 46 tissues from 178 adults.23 This study highlights the widespread tissue-specificity of genomic imprinting as well as the species-specificity of imprinting (some genes imprinted in human are not imprinted in the mouse).23
Beyond genomic imprinting, X chromosome inactivation (XCI) is another epigenetic phenomenon that can regulate gene dosage by silencing one of the parental alleles in females.24 Contrary to parental-origin-dependent silencing of imprinted genes, dosage compensation of X-linked genes in most organs is achieved by randomly silencing one of the X chromosomes.25 However, in extra-embryonic tissues of mouse and rat, XCI is imprinted and it is always the paternal X chromosome that is inactivated.26,27 It has not been resolved whether XCI is imprinted or random in the human placenta24 and, in cattle, a study based on the allele-specific expression of the X-linked gene MAOA indicates that XCI is imprinted in the placenta with preferential silencing of the paternal X chromosome.28
In this study, we determined global allele-specific gene expression in day ∼105 Bos taurus indicus (B. t. indicus) × Bos taurus taurus (B. t. taurus) F1 conceptuses (gestation length ∼280 days) using RNAseq. We developed an analysis pipeline to identify monoallelically expressed genes by resolving several technical challenges such as correction of allelic mapping bias of RNAseq reads and filtering potential RNA editing sites in RNAseq data and then validated our findings by Sanger sequencing. Further, we corroborated the parental specificity of monoallelic expression in day 86 B. t. taurus × B. t. taurus (Holstein breed) conceptuses to exclude potential cis-eQTL effects on allele expression. Finally, we describe random X-inactivation in day 15 bovine extraembryonic membranes.
Results
Pipeline for identification of monoallelically expressed genes in bovine using RNAseq
The identification of imprinted gene expression requires the use of DNA polymorphisms to identify parental origin of the alleles in an F1 individual. For bovids, it is not always possible to know the identity of the parental alleles, for example, if those individuals were conceived with oocytes obtained from abattoir ovaries. This fact, together with the fact that cattle are not inbred, makes the global identification of genes subject to allele-specific expression using RNAseq a challenging task. Another challenge when working in bovine is encountered when aligning RNAseq reads to the publically available reference genome (i.e., UMD3.1) because only one B. t. taurus female (i.e., Hereford breed) is documented with only one of her alleles recorded. In the present study, we developed a bioinformatics pipeline (Fig. 1) to identify candidate imprinted genes in cattle using RNAseq data from 4 gestation day ∼105 female bovine conceptuses (fetus and placenta) generated from the breeding of one Nelore bull [ABS CSS MR N OB 425/1 677344 29NE0001 97155 (i.e., B. t. indicus)] to 4 Holstein breed (B. t. taurus) females of unknown genetics.12 We utilized this breeding scheme, which involves fertile mating between subspecies of cattle that diverged ∼620,000 y ago,29 to increase the likelihood of finding informative polymorphisms with which to ascribe parental origin of the nucleic acid being studied.
Figure 1.

Summary of the pipelines used in this study. Top left and right of figure show the bioinformatics methods used to identify monoallelically expressed genes in day ∼105 Bos taurus indicus (B. t. indicus) × Bos taurus taurus (B. t. taurus) F1 conceptuses. Bottom left shows the pipeline used to corroborate the findings of the bioinformatics analyses. SNP = single nucleotide polymorphism.
First, the sire's DNA was subjected to next generation sequencing (DNAseq) to identify all single nucleotide polymorphisms (SNPs) between his genome and the B. t. taurus reference genome UMD3.1 build. In total, 347.3 million 2 × 100 bp paired-end reads (∼20X coverage of the bovine reference genome) were obtained (Fig. S1A) and used to genotype the B. t. indicus sire. We used Genome Analysis Toolkit GATK; 30 and SAMtools31 pipelines for SNP calling and only SNPs identified by both pipelines (i.e., 93.11%; Fig. 1 and Fig. S1B and C) were used to edit the reference genome to generate a pseudo B. t. indicus genome. Aligning RNAseq reads to a non-identical reference genome has been shown to introduce alignment bias32,33 so we combined the reference genome and the pseudo B. t. indicus genome to create a custom diploid genome. RNAseq reads from the B. t. indicus × B. t. taurus F1 conceptuses were mapped to the diploid genome using both the HISAT234 and BWA35 pipelines and only variants identified by both methods were retained for further analyses (Fig. 1) to minimize the potential effects of false positives.
Genotyping day ∼105 B. t. indicus × B. t. taurus F1 conceptuses using RNAseq
RNAseq data were obtained from brain, kidney, liver, skeletal muscle and placenta of the 4 conceptuses (Control #1, #2, #3, and #4; Table S1) and were aligned to the custom B. t. indicus/B. t. taurus diploid genome. We adapted the SNPiR pipeline36 to identify SNPs using all RNAseq reads from each conceptus. To minimize false positive SNP calls, in addition to the default pipeline, BWA,35,36 we also mapped the reads using HISAT234 and only retained variants common to both alignment strategies (Fig. S2A, Table S1). The identified RNA variants in the F1 conceptuses were compared to known bovine dbSNP entries (http://www.ncbi.nlm.nih.gov/SNP) and the identified B. t. indicus SNPs. We found that ∼98% of the RNA variants were matched to the bovine dbSNP entries and/or were supported by the B. t. indicus DNAseq reads and we refer to them as “genomic variants” (Fig. S2B). The genomic variants exhibited a ∼2.5 transition/transversion ratio (see methods; Fig. S2C) while the remaining ∼2% RNA variants (Fig. S2B), hereinafter referred to as “RNA-DNA differences (RDDs),” exhibited 14–18 transition/transversion ratios and were enriched for A > G and T > C mismatches (Fig. S2D).
Identification and validation of A-to-I RNA editing sites in B. t. indicus × B. t. taurus conceptuses
We reasoned that some of the RDDs with A > G and T > C mismatches resulted from adenosine-to-inosine (A-to-I) RNA editing, a tissue specific posttranscriptional mechanism in which adenosine is converted to inosine in RNA duplexes by adenosine deaminase acting on RNAs (ADARs).37 A-to-I RNA editing is detected as A > G mismatches in cDNA.37 To confirm the true identity of A-to-I RNA editing, we retrieved the variant information (i.e., read counts for both the reference and alternative alleles) in the RNAseq data of each tissue from each individual (Fig. 2A). Further, we required that each RDD has at least 10 reads coverage per tissue per conceptus to discriminate rare SNPs or sequencing errors from true RNA editing sites. For brain, liver, and skeletal muscle, only RDDs shared by Controls #1, #3, and #4 were used to identify RNA editing sites since the RNAseq reads for these tissues from Control #2 were sequenced at 50 bp length instead of 100 bp length for the other samples (Table S1). We identified 404, 275, 266, 208, and 180 RNA variants in brain, kidney, liver, skeletal muscle, and placenta, respectively (Fig. 2A). Of these, the majority (> 72%) were A > G mismatches (Fig. 2A and B) and we considered them to putatively represent A-to-I editing sites (Table S2).
Figure 2.

Identification of adenosine-to-inosine (A-to-I) RNA editing sites in day ∼105 B. t. indicus × B t. taurus F1 conceptuses. A). Pipeline used to identify which RNA-DNA differences (RDDs) were potential A-to-I RNA editing sites. RDDs refer to RNA variants not found in the bovine dbSNP database nor in the B. t. indicus sire DNAseq reads. RNA variants were identified using all the RNAseq reads of each conceptus. Only RDDs with ≥10 reads coverage per tissue per conceptus and had strand information of the transcript template were used to identify potential editing sites. *Note: for brain, liver, and skeletal muscle only RDDs shared by Control #1, #3, and #4 were used to identify RNA editing sites since the RNAseq reads for those tissues in Control #2 were sequenced at 50 bp length instead of 100 bp length for all other samples. B). Variant type distribution of the RDDs. “A > G” variants were considered candidate A-to-I RNA editing sites (detailed information of these sites may be found in Table S2). C) and D). Validation of the identified A-to-I RNA editing sites by Sanger sequencing. Red arrows indicate the editing sites. Panel C shows an example of A-to-I editing in the coding sequence (CDS) of COPA, which can cause an amino acid change (Ile→Val) while panel D shows 2 editing sites in the 3' untranslated region (3'UTR) of SEC16A. Further verification of A-to-I RNA editing sites may be found in Fig. S3.
We analyzed 7 predicated editing sites in 4 genes (COPA, SEC16A, GRIK2, and GABRA3) using Sanger sequencing to confirm that the editing site did not represent a heterozygous SNP in DNA and also to corroborate the editing of the RNA molecules (a second “G” peak in the sequencing chromatogram). We were able to validate 6 of 7 to be true A-to-I editing sites (Fig. 2C and D, Fig. S3).
Characterization and species conservation of candidate A-to-I editing sites
Analysis of the putative A-to-I editing events indicated that ∼96% (643/671) of these sites were within noncoding regions such as UTRs and introns and approximately 2% (15/671) were located in coding sequences (CDS; Fig. S4). This observation is consistent with findings in human and mouse that the majority of A-to-I RNA editing events occur in noncoding regions.38 Of the sites located in CDS, 14 could cause an amino acid change (Table S2).
To determine whether the identified A-to-I RNA editing sites in bovine were conserved in human and/or mouse, we retrieved 80 bp of flanking sequences 40 bp upstream and 40 bp downstream; 39 and aligned the 81 nucleotides to the human and mouse genomes using BLAST. A valid BLAST hit with > 86% identity was required to ascribe a site as being conserved between species.39 With this criterion, 20 of the sites were predicted to be conserved between bovine and human and/or mouse. Table 1 shows that 13 out of 20 editing sites are located in the CDS and 12 of those editing events can cause an amino acid change.
Table 1.
A-to-I RNA editing sites in bovine that are conserved in human and/or mouse.
| Chr/Pos | Tissue type | Gene | Gene section | Outcome | Conservation |
|---|---|---|---|---|---|
| Chr3:9479773 | Brain, kidney, liver, skeletal muscle, placenta | COPA | CDS | Nonsyn (Ile→Val) | Human |
| Chr4:114454773 | Skeletal muscle, placenta | FASTK | Intron | Unknown | Human, mouse |
| Chr5:76189492 | Brain | ELFN2 | Intron | Unknown | Human |
| Chr7:71024261 | Brain | CYFIP2 | CDS | Nonsyn (Lys→Glu) | Human, mouse |
| Chr9:48598875 | Brain | GRIK2 | Intron | Unknown | Human, mouse |
| Chr9:48598884 | Brain | GRIK2 | Intron | Unknown | Human |
| Chr9:48598902 | Brain | GRIK2 | Intron | Unknown | Human, mouse |
| Chr9:48600509 | Brain | GRIK2 | Intron | Unknown | Human |
| Chr9:48600848 | Brain | GRIK2 | CDS | Nonsyn (Gln→Arg) | Human, mouse |
| Chr9:48600865 | Brain | GRIK2 | CDS | Syn (Gly→Gly) | Human |
| Chr9:48634035 | Brain | GRIK2 | CDS | Nonsyn (Tyr→Cys) | Human, mouse |
| Chr9:48634048 | Brain | GRIK2 | CDS | Nonsyn (Ile→Val) | Human, mouse |
| Chr12:15671536 | Brain, kidney, liver, skeletal muscle, placenta | COG3 | CDS | Nonsyn (Ile→Val) | Human, mouse |
| Chr13:67116409 | Brain, skeletal muscle, placenta | BLCAP | CDS | Nonsyn (Lys→Arg) | Human |
| Chr13:67116439 | Brain, kidney, skeletal muscle, placenta | BLCAP | CDS | Nonsyn (Gln→Arg) | Human, mouse |
| Chr13:67116448 | Brain, kidney | BLCAP | CDS | Nonsyn (Tyr→Cys) | Human, mouse |
| Chr17:42806463 | Brain | GRIA2 | Intron | Unknown | Human, mouse |
| Chr17:42806724 | Brain | GRIA2 | CDS | Nonsyn (Gln→Arg) | Human, mouse |
| Chr22:39005364 | Brain | CADPS | CDS | Nonsyn (Glu→Gly) | Human, mouse |
| ChrX:34866822 | Brain | GABRA3 | CDS | Nonsyn (Ile→Met) | Human, mouse |
Chr: chromosome; pos: position; CDS: coding sequence; Nonsyn: nonsynonymous editing; Syn: synonymous editing.
Identification of genes with monoallelic expression in B. t. indicus × B. t. taurus conceptuses
As the RDDs were enriched with A-to-I editing sites, we used only genomic variants for the identification of monoallelically expressed genes. We first assigned parental origin of each allele within the F1 RNAseq reads by determining which SNPs were found in the sire's DNAseq reads. As illustrated in Fig. S5, the only SNPs that were used to assign parental alleles were those that were homozygous in the B. t. indicus sire and that had at least one allele different from the allele found in the sire in the F1 RNAseq data. Following assignment of the parental alleles, allele-specific read counts covering each of the SNPs in the same gene were aggregated as previously described22 and a binomial test was used to detect consistent allelic expression bias (false discovery rate (FDR) < 0.05; Table S3 and S4). As the annotation of the bovine genome is imperfect, we further manually annotated the candidate genes using the Integrative Genomic Viewer (IGV).40 We identified a total of 53 genes subject to monoallelic expression in at least one of the analyzed tissues (33 in brain, 36 in kidney, 38 in liver, 36 in muscle, and 35 in placenta; Table S3 and S4). Of the identified 53 genes, 23 were known to be imprinted in the cow (also in human and/or mouse; http://igc.otago.ac.nz/; http://www.har.mrc.ac.uk/research/genomic_imprinting/) and 7 had previously been characterized as imprinted in human and/or mouse but had not been reported to be imprinted in cow (Table S5). Of the remaining 23 genes, 10 were uncharacterized or unannotated transcripts located in known imprinted clusters, whereas the other 13 genes were distributed throughout the bovine genome and were not located close to any known imprinted clusters (Table S5).
Validation of the imprinted genes previously identified in human and/or mouse
We used PCR followed by Sanger sequencing to validate the allele specific expression of GNASXL (GNAS/GNASXL domain), COPG2IT1 (MEST/COPG2 domain), MEG8 and MEG9 (GTL2/DLK1 domain), MIMT1, USP29, ZIM2 (PEG3/USP29 domain), PON3 and PPP1R9A (PEG10/SGCE domain), and MKRN3 (SNRPN domain). The other 20 imprinted genes (Table S5) were not validated because we have previously described these genes to be imprinted.13 In the GNAS domain, we identified GNASXL as a paternally expressed transcript isoform which has a unique first exon but shares identical sequences from exon 2 to the end of the transcript with the maternally expressed transcript GNAS [also known as NESP55 in cattle (NM_001271771.1), Fig. 3A. By using the SNP located in the last exon of these transcripts (Fig. 3A) we validated the paternal expression of GNASXL and maternal expression of GNAS (Fig. 3B). In addition, analyses of 2 other SNPs (one specific to the GNASXL first exon and the other specific to the GNAS first exon) confirmed this result (Fig. S6A). Further, DNA methylation of the GNASXL and GNAS promoter regions was confirmed using bisulfite mutagenesis followed by cloning and sequencing. The GNASXL differentially methylated region (DMR; the locus' putative ICR) showed hypomethylation of the paternal allele and hypermethylation of the maternal allele, which was associated with the paternal expression of this transcript (Fig. 3C and Fig. S6B). To the contrary, the GNAS DMR was methylated on the paternal allele while unmethylated on the maternal allele, which was associated with the maternal expression of GNAS (Fig. 3C and Fig. S6B). In addition to GNASXL and GNAS, we verified the maternal expression of MEG8, MEG9, PPP1R9A, PON3 and ZIM2, and paternal expression of COPG2IT1, MIMT1, MKRN3, and USP29 in B. t. indicus × B. t. taurus F1 hybrids (Fig. S7-S9).
Figure 3.
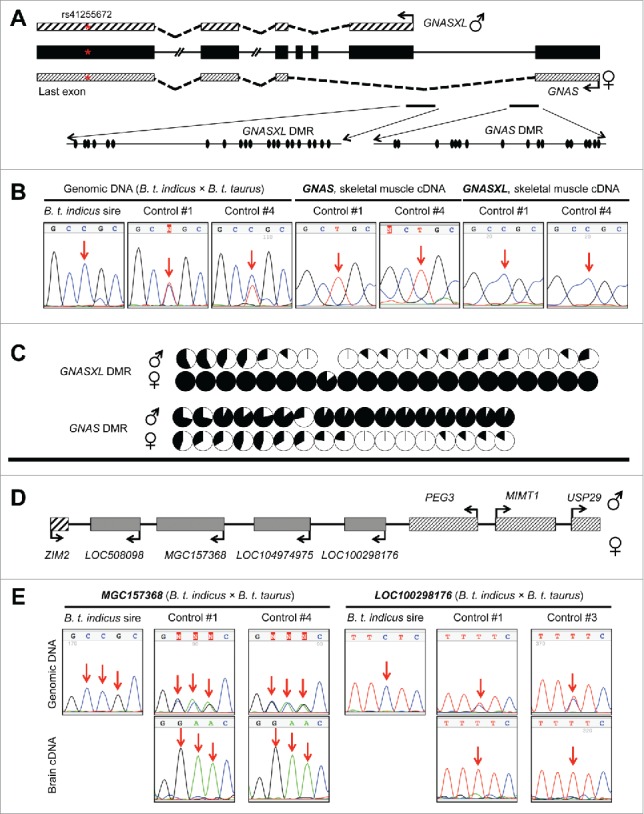
Validation of the allele-specific gene expression in GNAS/GNASXL and PEG3/USP29 imprinted clusters in day ∼105 B. t. indicus × B. t. taurus F1 conceptuses. A). Schematics of the GNAS/GNASXL loci (not all exons are shown and are not drawn to scale). Bent arrows represent the transcription start sites. Patterned boxes above and below the gene structure (in black) represent the GNASXL and GNAS transcripts, respectively. The red asterisk in the last exon represents the SNP used to discriminate the parental alleles for allele-specific expression analyses in panel B. The black ovals represent the CpGs found within the amplicon used for DNA methylation analyses (panel C). B). Validation of the maternal expression of GNAS and paternal expression of GNASXL by Sanger sequencing. The SNP site is indicated by red arrows. Left: genotyping results obtained by Sanger sequencing of the B. t. indicus sire and the F1 individuals at the SNP site. Middle and right: Sanger sequencing results of RT-PCR amplicons of GNAS and GNASXL. Validation of the allelic expression of GNAS and GNASXL at other SNP sites may be found in Fig. S6A. C). DNA methylation analyses of GNASXL (top) and GNAS (bottom) differentially methylated regions (DMRs). DNA methylation was determined using bisulfite mutagenesis, cloning, and Sanger sequencing. Parental-origin of each clone was determined using heterozygous SNPs in the F1 individuals. Methylation of CpG sites for each parental allele was summarized from at least 7 clones and is presented with pie charts with black representing the percent of methylated cytosines and white representing the percent of unmethylated cytosines at each site. The complete bisulfite maps may be found in Fig. S6B. D). Schematics of the PEG3/USP29 imprinted cluster. Bent arrows represent the transcription direction of each gene. E). Validation of maternal expression of MGC157368 and LOC100298176. Top panels for each gene are the genotyping results obtained by Sanger sequencing of the B. t. indicus sire and F1 individuals. Bottom panels are the Sanger sequencing results of the RT-PCR amplicons of MGC157368 and LOC100298176. The validation of the allelic expression of other genes in the PEG3/USP29 imprinted cluster may be found in Fig. S8.  = genes previously identified to be imprinted in human, mouse, and bovine.
  = genes previously identified to be imprinted in human and/or mouse but not reported to be imprinted in bovine.
  = uncharacterized transcripts in known imprinted clusters.
Validation of the monoallelic expression of the uncharacterized/unannotated transcripts in previously known imprinted clusters
We identified 10 uncharacterized/unannotated transcripts with monoallelic expression in previously known imprinted clusters, of which 4 transcripts were located in the PEG3/USP29 cluster and 6 transcripts were in the SNRPN domain. In the PEG3/USP29 domain, the 4 uncharacterized transcripts (LOC508098, MGC157368, LOC104974975, and LOC100298176) were located downstream of the paternally expressed gene PEG3 and upstream of the maternally expressed gene ZIM2 (Fig. 3D). We verified the maternal expression of LOC508098, MGC157368, LOC104974975, and LOC100298176 (Fig. 3E, Fig. S8, Table S3, and S5). According to RefSeq gene annotation,41 LOC508098, MGC157368, and LOC104974975 are protein-coding genes. In addition, LOC100298176 has high protein-coding potential (0.78 coding probability) based on the Coding Potential Assessment Tool CPAT; 42. We considered a transcript with CPAT coding probability > 0.348 to possess protein-coding potential as previously reported for bovine.43
In the SNPRN domain, LOC100848941 and LOC101907203 were identified as 2 paternally expressed noncoding RNAs (ncRNAs) located downstream of the maternally expressed gene UBE3A (Fig. S9). In addition, 2 paternally expressed ncRNAs (LOC100849023 and LOC101907679; Fig. 4A left panel) located upstream of UBE3A were identified (Fig. S9). Finally, we verified paternal expression of an unannotated ncRNA CPAT coding probability 0.06;42 with cuffmerge gene ID XLOC_045114 (Chr21:350,550–552,040 bp, UMD3.1) which was located ∼300 kb upstream of the paternally expressed gene SNRPN (Fig. S9). To determine whether XLOC_045114 has any human/mouse counterpart, we aligned its cDNA sequence to the human and mouse genomes using BLAST but were unable to confidently identify any matches.
Figure 4.
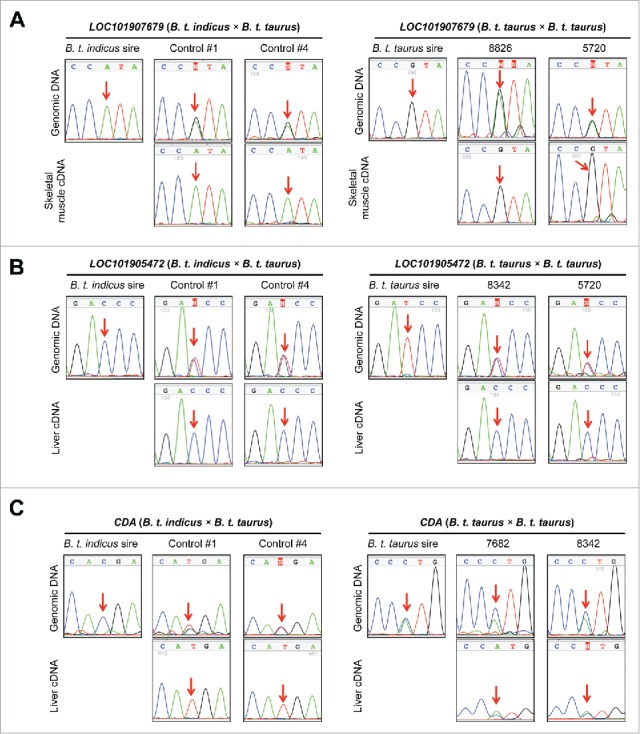
Corroboration of the allele-specificity in gene expression identified by RNAseq. A-C). Left panels show results obtained from the day ∼105 B. t. indicus × B. t. taurus F1 conceptuses. A-C). Right panels show results obtained from the day 86 B. t. taurus × B. t. taurus individuals. For each gene, the top lines are the genotyping results of the F1s and their sire while the bottom lines are the Sanger sequencing results of the RT-PCR amplicons of the F1 conceptuses. A). An example of a gene that had parental-origin-dependent monoallelic expression. LOC101907679, an uncharacterized transcript in the SNRPN imprinted cluster was paternally expressed in both B. t. indicus × B. t. taurus and B. t. taurus × B. t. taurus individuals. B). An example of a gene that had sequence-dependent monoallelic expression. For LOC101905472, the “C” allele was always predominantly expressed, regardless of its parental-origin. C). An example of a gene (CDA) that was monoallelically expressed in B. t. indicus × B. t. taurus F1 hybrids but biallelically expressed in B. t. taurus × B. t. taurus individuals. Further validations of allele-specific expression in B. t. indicus × B. t. taurus F1s and B. t. taurus conceptuses may be found in Fig. S10 and S11.
Validation of monoallelically expressed genes not found in known imprinted clusters
We identified 13 genes with monoallelic expression that were located >15 Mb from any known imprinted clusters. For these genes, 9 (AOX1, APCS, AS3MT, C1R, C1S, CDA, KRT7, OOEP, and RDH16) were annotated protein-coding genes, of which APCS, AS3MT, C1R, C1S, CDA, OOEP, and RDH16 were monoallelically expressed from the B. t. taurus allele (maternal), while AOX1 and KRT7 were expressed from the B. t. indicus allele (paternal) (Fig. 4C and Fig. S10 left panels and Table S3). The remaining 4 genes were either uncharacterized ncRNA (LOC101905472) or unannotated transcripts: XLOC_009410 (Chr4:59,913,253–59,913,967, UMD3.1, CPAT coding probability: 0.38), XLOC_012439 (Chr5:115,431,044–115,432,886, UMD3.1, CPAT coding probability: 0.36), and XLOC_052524 (ChrX:113,053,268–113,055,164, UMD3.1, CPAT coding probability: 0.02). Consistent with RNAseq analysis, Sanger sequencing confirmed the maternal expression of XLOC_052524, and paternal expression of LOC101905472, XLOC_012439, and XLOC_009410 in the B. t. indicus × B. t. taurus F1 hybrids (Fig. 4B and Fig. S10 left panels and Table S3).
Corroboration of the allele-specificity of gene expression in day 86 B. t. taurus × B. t. taurus conceptuses
Beyond genomic imprinting, cis-eQTL (cis-regulating expression quantitative trait loci) can also induce biased allelic gene expression.19 As we lack the ability to produce the reciprocal B. t. taurus × B. t. indicus F1 conceptuses, we used tissues from 9 day 86 B. t. taurus × B. t. taurus female conceptuses (Holstein breed all sired by bull: 507HO10723 DE-SU 527 SPUR-ET) to corroborate allelic specificity of transcription of genes not previously reported to be imprinted in bovine (n = 33; Table S5). We used PCR followed by Sanger sequencing to identify informative SNPs in the B. t. taurus × B. t. taurus conceptuses. Of the analyzed 33 genes we found 20 genes with heterozygous SNPs in at least one conceptus (Fig. 4, Fig. S10 and S11 right panels). Of these, 9 genes (COPG2IT1, GNAS, GNASXL, MEG8, LOC101907679, LOC100298176, LOC104974975, LOC1009849023, MEG8, and XLOC_052524) showed consistent parental-allele-specific gene expression between the B. t. indicus × B. t. taurus and B. t. taurus × B. t. taurus conceptuses while RDH16 and CDA were found to be biallelically expressed and C1R, C1S, LOC101905472, and XLOC_012439 were monoallelically expressed but not imprinted (Fig 4, Fig S10 and S11). We were not able to assign parental origin to the monoallelically expressed APCS, ZIM2, USP29, LOC508908, and XLOC_009410 alleles as the sire was heterozygous at these loci (Fig. 5, Fig. S10 and S11). Using this scheme, 8 novel imprinted genes were identified (Fig. 5B) and imprinted expression of another 23 genes in cattle was corroborated (Fig. 5A). RNAseq results indicated that 16 of these genes showed allele-specific expression in all analyzed tissues, 7 had biallelic expression in at least one tissue, and 8 were lowly expressed in some tissues (Fig. 5A and 5B). We also identified a paternal transcript in the SNRPN domain (referred here as “LOC100848941 brain isoform”) which connected the 2 paternal transcripts LOC100848941 and LOC101907203 (Fig. S9 top panel).
Figure 5.

Summary of the imprinted and monoallelically expressed genes identified in the current study. For A-C), different colors denote the type of expression of listed genes for each analyzed tissue. A). Genes previously reported to be imprinted in bovine. B). Genes not previously reported to be imprinted in bovine. C). Genes with monoallelic expression in the B. t. indicus × B. t. taurus F1s but which parental origin of the transcript could not be corroborated due to lack of informative SNPs in the B. t. taurus × B. t. taurus conceptuses or as a result of the heterozygosity of their sire. # = genes with inter-individual variations in allele-specific gene expression. LOC100848941ˆ is an isoform of LOC100848941 (SNPRN imprinted cluster) only identified in brain. Allele-specific read counts and allelic expression ratios of each gene may be found in Tables S3.
Allele-specific expression analyses of X-linked genes in bovine placenta
To determine whether X-chromosome inactivation (XCI) in bovine placenta is random or imprinted,28,44 allele expression ratios for the annotated X-linked genes were analyzed in placenta of the 4 B. t. indicus × B. t. taurus F1 female conceptuses. If the XCI is imprinted, we expect that most of the X-linked genes would be expressed from the maternal allele, except for those genes that escape XCI.45 However, if XCI is random, we expect that both parental alleles of the X-linked genes would be expressed and that allele expression ratios would be variable among individuals due to the sampling effects.45 We plotted the distribution of the allele expression ratios for both autosomal genes and X-linked genes in placenta of the 4 B. t. indicus × B. t. taurus F1 conceptuses (Fig. 6A). For autosomal genes, the distribution of the allele expression ratios of all 4 individuals had an approximate 50:50 ratio. However, the X-linked genes showed biallelic expression but with inter-individual variation of the allele expression ratios (mean ranges from 29.0 to 66.7%; Fig. 6A), which is consistent with the distribution of the allele expression ratios for the X-linked genes in the mule and horse placenta.45 We further analyzed the allele expression ratios of 14 X-linked genes that have previously been described as imprinted in mouse placenta46 and/or extra-embryonic cell lines,47 2 genes (CD99 and ZBED1) found in the pseudoautosomal region (PAR),48 and the ncRNA XIST, which is expressed from the inactive X.24 We observed that similar to the X-linked genes, XIST was expressed from both parental alleles (Fig 6B and C, Table S6). Further, we found an anti-association between the allelic expression ratio of XIST and the X-linked genes in 2 of the samples (Fig 6B and Table S6). Conversely to XIST and the X-linked genes, the allele expression ratios of the PAR genes CD99 and ZBED1 centered toward 50:50 with no apparent association with X-linked genes or XIST expression (Fig. 6B). For this study the placental samples were taken from the intercotyledonary chorioallantois for which predecessor cells come from the trophectoderm and the epiblast,49,50 therefore, the possibility exists that the randomness of X-linked gene allele expression observed here was simply the result of the expression observed in tissues derived from the inner cell mass.24 To refine our findings, we turned to day 15 bovine extraembryonic membranes (EEM)51 and CT1 cells,52 a trophectoderm cell line derived from a single bovine female blastocyst. The EEM were dissected from the female conceptuses by removing the embryonic disk and should contain no epiblast derivatives.53 Sanger sequencing results showed that XIST was expressed from both parental alleles in EEM of the 4 day 15 conceptuses analyzed (Fig. 6C and Fig. S12), indicating random XCI in bovine extraembryonic membranes. However, in CT1 cells only one allele of XIST was expressed. It is possible that this “monoallelic” XIST expression resulted from the clonal expansion of the cells that randomly inactivate one of the X chromosomes.
Figure 6.

Allele-specific expression analyses for autosomal and X-linked genes in placental membranes from day ∼105 B. t. indicus × B. t. taurus F1 hybrids. The placental membranes used for this study were the intercotyledonary region of the chorioallantois. A). Histograms of the allelic expression ratios for the autosomal genes (top) and X-linked genes (bottom) in placenta from each conceptus. The Y-axis represents the percent of genes with varied levels of expression from the B. t. taurus (maternal) allele (X axis). N = number of annotated genes with informative SNPs. Mean = the mean of the percent allelic expression. B). Plot of allelic expression ratios of XIST (filled circles), 2 pseudo-autosomal genes (gray diamonds), and 14 X-linked genes (open circles) from the placenta RNAseq data. The X-linked genes have previously been described as being subjected to imprinted X chromosome inactivation in mouse. The detailed allele-specific read counts of these genes may be found in Table S6. C). Sanger sequencing results of XIST allelic expression in the B. t. indicus × B. t. taurus F1 placenta, in in vivo (AI)- and in vitro (IVF)-produced day 15 (D15) bovine extraembryonic membranes (EEM), and CT1 trophectoderm cell line. Top row is the genotyping results while the 2 bottom rows are sequencing results for the RT-PCR amplicons. Both random primers and oligo(dT) were used for cDNA synthesis.
Discussion
To date, approximately 150 imprinted genes have been identified in humans and mice (http://igc.otago.ac.nz; http://www.har.mrc.ac.uk/research/genomic_imprinting/), but less than 30 genes have been described as imprinted in cattle.8 In this study, we advance the genomic imprinting field by the de novo identification of imprinted genes in bovine using RNAseq. To do so, we identified parent-specific SNP alleles in RNAseq data after filtering A-to-I RNA editing sites and determined global allele-specific gene expression in B. t. indicus × B. t. taurus F1 conceptuses. We also corroborated the allele specificity of the identified monoallelically expressed genes using B. t. taurus × B. t. taurus progenies to exclude potential cis-eQTL effects on allelic expression. These analyses confirmed the allelic origin of 23 transcripts previously reported to be imprinted in bovine and identified 8 novel imprinted genes in the bovine conceptuses. Of note, we were not able to corroborate the allele-specific expression of 16 genes in the B. t. taurus × B. t. taurus conceptuses because of a lack of informative SNPs. However, of these 16 genes, PPP1R9A, PON3, MKRN3, and ZIM2 have previously been reported to be imprinted in human and/or mouse and showed consistent allele-specific expression in the B. t. indicus × B. t. taurus F1s, which together suggest that these 4 genes are also imprinted in bovine.
Most imprinted genes are organized in megabase-sized clusters. Within the cluster is a differentially methylated imprinting control region which regulates the proper allelic expression of the imprinted genes across the entire domain.54,55 Of the 53 monoallelically expressed genes identified in this study, 30 genes have previously been reported to be imprinted in humans and/or mice and 24 are distributed in 8 imprinted clusters namely; GNAS/GNASXL domain, PEG3/USP29 domain, GTL2/DLK1 domain, PEG10/SGCE domain, MEST/COPG2 domain, SNRPN domain, H19/IGF2 domain, and KCNQ1 domain. Further, 10 previously uncharacterized/unannotated transcripts were identified to be subject to allele-specific expression in 2 known imprinted clusters (4 transcripts in PEG3/USP29 domain and 6 in the SNRPN domain) in the B. t. indicus × B. t. taurus conceptuses. Of these 10 transcripts, LOC100298176 and LOC1014974975 (within the PEG3/USP29 domain) and LOC101907679 and LOC100849023 (within the SNRPN domain) were demonstrated to be imprinted in the bovine conceptuses. For the remaining 6 transcripts, parental-specificity could not be ascertained due to a lack of informative SNPs in the B. t. taurus × B. t. taurus conceptuses. However, we suggest that these genes are also imprinted in bovine because of the proximity of these uncharacterized/unannotated transcripts to known imprinted genes is less than 100 kb and they are within known and well characterized clusters. In addition, in the SNRPN domain, the last exon of the antisense LOC100848941 brain isoform extends to the UBE3A gene. It is tempting to speculate that the paternal expression of this transcript may be involved in the repression of the paternal copy of UBE3A as is observed for UBE3A-ATS in human56 and mouse.57
Gene expression can be affected by genetic variants. cis-eQTL refers to the class of genetic variants that affect gene expression on the same DNA molecule thus leading to allele-specific or allele-biased gene expression.58 To determine whether monoallelic gene expression identified in the B. t. indicus × B. t. taurus F1s was due to cis-eQTL effects or genomic imprinting, we corroborated the parent-specificity of the transcripts in B. t. taurus × B. t. taurus progeneis as we lack the ability to produce reciprocal B. t. taurus × B. t. indicus crosses. Our findings confirmed that monoallelic gene expression is not necessarily the result of genomic imprinting.19 For the example of LOC101905472, it is always the “C” allele that is predominantly expressed regardless of its parental-origin in both B. t. indicus × B. t. taurus and B. t. taurus × B. t. taurus conceptuses. Further, CDA and RDH16 showed monoallelic expression in B. t. indicus × B. t. taurus conceptuses but biallelic expression in B. t. taurus × B. t. taurus progenies. Our results demonstrate that strong cis-eQTL could lead to monoallelic gene expression and highlight the importance of the determination of allele-specific gene expression using different mating structures crosses prior to claiming that any monoallelically expressed genes are imprinted.
Genome-wide assessment of imprinted gene expression in non-inbred organisms such as cattle and humans can be challenging as heterozygous SNPs are not always informative of parental-origin of an allele. We were unable to assign the allele-origin of a heterozygous SNP in the B. t. indicus × B. t. taurus F1s if the B. t. indicus sire was heterozygous at the same site. Discovery of imprinted genes using RNAseq relies on aligning reads to a reference genome, however, some bovine sequences have recently been shown to be absent or misassembled in the current bovine reference genome UMD3.159 and perfection of the reference assembly will help improve the RNAseq-based identification of imprinted genes in cattle. Further, technical limitations of standard RNAseq may also preclude the comprehensive discovery of imprinted genes. For example, the identification of antisense imprinted transcripts such as APEG3, a paternally expressed antisense transcript in the PEG3 locus,60 is not possible as our samples were not sequenced using a strand-specific RNAseq protocol.61 In addition, the procedures performed for RNA isolation for this study prevent us from identifying small imprinted RNAs as well as non-polyadenylated molecules (e.g., some long ncRNAs). In future studies, the single-cell RNAseq technology will allow allele-specific gene expression analyses at exquisite resolution62 and help identify genes that are only imprinted in specific cell types such as Ube3a in neurons.63
Advances in next generation sequencing technology have allowed the discovery of more than a million A-to-I RNA editing sites in human38,64 and thousands of sites in mouse.65,66 Conversely to human and mouse, only 23 A-to-I RNA editing sites have been reported in cattle and these editing sites were identified as a result of searching evolutionarily conserved human/mouse A-to-I RNA editing sites in bovine brain RNAseq data.39 In this study, we greatly expand the list by identifying 671 potential A-to-I RNA editing sites in the bovine conceptuses using RNAseq. Consistent with the observation that most A-to-I editing sites in human and mouse are not located in coding regions,38,67 ∼96% of the identified editing sites in this study were in UTRs and introns. These editing events could either regulate RNA splicing processes68 or prevent the formation of double stranded RNA that may be recognized as non-self by the immune system.69 We also found that ∼3% (20/671) of the editing sites identified in bovine are conserved in human and/or mouse and 11 of these sites are within neurotransmitter receptor genes such as GRIK2, GRIA2, and GABRA3. One of the notable conserved A-to-I RNA editing sites is in GRIA2 CDS region (Chr17:42,806,724; UMD3.1), which has ∼99% edited transcripts in brain and can result in the replacement of a glutamine residue by arginine in the GRIA2 protein. This editing site has been demonstrated to be the physiologically most important editing substrate of Adar2 because the seizure and lethality phenotype of Adar2 null mice can be reverted when the unedited Gria2 transcripts are replaced with the edited allele.70
Imprinted X-chromosome inactivation in extraembryonic membranes has been described in mouse26 and rat.27 In bovine, a report showed that the X-linked gene MAOA is preferentially expressed from the maternal X-chromosome in term placenta suggesting imprinted X-inactivation in this species.28 Here we show that XIST is expressed from both parental chromosomes in epiblast-free 53extraembryonic membranes from day 15 bovine conceptuses.51 From our results, we favor the hypothesis that XCI is random in bovine extraembryonic membranes and not imprinted as previously suggested.
In summary, with this work we advance the field of genomic imprinting by expanding the list of imprinted genes in bovine and demonstrate that monoallelic gene expression can be due to cis-eQTL effects. In addition, our results greatly increase the number of identified A-to-I RNA editing sites in bovine conceptuses. We also show that XCI is random in bovine extraembryonic membranes. These findings will facilitate future studies to further dissect the molecular mechanisms and physiological roles of genomic imprinting and A-to-I RNA editing during fetal development of this economically important species.
Materials and methods
Whole genome sequencing of the B. t. indicus sire
Genomic DNA isolated from the semen of the B. t. indicus sire (Nelore breed; ABS CSS MR N OB 425/1 677344 29NE0001 97155) used to generate the B. t. indicus × B. t. taurus F1 hybrids was subject to DNAseq. In brief, 2 DNAseq libraries (one with 350 bp target insert size, the other with 550 bp target insert size) were prepared using Illumina TruSeq DNA PCR-Free Sample Preparation Kit according to the manufacturer's instructions (Illumina). Each DNAseq library was sequenced in a single lane with 2 ×100 bp paired-end reads on an Illumina HiSeq 2000 platform. One percent PhiX DNA was spiked into the bovine genomic DNA sample prior to library preparation to act as an internal control and allow the HiSeq optical system optimal base calling. A total of 347.3 million raw read pairs were obtained for genotyping the B. t. indicus sire after removing the DNAseq reads derived from PhiX DNA (Fig. S1). The raw FASTQ files are publically available at Gene Expression Omnibus (GEO accession no. GSE77389).
Identification of the SNPs of B. t. indicus sire using DNAseq
Raw DNAseq read pairs were subject to quality trimming prior to alignment to the reference genome (Fig. S1). The FastqMcf program (version: 1.04.636; http://code.google.com/p/ea-utils/wiki/FastqMcf) was used to remove the adaptor sequences in the reads. Further, DynamicTrim version: 3.3.1; 71 was used to obtain the longest segment of the read in which each base has <1% error rate. After quality trimming, DNAseq read pairs were aligned to the bovine reference genome assembly UMD3.1 using Bowtie2 version: 2.2.3; 72. Only read pairs that had the expected read mate orientation and expected ranges of insert size were retained for further analyses.
Following Bowtie2 alignment, Genome Analysis Tool Kit GATK; version: 3.3–0; 30,73 was used to further process the aligned read pairs for SNP calling. Known insertions/deletions (indel) and known SNPs downloaded from Ensembl and RefSeq FTP sites were supplied for insertions/deletions re-alignment and base quality recalibration (ftp://ftp.ensembl.org/pub/release-78/variation/vcf/bos_taurus/ ftp://ftp.ncbi.nlm.nih.gov/snp/organisms/cow_9913/VCF/; ftp://ftp.ncbi.nlm.nih.gov/snp/organisms/cow_30522/). After processing the aligned read pairs, GATK HaplotypeCaller was used to identify SNPs using the default parameters. Aligned read pairs subjected to indel realignment were also used for SNP calling by GATK HaplotypeCaller and SAMtools mpileup version: 0.1.19; 31,74 without the base quality recalibration step in order to improve the identification of true SNPs.
Generation of the pseudo B. t. indicus genome and construction of a B. t. indicus/B. t. taurus diploid genome
A pseudo B. t. indicus genome was generated by editing the reference allele (UMD3.1; i.e., B. t. taurus) with the SNPs found in our B. t. indicus sire identified by the 3 SNP calling pipelines mentioned above (Fig. S1B, C, and D). The diploid genome was generated by combining the B. t. taurus and the pseudo B. t. indicus FASTA files.
RNAseq of day ∼105 B. t. indicus × B. t. taurus F1 conceptuses
The four day ∼105 B. t. indicus × B. t. taurus F1 conceptuses used in this study (Control #1, #2, #3, and #4) were previously described.12 These conceptuses shared the same B. t. indicus sire (ABS CSS MR N OB 425/1 677344 29NE0001 97155). RNAseq data of brain, kidney, liver, and skeletal muscle of the F1 individuals were previously described GEO accession number: GSE63509.13 In addition, for the current study, we generated RNAseq data from the placenta (intercotyledon regions) of these conceptuses following the RNA isolation, library preparation and sequencing procedures described previously.13 The raw FASTQ files are publically available at GEO database (accession number GSE77389).
Alignment of RNAseq reads to the custom diploid genome
Prior to alignment, single-end RNAseq reads were processed as previously described.13 In brief, FastqMcf (version: 1.04.636; http://code.google.com/p/ea-utils/wiki/FastqMcf) and DynamicTrim version 3.3.171 programs were used to remove adaptor sequences and low quality bases in the reads, respectively. Only reads with a length greater than 30 bp were used for alignment. The RNAseq reads were aligned to the custom diploid genome to minimize single reference genome alignment bias.32,33,75,76
HISAT2 version: 2.0.034 was used to align RNAseq reads to the diploid genome using the following parameters: –score-min L, 0, −0.2 –mp 6, 6 –known-splicesite-infile known-splicesite-RefSeq-Ensembl.txt. These parameters require at least 96% sequence identity for the RNAseq reads to be aligned. The known splicing junctions in Ensembl and RefSeq databases were downloaded from the Bovine Genome Database http://www.bovinegenome.org. 77 The alignment of the RNAseq reads to the diploid genome was then merged to identify: i) reads that were aligned to the same single genomic position in both the B. t. taurus reference genome and the pseudo B. t. indicus genome, and ii) reads that were uniquely aligned to either genome but not aligned to the other.
Transcript assembly and determination of transcript abundance
Cufflinks version 2.2.178 was used for transcript assembly of each RNAseq library. Cuffmerge version 2.2.178 was used to generate a unified gene annotation for all libraries. Gene models generated by Cuffmerge were then compared to Ensembl and RefSeq gene models using Cuffcompare version 2.2.1.78 If a Cuffmerge gene model matched one Ensembl/RefSeq gene model (i.e., shared the same intron chain; class_code “=”), this Cuffmerge gene model was considered annotated. If a cuffmerge gene model did not match any Ensembl/RefSeq gene model (e.g., class_code “u” or “x”), it was considered unannotated. In addition, if a single Cuffmerge gene model matched more than one Ensembl/RefSeq gene model, the Cuffmerge gene model was replaced by the corresponding Ensembl/RefSeq gene models.
RNAseq read counts for each gene model were generated using HTSeq-count version 0.5.479 with mode: intersection-nonempty. Read counts were then normalized to the library size using Bioconductor package edgeR version 3.8.6.80,81 For each tissue type, genes with ≥ 4 counts/million (CPM) between all conceptuses were considered to be expressed and were retained for allele-specific expression analyses.
Identification of SNPs in the B. t. indicus × B. t. taurus F1 conceptuses transcriptomes using RNAseq
The SNPiR pipeline36 was adapted to identify SNPs from the RNAseq data. The adapted SNPiR pipeline included 3 major steps: i) align RNAseq reads to the diploid UMD3.1/B. t. indicus genome using BWA mem,35 ii) call variants using GATK UnifiedGenotyper,30 and iii) filter potential false positive variants (as described below). For read mapping, BWA mem version 0.7.735 was used to align the reads to the diploid genome using default parameters. As BWA does not align reads that span splice junctions, we next aligned the unmapped reads to the known splice junctions http://www.bovinegenome.org.77 The RNAseq reads that were successfully aligned to the diploid genome were then merged with the splice junction alignments. The uniquely aligned RNAseq reads were subjected to PCR duplicates removal (only for the purpose of SNP identification), insertions/deletions re-alignment, and base quality recalibration. All RNAseq read alignments from each conceptus were then pooled for SNP calling. GATK UnifiedGenotyper was used to call variants using the following loose criteria: -stand_call_conf 0 –stand_emit_conf 0 –mbq 20 –output_mode EMIT_ALL_CONFIDENT_SITES –U ALLOW_N_CIGAR_READS. The last step of these analyses was to apply a series of stringent filtering steps to remove potential false positive variants. Specifically, variants were required to have quality Q > 20 and all variants that were only found at the end (< 6 bp to read ends) of aligned reads were discarded. Further, RNA variants in repetitive regions annotated by UCSC (http://hgdownload.cse.ucsc.edu/goldenPath/bosTau6/database/) were discarded and variants that were in a homopolymer runs ≥ 5 bp were also removed. In addition, intronic variants that were within 4 bp of splice junctions were discarded. Finally, to ensure that the reads supporting the variants were uniquely aligned, BLAT version 3482 was used to re-align these reads to the reference genome. A read alignment was required to meet 2 criteria to be considered as a unique mapping: i) the best alignment hit overlapped the variant site, and ii) the second best hit resulted in a <95% sequence identity to the reference genome. Only the variants for which at least half of the alignments were unique to the reference genome were retained for further analyses.
To minimize potential false positives, only the RNA variants identified by both the HISAT2 and BWA alignment strategies were used for further analyses. Further, the RNA variants that were supported by the B. t. indicus DNAseq reads and/or were present in RefSeq and Ensembl dbSNP (downloaded from RefSeq and Ensembl FTP sites) were defined as genomic variants, while others were defined as RDDs. It should be noted that if a SNP in dbSNP was submitted with molecular type as “cDNA,” this SNP was considered to be an RDD (i.e., a potential RNA editing site). The genomic variants were considered to be the result of SNPs and were used to assign RNAseq reads to parental alleles for allele-specific gene expression analyses, while the RDDs were used to identify A-to-I RNA editing sites. Finally, the transition/transversion (Ts/Tv) is the number of transition variants (purine-to-purine, pyrimidine-to-pyrimidine) to the number of transversion variants (purine-to-pyrimidine, pyrimidine-to-purine).
Identification of A-to-I RNA editing sites using the RNAseq data of B. t. indicus × B. t. taurus F1 conceptuses
The RDDs were subjected to further filtering to identify A-to-I RNA editing sites. Only the RDDs that were detected in the same tissue for all 4 conceptuses (≥ 10 reads coverage/conceptus) were retained for further analyses. The rationale for this was that true A-to-I RNA editing sites should be present in all animals while low frequency SNPs should not.38 It should be noted that the RNAseq reads for brain, liver, and skeletal muscle of Control #2 were of 50 bp in length and for these samples, the RDDs were kept for further analyses if they were present in Control #1, #3, and #4 conceptuses (all 100 bp reads). Finally, the RDDs were manually annotated to determine the variant type (e.g., A > G or T > C) according to the DNA strand of the transcript template. For example, if a “T > C” variant was in a transcript that was transcribed from the antisense DNA strand then the variant type was converted from “T > C” to “A > G.” Only the RDDs that had the “A > G” variant type were considered candidate A-to-I RNA editing sites.
To determine whether any of the A-to-I RNA editing sites identified in bovine day ∼105 conceptuses were conserved in human and/or mouse, 40 bp upstream and downstream sequences39 of the bovine A-to-I RNA editing site were BLAST against the human (hg19) and mouse builds (mm9). Both human and mouse genomes were downloaded from the UCSC database (http://hgdownload.soe.ucsc.edu/goldenPath/hg19/bigZips/; http://hgdownload.soe.ucsc.edu/goldenPath/mm9/bigZips/, respectively). For a site to be considered to be conserved between bovine, mouse, and/or human, 70 of the 81 nucleotides had to provide a perfect match39 and the site had to have previously been reported to be an A-to-I RNA editing site. The previously identified editing sites in human and mouse were downloaded from the RADAR database http://rnaedit.com.83
Allele-specific gene expression analyses using the RNAseq data of B. t. indicus × B. t. taurus F1 conceptuses
The DNA variants of the B. t. indicus sire were used to determine the allele-origin of the RNAseq reads in the B. t. indicus × B. t. taurus F1 hybrids. As illustrated in Fig. S5, only SNP sites that were homozygous in the B. t. indicus sire and for which the SNP was heterozygous or an alternate homozygote in the conceptuses were used to determine the allele-origin of the RNAseq reads. Following the allele-origin assignment, allele-specific read counts for SNPs in the same gene were aggregated for allele-specific gene expression analyses, as this strategy has been shown to improve the sensitivity of prediction of imprinted genes using RNAseq.22 To identify genes with monoallelic expression in each tissue type, allele-specific read counts of the same gene were pooled for all 4 individuals and the significance of allelic expression bias was determined using the binomial test (see statistical analyses section). To further filter potential false positives, these candidate genes were manually inspected using the Integrative Genomic Viewer (IGV)40 and genes with spurious alignment of the RNAseq reads or discordant allelic bias of the SNPs within the same exon were discarded.
Validation of the A-to-I RNA editing sites in B. t. indicus × B. t. taurus F1 hybrids
DNA and cDNA of the B. t. indicus × B. t. taurus F1 conceptuses were amplified by PCR and were subjected to Sanger sequencing to validate the A-to-I RNA editing sites identified by RNAseq. Nucleic acid isolation, cDNA synthesis, and PCR amplification were as previously reported.12,13 Primer information may be found in Table S7.
Validation of the allele-specific gene expression in B. t. indicus × B. t. taurus F1 hybrids
To validate the allele specificity of the monoallelically expressed genes, both DNA and cDNA of the F1 hybrids and DNA of the sire were amplified by PCR and sequenced over the SNP sites used to ascribe parental origin of the transcripts. Nucleic acid isolation, cDNA synthesis, and PCR amplifications were as previously reported.12,13 Primer information may be found in Table S7.
Corroboration of the allele-specific gene expression in day 86 B. t. taurus × B. t. taurus conceptuses
B. t. taurus females (i.e., Holstein breed) were subjected to estrous synchronization and artificial insemination with sex-sorted semen from a single B. t. taurus bull (i.e., Holstein breed; 507HO10723 DE-SU 527 SPUR-ET). Nine B. t. taurus × B. t. taurus female conceptuses were collected at day 86 of gestation. At collection, 1 × 1 mm2 samples of internal organs including brain, kidney, liver, skeletal muscle and fetal placenta (intercotyledon area) were snap frozen in liquid nitrogen and stored at −80°C. Both DNA and cDNA of the B. t. taurus × B. t. taurus conceptuses and DNA of the B. t. taurus sire were amplified by PCR to corroborate the parental-specific gene expression (i.e., imprinted status) of the identified monoallelically expressed genes detected in the B. t. indicus × B. t. taurus F1 hybrids. Nucleic acid isolation, cDNA synthesis, and PCR amplification were as previously reported.12,13 Primer information may be found in Table S7.
DNA methylation analysis at GNAS/GNASXL domain
Bisulfite mutagenesis of genomic DNA was performed following the One-Step Modification Procedure of the Imprint DNA Modification Kit (Sigma). Methyl Primer Express Software (version 1.0, Applied Biosystems) was used to design primers that amplify regions proximal to the GNAS and GNASXL promoters. Both amplicons spanned SNPs identified by the whole genome sequencing of the B. t. indicus sire. Bisulfite PCR reactions were as previously reported.12,13 The cycling programs were as follows: initial denaturation at 94°C for 2 minutes and 15 seconds, 45 cycles of 94°C for 30 seconds, 56.1/58.7°C for 45 seconds (ramping rate: 1°C/second), and 72°C for 45 seconds, and final extension at 72°C for 5 minutes. The PCR products were resolved by agarose gel electrophoresis and isolated as previously described.12 The PCR amplicons were cloned using pGEM-T Easy Vector System (Promega) according to the manufacturer's instructions. Bacteria used were NEB 5-α F'Iq Competent E. coli (NEB). Bacteria colonies were screened by blue-white screen method and positive colonies were subject to Sanger sequencing as described above.
Statistical analyses
All RNAseq libraries were normalized by the trimmed mean of M-values method.84 For each gene, a binomial exact test was applied to examine if the B. t. indicus or B. t. taurus allele represented more than 85% of all reads.13 Genes were then ranked by their P-values and adjusted to compute false discovery rates (FDRs) using the Storey method.85 Genes for which the FDR was less than 0.05 were considered to be monoallelically expressed.
Data access
The DNAseq reads from the B. t. indicus sire and the RNAseq reads from the B. t. indicus × B. t. taurus F1 conceptuses are available in the NCBI Gene Expression Omnibus (GEO) database (http://www.ncbi.nlm.nih.gov/geo/) under accession numbers GSE77389 (DNAseq reads of the sire and RNAseq reads of the placenta) and GSE63509 (RNAseq reads of the brain, kidney, liver, and skeletal muscle). The sequences of the unannotated transcripts identified in this study have been submitted to GenBank (http://www.ncbi.nlm.nih.gov/genbank/) under accession numbers KU530101-KU530107.
Supplementary Material
Acknowledgments
We thank Dr. Alan Ealy for providing the CT1 cell line as a kind gift. We thank Dr. Robert Schnabel for querying the SNP information of Holstein cattle. We thank Dr. Jonathan Green and Dr. Kevin Wells for helpful discussions regarding the CT1 cells. We also thank Dr. Jerry Taylor for critical reading and commenting on the manuscript. This work was supported by the National Institutes of Health (Grant 5R21HD062920), the Food for the 21st Century Program at the University of Missouri, United States Department of Agriculture National Institute of Food and Agriculture (AFRI 2011-67015-30688).
Disclosure of potential conflicts of interest
No potential conflicts of interest were disclosed.
Ethics approval
All animal procedures were performed at TransOva Genetics by veterinarians, and all procedures were approved by TransOva's animal care and use committee.
References
- 1.Bartolomei MS, Ferguson-Smith AC. Mammalian genomic imprinting. Cold Spring Harb Perspect Biol 2011; 3:1-18; PMID:21576252; http://dx.doi.org/ 10.1101/cshperspect.a002592 [DOI] [PMC free article] [PubMed] [Google Scholar]
- 2.Peters J. The role of genomic imprinting in biology and disease: an expanding view. Nat Rev Genet 2014; 15:517-30; PMID:24958438; http://dx.doi.org/ 10.1038/nrg3766 [DOI] [PubMed] [Google Scholar]
- 3.Kalish JM, Jiang C, Bartolomei MS. Epigenetics and imprinting in human disease. Int J Dev Biol 2014; 58:291-8; PMID:25023695; http://dx.doi.org/ 10.1387/ijdb.140077mb [DOI] [PubMed] [Google Scholar]
- 4.Lim DH, Maher ER. Genomic imprinting syndromes and cancer. Adv Genet 2010; 70:145-75; PMID:20920748; http://dx.doi.org/ 10.1016/B978-0-12-380866-0.60006-X [DOI] [PubMed] [Google Scholar]
- 5.Bartolomei MS, Zemel S, Tilghman SM. Parental imprinting of the mouse H19 gene. Nature 1991; 351:153-5; PMID:1709450; http://dx.doi.org/ 10.1038/351153a0 [DOI] [PubMed] [Google Scholar]
- 6.DeChiara TM, Robertson EJ, Efstratiadis A. Parental imprinting of the mouse insulin-like growth factor II gene. Cell 1991; 64:849-59; PMID:1997210; http://dx.doi.org/ 10.1016/0092-8674(91)90513-X [DOI] [PubMed] [Google Scholar]
- 7.Barlow DP, Stoger R, Herrmann BG, Saito K, Schweifer N. The mouse insulin-like growth factor type-2 receptor is imprinted and closely linked to the Tme locus. Nature 1991; 349:84-7; PMID:1845916; http://dx.doi.org/ 10.1038/349084a0 [DOI] [PubMed] [Google Scholar]
- 8.Tian XC. Genomic imprinting in farm animals. Annu Rev Anim Biosci 2014; 2:23-40; PMID:25384133; http://dx.doi.org/ 10.1146/annurev-animal-022513-114144 [DOI] [PubMed] [Google Scholar]
- 9.Robbins KM, Chen Z, Wells KD, Rivera RM. Expression of KCNQ1OT1, CDKN1C, H19, and PLAGL1 and the methylation patterns at the KvDMR1 and H19/IGF2 imprinting control regions is conserved between human and bovine. J Biomed Sci 2012; 19:95; PMID:23153226; http://dx.doi.org/ 10.1186/1423-0127-19-95 [DOI] [PMC free article] [PubMed] [Google Scholar]
- 10.Bischoff SR, Tsai S, Hardison N, Motsinger-Reif AA, Freking BA, Nonneman D, Rohrer G, Piedrahita JA. Characterization of conserved and nonconserved imprinted genes in swine. Biol Reprod 2009; 81:906-20; PMID:19571260; http://dx.doi.org/ 10.1095/biolreprod.109.078139 [DOI] [PMC free article] [PubMed] [Google Scholar]
- 11.Zaitoun I, Khatib H. Assessment of genomic imprinting of SLC38A4, NNAT, NAP1L5, and H19 in cattle. BMC Genet 2006; 7:49; PMID:17064418; http://dx.doi.org/ 10.1186/1471-2156-7-49 [DOI] [PMC free article] [PubMed] [Google Scholar]
- 12.Chen Z, Robbins KM, Wells KD, Rivera RM. Large offspring syndrome: a bovine model for the human loss-of-imprinting overgrowth syndrome Beckwith-Wiedemann. Epigenetics 2013; 8:591-601; PMID:23751783; http://dx.doi.org/ 10.4161/epi.24655 [DOI] [PMC free article] [PubMed] [Google Scholar]
- 13.Chen Z, Hagen DE, Elsik CG, Ji T, Morris CJ, Moon LE, Rivera RM. Characterization of global loss of imprinting in fetal overgrowth syndrome induced by assisted reproduction. Proc Natl Acad Sci U S A 2015; 112:4618-23; PMID:25825726; http://dx.doi.org/ 10.1073/pnas.1422088112 [DOI] [PMC free article] [PubMed] [Google Scholar]
- 14.Okamura K, Sakaki Y, Ito T. Comparative genomics approach toward critical determinants for the imprinting of an evolutionarily conserved gene Impact. Biochem Biophys Res Commun 2005; 329:824-30; PMID:15752730; http://dx.doi.org/ 10.1016/j.bbrc.2005.02.048 [DOI] [PubMed] [Google Scholar]
- 15.Young LE, Schnieke AE, McCreath KJ, Wieckowski S, Konfortova G, Fernandes K, Ptak G, Kind AJ, Wilmut I, Loi P, et al.. Conservation of IGF2-H19 and IGF2R imprinting in sheep: effects of somatic cell nuclear transfer. Mech Dev 2003; 120:1433-42; PMID:14654216; http://dx.doi.org/ 10.1016/j.mod.2003.09.006 [DOI] [PubMed] [Google Scholar]
- 16.Young LE, Fernandes K, McEvoy TG, Butterwith SC, Gutierrez CG, Carolan C, Broadbent PJ, Robinson JJ, Wilmut I, Sinclair KD. Epigenetic change in IGF2R is associated with fetal overgrowth after sheep embryo culture. Nat Genet 2001; 27:153-4; PMID:11175780; http://dx.doi.org/ 10.1038/84769 [DOI] [PubMed] [Google Scholar]
- 17.Farin PW, Piedrahita JA, Farin CE. Errors in development of fetuses and placentas from in vitro-produced bovine embryos. Theriogenology 2006; 65:178-91; PMID:16266745; http://dx.doi.org/ 10.1016/j.theriogenology.2005.09.022 [DOI] [PubMed] [Google Scholar]
- 18.Young LE, Sinclair KD, Wilmut I. Large offspring syndrome in cattle and sheep. Rev Reprod 1998; 3:155-63; PMID:9829550; http://dx.doi.org/ 10.1530/ror.0.0030155 [DOI] [PubMed] [Google Scholar]
- 19.Wang X, Clark AG. Using next-generation RNA sequencing to identify imprinted genes. Heredity 2014; 113:156-66; PMID:24619182; http://dx.doi.org/ 10.1038/hdy.2014.18 [DOI] [PMC free article] [PubMed] [Google Scholar]
- 20.Babak T, Deveale B, Armour C, Raymond C, Cleary MA, van der Kooy D, Johnson JM, Lim LP. Global survey of genomic imprinting by transcriptome sequencing. Curr Biol 2008; 18:1735-41; PMID:19026546; http://dx.doi.org/ 10.1016/j.cub.2008.09.044 [DOI] [PubMed] [Google Scholar]
- 21.Wang X, Sun Q, McGrath SD, Mardis ER, Soloway PD, Clark AG. Transcriptome-wide identification of novel imprinted genes in neonatal mouse brain. PloS One 2008; 3:e3839; PMID:19052635; http://dx.doi.org/ 10.1371/journal.pone.0003839 [DOI] [PMC free article] [PubMed] [Google Scholar]
- 22.DeVeale B, van der Kooy D, Babak T. Critical evaluation of imprinted gene expression by RNA-Seq: a new perspective. PLoS Genet 2012; 8:e1002600; PMID:22479196; http://dx.doi.org/ 10.1371/journal.pgen.1002600 [DOI] [PMC free article] [PubMed] [Google Scholar]
- 23.Baran Y, Subramaniam M, Biton A, Tukiainen T, Tsang EK, Rivas MA, Pirinen M, Gutierrez-Arcelus M, Smith KS, Kukurba KR, et al.. The landscape of genomic imprinting across diverse adult human tissues. Genome Res 2015; 25:927-36; PMID:25953952; http://dx.doi.org/ 10.1101/gr.192278.115 [DOI] [PMC free article] [PubMed] [Google Scholar]
- 24.Lee JT, Bartolomei MS. X-inactivation, imprinting, and long noncoding RNAs in health and disease. Cell 2013; 152:1308-23; PMID:23498939; http://dx.doi.org/ 10.1016/j.cell.2013.02.016 [DOI] [PubMed] [Google Scholar]
- 25.Lyon MF. Gene action in the X-chromosome of the mouse (Mus musculus L.). Nature 1961; 190:372-3; PMID:13764598; http://dx.doi.org/ 10.1038/190372a0 [DOI] [PubMed] [Google Scholar]
- 26.Huynh KD, Lee JT. Imprinted X inactivation in eutherians: a model of gametic execution and zygotic relaxation. Curr Opin Cell Biol 2001; 13:690-7; PMID:11698184; http://dx.doi.org/ 10.1016/S0955-0674(00)00272-6 [DOI] [PubMed] [Google Scholar]
- 27.Wake N, Takagi N, Sasaki M. Non-random inactivation of X chromosome in the rat yolk sac. Nature 1976; 262:580-1; PMID:958416; http://dx.doi.org/ 10.1038/262580a0 [DOI] [PubMed] [Google Scholar]
- 28.Xue F, Tian XC, Du F, Kubota C, Taneja M, Dinnyes A, Dai Y, Levine H, Pereira LV, Yang X. Aberrant patterns of X chromosome inactivation in bovine clones. Nat Genet 2002; 31:216-20; PMID:12032569; http://dx.doi.org/ 10.1038/ng900 [DOI] [PubMed] [Google Scholar]
- 29.MacHugh DE, Shriver MD, Loftus RT, Cunningham P, Bradley DG. Microsatellite DNA variation and the evolution, domestication and phylogeography of taurine and zebu cattle (Bos taurus and Bos indicus). Genetics 1997; 146:1071-86; PMID:9215909 [DOI] [PMC free article] [PubMed] [Google Scholar]
- 30.McKenna A, Hanna M, Banks E, Sivachenko A, Cibulskis K, Kernytsky A, Garimella K, Altshuler D, Gabriel S, Daly M, et al.. The Genome Analysis Toolkit: a MapReduce framework for analyzing next-generation DNA sequencing data. Genome Res 2010; 20:1297-303; PMID:20644199; http://dx.doi.org/ 10.1101/gr.107524.110 [DOI] [PMC free article] [PubMed] [Google Scholar]
- 31.Li H. A statistical framework for SNP calling, mutation discovery, association mapping and population genetical parameter estimation from sequencing data. Bioinformatics 2011; 27:2987-93; PMID:21903627; http://dx.doi.org/ 10.1093/bioinformatics/btr509 [DOI] [PMC free article] [PubMed] [Google Scholar]
- 32.Degner JF, Marioni JC, Pai AA, Pickrell JK, Nkadori E, Gilad Y, Pritchard JK. Effect of read-mapping biases on detecting allele-specific expression from RNA-sequencing data. Bioinformatics 2009; 25:3207-12; PMID:19808877; http://dx.doi.org/ 10.1093/bioinformatics/btp579 [DOI] [PMC free article] [PubMed] [Google Scholar]
- 33.Stevenson KR, Coolon JD, Wittkopp PJ. Sources of bias in measures of allele-specific expression derived from RNA-sequence data aligned to a single reference genome. BMC Genomics 2013; 14:536; PMID:23919664; http://dx.doi.org/ 10.1186/1471-2164-14-536 [DOI] [PMC free article] [PubMed] [Google Scholar]
- 34.Kim D, Langmead B, Salzberg SL. HISAT: a fast spliced aligner with low memory requirements. Nat Methods 2015; 12:357-60; PMID:25751142; http://dx.doi.org/ 10.1038/nmeth.3317 [DOI] [PMC free article] [PubMed] [Google Scholar]
- 35.Li H, Durbin R. Fast and accurate short read alignment with Burrows-Wheeler transform. Bioinformatics 2009; 25:1754-60; PMID:19451168; http://dx.doi.org/ 10.1093/bioinformatics/btp324 [DOI] [PMC free article] [PubMed] [Google Scholar]
- 36.Piskol R, Ramaswami G, Li JB. Reliable identification of genomic variants from RNA-seq data. Am J Hum Genet 2013; 93:641-51; PMID:24075185; http://dx.doi.org/ 10.1016/j.ajhg.2013.08.008 [DOI] [PMC free article] [PubMed] [Google Scholar]
- 37.Nishikura K. Functions and regulation of RNA editing by ADAR deaminases. Annu Rev Biochem 2010; 79:321-49; PMID:20192758; http://dx.doi.org/ 10.1146/annurev-biochem-060208-105251 [DOI] [PMC free article] [PubMed] [Google Scholar]
- 38.Ramaswami G, Zhang R, Piskol R, Keegan LP, Deng P, O'Connell MA, Li JB. Identifying RNA editing sites using RNA sequencing data alone. Nat Methods 2013; 10:128-32; PMID:23291724; http://dx.doi.org/ 10.1038/nmeth.2330 [DOI] [PMC free article] [PubMed] [Google Scholar]
- 39.Pinto Y, Cohen HY, Levanon EY. Mammalian conserved ADAR targets comprise only a small fragment of the human editosome. Genome Biol 2014; 15:R5; PMID:24393560; http://dx.doi.org/ 10.1186/gb-2014-15-1-r5 [DOI] [PMC free article] [PubMed] [Google Scholar]
- 40.Robinson JT, Thorvaldsdottir H, Winckler W, Guttman M, Lander ES, Getz G, Mesirov JP. Integrative genomics viewer. Nat Biotechnol 2011; 29:24-6; PMID:21221095; http://dx.doi.org/ 10.1038/nbt.1754 [DOI] [PMC free article] [PubMed] [Google Scholar]
- 41.Pruitt KD, Brown GR, Hiatt SM, Thibaud-Nissen F, Astashyn A, Ermolaeva O, Farrell CM, Hart J, Landrum MJ, McGarvey KM, et al.. RefSeq: an update on mammalian reference sequences. Nucleic Acids Res 2014; 42:D756-63; PMID:24259432; http://dx.doi.org/ 10.1093/nar/gkt1114 [DOI] [PMC free article] [PubMed] [Google Scholar]
- 42.Wang L, Park HJ, Dasari S, Wang S, Kocher JP, Li W. CPAT: Coding-Potential Assessment Tool using an alignment-free logistic regression model. Nucleic Acids Res 2013; 41:e74; PMID:23335781; http://dx.doi.org/ 10.1093/nar/gkt006 [DOI] [PMC free article] [PubMed] [Google Scholar]
- 43.Billerey C, Boussaha M, Esquerre D, Rebours E, Djari A, Meersseman C, Klopp C, Gautheret D, Rocha D. Identification of large intergenic non-coding RNAs in bovine muscle using next-generation transcriptomic sequencing. BMC Genomics 2014; 15:499; PMID:24948191; http://dx.doi.org/ 10.1186/1471-2164-15-499 [DOI] [PMC free article] [PubMed] [Google Scholar]
- 44.Dindot SV, Kent KC, Evers B, Loskutoff N, Womack J, Piedrahita JA. Conservation of genomic imprinting at the XIST, IGF2, and GTL2 loci in the bovine. Mamm Genome 2004; 15:966-74; PMID:15599555; http://dx.doi.org/ 10.1007/s00335-004-2407-z [DOI] [PubMed] [Google Scholar]
- 45.Wang X, Miller DC, Clark AG, Antczak DF. Random X inactivation in the mule and horse placenta. Genome Res 2012; 22:1855-63; PMID:22645258; http://dx.doi.org/ 10.1101/gr.138487.112 [DOI] [PMC free article] [PubMed] [Google Scholar]
- 46.McGraw S, Oakes CC, Martel J, Cirio MC, de Zeeuw P, Mak W, Plass C, Bartolomei MS, Chaillet JR, Trasler JM. Loss of DNMT1o disrupts imprinted X chromosome inactivation and accentuates placental defects in females. PLoS Genet 2013; 9:e1003873; PMID:24278026; http://dx.doi.org/ 10.1371/journal.pgen.1003873 [DOI] [PMC free article] [PubMed] [Google Scholar]
- 47.Merzouk S, Deuve JL, Dubois A, Navarro P, Avner P, Morey C. Lineage-specific regulation of imprinted X inactivation in extraembryonic endoderm stem cells. Epigenetics Chromatin 2014; 7:11; PMID:25053977; http://dx.doi.org/ 10.1186/1756-8935-7-11 [DOI] [PMC free article] [PubMed] [Google Scholar]
- 48.Das PJ, Chowdhary BP, Raudsepp T. Characterization of the bovine pseudoautosomal region and comparison with sheep, goat, and other mammalian pseudoautosomal regions. Cytogenet Genome Res 2009; 126:139-47; PMID:20016163; http://dx.doi.org/ 10.1159/000245913 [DOI] [PubMed] [Google Scholar]
- 49.Luckett WP. Origin and differentiation of the yolk sac and extraembryonic mesoderm in presomite human and rhesus monkey embryos. Am J Anat 1978; 152:59-97; PMID:98035; http://dx.doi.org/ 10.1002/aja.1001520106 [DOI] [PubMed] [Google Scholar]
- 50.Bianchi DW, Wilkins-Haug LE, Enders AC, Hay ED. Origin of extraembryonic mesoderm in experimental animals: relevance to chorionic mosaicism in humans. Am J Med Genet 1993; 46:542-50; PMID:8322818; http://dx.doi.org/ 10.1002/ajmg.1320460517 [DOI] [PubMed] [Google Scholar]
- 51.Dobbs KB, Gagne D, Fournier E, Dufort I, Robert C, Block J, Sirard MA, Bonilla L, Ealy AD, Loureiro B, et al.. Sexual dimorphism in developmental programming of the bovine preimplantation embryo caused by colony-stimulating factor 2. Biol Reprod 2014; 91:80; PMID:25078682; http://dx.doi.org/ 10.1095/biolreprod.114.121087 [DOI] [PubMed] [Google Scholar]
- 52.Talbot NC, Caperna TJ, Edwards JL, Garrett W, Wells KD, Ealy AD. Bovine blastocyst-derived trophectoderm and endoderm cell cultures: interferon tau and transferrin expression as respective in vitro markers. Biol Reprod 2000; 62:235-47; PMID:10642558; http://dx.doi.org/ 10.1095/biolreprod62.2.235 [DOI] [PubMed] [Google Scholar]
- 53.van Leeuwen J, Berg DK, Pfeffer PL. Morphological and gene expression changes in cattle embryos from hatched blastocyst to early gastrulation stages after transfer of in vitro produced embryos. PloS One 2015; 10:e0129787; PMID:26076128; http://dx.doi.org/ 10.1371/journal.pone.0129787 [DOI] [PMC free article] [PubMed] [Google Scholar]
- 54.Edwards CA, Ferguson-Smith AC. Mechanisms regulating imprinted genes in clusters. Curr Opin Cell Biol 2007; 19:281-9; PMID:17467259; http://dx.doi.org/ 10.1016/j.ceb.2007.04.013 [DOI] [PubMed] [Google Scholar]
- 55.Wan LB, Bartolomei MS. Regulation of imprinting in clusters: noncoding RNAs versus insulators. Adv Genet 2008; 61:207-23; PMID:18282507; http://dx.doi.org/ 10.1016/S0065-2660(07)00007-7 [DOI] [PubMed] [Google Scholar]
- 56.Rougeulle C, Cardoso C, Fontes M, Colleaux L, Lalande M. An imprinted antisense RNA overlaps UBE3A and a second maternally expressed transcript. Nat Genet 1998; 19:15-6; PMID:9590281; http://dx.doi.org/ 10.1038/ng0598-15 [DOI] [PubMed] [Google Scholar]
- 57.Meng L, Person RE, Beaudet AL. Ube3a-ATS is an atypical RNA polymerase II transcript that represses the paternal expression of Ube3a. Hum Mol Genet 2012; 21:3001-12; PMID:22493002; http://dx.doi.org/ 10.1093/hmg/dds130 [DOI] [PMC free article] [PubMed] [Google Scholar]
- 58.Rockman MV, Kruglyak L. Genetics of global gene expression. Nat Rev Genet 2006; 7:862-72; PMID:17047685; http://dx.doi.org/ 10.1038/nrg1964 [DOI] [PubMed] [Google Scholar]
- 59.Whitacre LK, Tizioto PC, Kim J, Sonstegard TS, Schroeder SG, Alexander LJ, Medrano JF, Schnabel RD, Taylor JF, Decker JE. What's in your next-generation sequence data? An exploration of unmapped DNA and RNA sequence reads from the bovine reference individual. BMC Genomics 2015; 16:1114; PMID:26714747; http://dx.doi.org/ 10.1186/s12864-015-2313-7 [DOI] [PMC free article] [PubMed] [Google Scholar]
- 60.Choo JH, Kim JD, Kim J. Imprinting of an evolutionarily conserved antisense transcript gene APeg3. Gene 2008; 409:28-33; PMID:18166281; http://dx.doi.org/ 10.1016/j.gene.2007.10.036 [DOI] [PMC free article] [PubMed] [Google Scholar]
- 61.Levin JZ, Yassour M, Adiconis X, Nusbaum C, Thompson DA, Friedman N, Gnirke A, Regev A. Comprehensive comparative analysis of strand-specific RNA sequencing methods. Nat Methods 2010; 7:709-15; PMID:20711195; http://dx.doi.org/ 10.1038/nmeth.1491 [DOI] [PMC free article] [PubMed] [Google Scholar]
- 62.Deng Q, Ramskold D, Reinius B, Sandberg R. Single-cell RNA-seq reveals dynamic, random monoallelic gene expression in mammalian cells. Science 2014; 343:193-6; PMID:24408435; http://dx.doi.org/ 10.1126/science.1245316 [DOI] [PubMed] [Google Scholar]
- 63.Yamasaki K, Joh K, Ohta T, Masuzaki H, Ishimaru T, Mukai T, Niikawa N, Ogawa M, Wagstaff J, Kishino T. Neurons but not glial cells show reciprocal imprinting of sense and antisense transcripts of Ube3a. Hum Mol Genet 2003; 12:837-47; PMID:12668607; http://dx.doi.org/ 10.1093/hmg/ddg106 [DOI] [PubMed] [Google Scholar]
- 64.Ramaswami G, Lin W, Piskol R, Tan MH, Davis C, Li JB. Accurate identification of human Alu and non-Alu RNA editing sites. Nat Methods 2012; 9:579-81; PMID:22484847; http://dx.doi.org/ 10.1038/nmeth.1982 [DOI] [PMC free article] [PubMed] [Google Scholar]
- 65.Danecek P, Nellaker C, McIntyre RE, Buendia-Buendia JE, Bumpstead S, Ponting CP, Flint J, Durbin R, Keane TM, Adams DJ. High levels of RNA-editing site conservation amongst 15 laboratory mouse strains. Genome Biol 2012; 13:26; PMID:22524474; http://dx.doi.org/ 10.1186/gb-2012-13-4-r26 [DOI] [PMC free article] [PubMed] [Google Scholar]
- 66.Neeman Y, Levanon EY, Jantsch MF, Eisenberg E. RNA editing level in the mouse is determined by the genomic repeat repertoire. Rna 2006; 12:1802-9; PMID:16940548; http://dx.doi.org/ 10.1261/rna.165106 [DOI] [PMC free article] [PubMed] [Google Scholar]
- 67.Li JB, Church GM. Deciphering the functions and regulation of brain-enriched A-to-I RNA editing. Nat Neurosci 2013; 16:1518-22; PMID:24165678; http://dx.doi.org/ 10.1038/nn.3539 [DOI] [PMC free article] [PubMed] [Google Scholar]
- 68.Rueter SM, Dawson TR, Emeson RB. Regulation of alternative splicing by RNA editing. Nature 1999; 399:75-80; PMID:10331393; http://dx.doi.org/ 10.1038/19992 [DOI] [PubMed] [Google Scholar]
- 69.Liddicoat BJ, Piskol R, Chalk AM, Ramaswami G, Higuchi M, Hartner JC, Li JB, Seeburg PH, Walkley CR. RNA editing by ADAR1 prevents MDA5 sensing of endogenous dsRNA as nonself. Science 2015; 349:1115-20; PMID:26275108; http://dx.doi.org/ 10.1126/science.aac7049 [DOI] [PMC free article] [PubMed] [Google Scholar]
- 70.Higuchi M, Maas S, Single FN, Hartner J, Rozov A, Burnashev N, Feldmeyer D, Sprengel R, Seeburg PH. Point mutation in an AMPA receptor gene rescues lethality in mice deficient in the RNA-editing enzyme ADAR2. Nature 2000; 406:78-81; PMID:10894545; http://dx.doi.org/ 10.1038/35017558 [DOI] [PubMed] [Google Scholar]
- 71.Cox MP, Peterson DA, Biggs PJ. SolexaQA: At-a-glance quality assessment of Illumina second-generation sequencing data. BMC Bioinformatics 2010; 11:485; PMID:20875133; http://dx.doi.org/ 10.1186/1471-2105-11-485 [DOI] [PMC free article] [PubMed] [Google Scholar]
- 72.Langmead B, Trapnell C, Pop M, Salzberg SL. Ultrafast and memory-efficient alignment of short DNA sequences to the human genome. Genome Biol 2009; 10:R25; PMID:19261174; http://dx.doi.org/ 10.1186/gb-2009-10-3-r25 [DOI] [PMC free article] [PubMed] [Google Scholar]
- 73.DePristo MA, Banks E, Poplin R, Garimella KV, Maguire JR, Hartl C, Philippakis AA, del Angel G, Rivas MA, Hanna M, et al.. A framework for variation discovery and genotyping using next-generation DNA sequencing data. Nat Genet 2011; 43:491-8; PMID:21478889; http://dx.doi.org/ 10.1038/ng.806 [DOI] [PMC free article] [PubMed] [Google Scholar]
- 74.Li H, Handsaker B, Wysoker A, Fennell T, Ruan J, Homer N, Marth G, Abecasis G, Durbin R, Genome Project Data Processing S . The Sequence Alignment/Map format and SAMtools. Bioinformatics 2009; 25:2078-9; PMID:19505943; http://dx.doi.org/ 10.1093/bioinformatics/btp352 [DOI] [PMC free article] [PubMed] [Google Scholar]
- 75.Yuan S, Johnston HR, Zhang G, Li Y, Hu YJ, Qin ZS. One Size Doesn't Fit All - RefEditor: Building Personalized Diploid Reference Genome to Improve Read Mapping and Genotype Calling in Next Generation Sequencing Studies. PLoS Comput Biol 2015; 11:e1004448; PMID:26267278; http://dx.doi.org/ 10.1371/journal.pcbi.1004448 [DOI] [PMC free article] [PubMed] [Google Scholar]
- 76.Munger SC, Raghupathy N, Choi K, Simons AK, Gatti DM, Hinerfeld DA, Svenson KL, Keller MP, Attie AD, Hibbs MA, et al.. RNA-Seq alignment to individualized genomes improves transcript abundance estimates in multiparent populations. Genetics 2014; 198:59-73; PMID:25236449; http://dx.doi.org/ 10.1534/genetics.114.165886 [DOI] [PMC free article] [PubMed] [Google Scholar]
- 77.Elsik CG, Unni DR, Diesh CM, Tayal A, Emery ML, Nguyen HN, Hagen DE. Bovine Genome Database: new tools for gleaning function from the Bos taurus genome. Nucleic Acids Res 2015; 44 (D1): D834-D839; PMID:26481361; http://dx.doi.org/20436464 10.1093/nar/gkv1077 [DOI] [PMC free article] [PubMed] [Google Scholar]
- 78.Trapnell C, Williams BA, Pertea G, Mortazavi A, Kwan G, van Baren MJ, Salzberg SL, Wold BJ, Pachter L. Transcript assembly and quantification by RNA-Seq reveals unannotated transcripts and isoform switching during cell differentiation. Nat Biotechnol 2010; 28:511-5; PMID:20436464; http://dx.doi.org/ 10.1038/nbt.1621 [DOI] [PMC free article] [PubMed] [Google Scholar]
- 79.Anders S, McCarthy DJ, Chen Y, Okoniewski M, Smyth GK, Huber W, Robinson MD. Count-based differential expression analysis of RNA sequencing data using R and Bioconductor. Nat Protoc 2013; 8:1765-86; PMID:23975260; http://dx.doi.org/ 10.1038/nprot.2013.099 [DOI] [PubMed] [Google Scholar]
- 80.Robinson MD, McCarthy DJ, Smyth GK. edgeR: a Bioconductor package for differential expression analysis of digital gene expression data. Bioinformatics 2010; 26:139-40; PMID:19910308; http://dx.doi.org/ 10.1093/bioinformatics/btp616 [DOI] [PMC free article] [PubMed] [Google Scholar]
- 81.McCarthy DJ, Chen Y, Smyth GK. Differential expression analysis of multifactor RNA-Seq experiments with respect to biological variation. Nucleic Acids Res 2012; 40:4288-97; PMID:22287627; http://dx.doi.org/ 10.1093/nar/gks042 [DOI] [PMC free article] [PubMed] [Google Scholar]
- 82.Kent WJ. BLAT–the BLAST-like alignment tool. Genome Res 2002; 12:656-64; PMID:11932250; http://dx.doi.org/ 10.1101/gr.229202 [DOI] [PMC free article] [PubMed] [Google Scholar]
- 83.Ramaswami G, Li JB. RADAR: a rigorously annotated database of A-to-I RNA editing. Nucleic Acids Res 2014; 42:D109-13; PMID:24163250; http://dx.doi.org/ 10.1093/nar/gkt996 [DOI] [PMC free article] [PubMed] [Google Scholar]
- 84.Robinson MD, Oshlack A. A scaling normalization method for differential expression analysis of RNA-seq data. Genome Biol 2010; 11:R25; PMID:20196867; http://dx.doi.org/ 10.1186/gb-2010-11-3-r25 [DOI] [PMC free article] [PubMed] [Google Scholar]
- 85.Storey J. A direct approach to false discovery rates. J Royal Statistical Society 2002; 64:479-98; http://dx.doi.org/ 10.1111/1467-9868.00346 [DOI] [Google Scholar]
Associated Data
This section collects any data citations, data availability statements, or supplementary materials included in this article.