

Abstract
Subjects with heart failure (HF) and a preserved ejection fraction (EF) are heterogenous and the EF used to define this syndrome varies considerably among studies. We sought to determine if physiologic differences exist between subjects with a normal EF (>55%) or mildly decreased EF (40% to 55%). 357 consecutive Chinese patients who were healthy (n = 93) or had HF (n = 264) underwent comprehensive echocardiography, Doppler analysis, and measurement of neurohormones. Subjects with HF were stratified by EF into those with normal EF (>55%, n = 128), mildly decreased EF (40% to 55%, n = 38), or moderate to severely decreased EF (<40%, n = 100). Employing noninvasive pressure–volume analysis, estimated end-systolic and end-diastolic pressure–volume relations were calculated. Subjects with HF and an EF 40% to 55% more often had a previous myocardial infarction and diabetes than those with HF and an EF >55%. Physiologically, the cohort with a mildly decreased EF had eccentrically enlarged ventricles with evidence of remodeling (rightward shifted end-diastolic pressure–volume relation) and decreased chamber contractility (downward shifted end-systolic pressure–volume relation) most comparable to subjects with overt systolic HF. In conclusion, in subjects with HF and a preserved EF, there are distinct physiologic differences between those with a normal (>55%) and a mildly decreased (40% to 55%) EF.
The purpose of this study was to assess and compare clinical features and ventricular properties (characterized by pressure–volume relations) in patients with heart failure (HF) and normal (>55%), preserved (40% to 55%), and decreased (<40%) ejection fraction (EF). For this purpose, we employed noninvasive estimates of pressure–volume-based indexes of chamber function to test the hypothesis that these populations differ from a physiologic perspective.
Methods
Study subjects were inpatients or outpatients seen at the People’s Liberation Army General Hospital (Beijing, China) from September 2005 to February 2008. Consecutive patients (n = 564) seen during that period who had a clinical syndrome of HF (see following criteria) or were without signs of heart disease, without significant pulmonary disease or were admitted for noncardiac complaints (e.g., fever, pulmonary infections, cellulites, etc.) underwent standardized clinical examination, research echocardiography, and evaluation of neurohormones, which were performed without interruption of a subject’s medical therapies. The protocol was reviewed and approved by the institutional review board of the Chinese People’s Liberation Army General Hospital and all subjects provided written informed consent.
Pertinent data from all patients included in this study were reviewed by 2 cardiologists to adjudicate the presence or absence of HF based on Framingham criteria1 and European Society of Cardiology criteria2; the latter were employed when the EF was >50%. Data that were reviewed for this adjudication process included history, physical examination, report of chest x-ray, medication usage, echocardiogram, and blood test results.
Control subjects were identified after a detailed health investigation including history, physical examination, blood tests (e.g., hemoglobin, hepatic function, renal function, blood glucose, lipid panel), chest x-ray, electrocardiogram, and echocardiogram did not demonstrate any abnormality. Specifically excluded from this control group were patients with hypertension, coronary heart disease, diabetes mellitus, renal insufficiency, cardiomyopathy, congenital heart disease, arrhythmias, or chronic obstructive pulmonary diseases, In subjects identified with HF, subjects with known hypertrophic or infiltrative disorders, with the former defined not only by clinical history but also by the presence of a left ventricular wall thickness >15 mm in the setting of a nondilated left ventricle (e.g., left ventricular internal dimension in diastole <45 mm) in the absence of a known stimulus (e.g., hypertension),3,4 were excluded from this analysis (n = 10). From this population we identified 4 groups of patients: (1) those without any cardiovascular disease (control), (2) those with HF and a normal EF (>55%, HFNEF), (3) those with HF and a preserved EF (40% to 55%, HFPEF), and (4) those with HF and a decreased EF (<40%, systolic HF). An EF >55% was employed to define normal because the lower boundary of EF for our controls was 55%.
A professional ultrasound guidelines council technician obtained a complete echocardiogram with the use of a Sequoia 512 ultrasound instrument with a 3.5- to 4.5-MHz sector scanner (Siemens, Munich, Germany). Blood pressure was measured by standard cuff sphygmomanometer in the supine position after a subject rested comfortably for 5 minutes immediately before the performance of echocardiography. Two-dimensional guided M-mode measurements of systolic and diastolic chamber dimensions and wall thickness were obtained according to recommendations of the American Society of Echocardiography,5 and left ventricular mass was derived from a formula described by Devereux and Reichek6 and indexed to body surface area. Valvular regurgitation and stenosis were assessed by standard techniques. Left ventricular end-diastolic and end-systolic volumes and left ventricular EF were calculated with the Simpson biplane method.
Transmitral Doppler left ventricular filling recordings were performed from the apical 4-chamber view and analyzed for diastolic filling indexes, including peak E- and A-wave velocities and their ratio, along with deceleration time. Early diastolic flow propagation velocity in the left ventricle was obtained by a color M-mode Doppler image of left ventricular filling flow in early diastole in the apical 4-chamber view. Early diastolic flow propagation velocity in the left ventricle was measured as the slope of the first aliasing velocity (usually approximately 50% to 75% of the E wave) during early filling, from the mitral valve plane to ≥2 cm distally into the left ventricular cavity at a sweep speed of 100 mm/s. Tissue Doppler imaging was performed in apical 4-chamber and 2-chamber views, and a 1.5-mm sample volume was placed sequentially at the 4 sites of the mitral annulus (septal, lateral, anterior, and inferior) to obtain peak regional myocardial sustained systolic and early diastolic velocities. The velocity from each of the 4 ventricular sites was averaged and the former was used to calculate the time constant of isovolumic relaxation (τ), which was derived from this formula: ([14.70 – mitral annular early diastolic velocity]/0.15).7 Parameters of isovolumetric contraction time, ejection time, and isovolumetric relaxation time were measured by tissue Doppler imaging. Left ventricular end-diastolic pressure was estimated by the formula end-diastolic pressure = 11.96 + 0.596 × E/Em.8
Parameters of end-systolic and end-diastolic pressure–volume relations were estimated using validated single-beat techniques. For the end-systolic pressure–volume relation, this yielded values for the slope and volume axis intercept of the end-systolic pressure–volume relation according to the methods of Chen et al.9 To account for covariance between the slope and volume axis intercept of the end-systolic pressure–volume relation, we also calculated the integrated index of systolic properties defined by the volume at an end-systolic pressure of 120 mm Hg (120/slope of end-systolic pressure–volume relation + volume axis intercept of end-systolic pressure–volume relation). For the end-diastolic pressure–volume relation, we estimated parameters of the equation, end-diastolic pressure = αEDVβ, where α is a scaling constant, EDV is end-diastolic volume, and β is a diastolic stiffness constant according to the methods of Klotz et al.10 To account for covariance between α and β,11 which affect the shape and position of the end-diastolic pressure–volume relation, values of these parameters derived from each subject were used to predict end-diastolic volume at a common end-diastolic pressure of 30 mm Hg ([30/α]1/β) to yield an index of ventricular capacitance.
Effective arterial elastance, a lumped index of vascular hemodynamic load primarily related to total peripheral resistance and heart rate, was estimated as arterial elastance ≈ stroke volume/Pes,12 where Pes is left ventricular end-systolic pressure estimated by 0.9 × systolic blood pressure.13 Blood pressure was measured 3 times just before the echocardiographic examination after ≥½-hour rest.
Blood samples for natriuretic peptide assay were obtained after 10 minutes of rest within 12 hours (after or before) of echocardiographic examination. Samples were shifted into ethylenediaminetetra-acetic acid-anticoagulated tubes immediately and were sent to the laboratory for centrifugation. Upper plasma was collected for storage at −80°C. B-type natriuretic peptide was measured by sandwich immunoassay using commercially available kits (Abbott Laboratories, Abbott Park, Illinois) and N-terminal pro–B-type natriuretic peptide was tested by electrochemiluminescence immunoassay (Roche E 170 Diagnostics, Basel, Switzerland). Endothelin, renin, angiotensin II, and aldosterone were measured using a highly sensitive radioimmunoassay in the endocrine laboratory of the Chinese People’s Liberation Army General Hospital. Specialized staff blinded to clinical data performed all measurements.
Data are expressed as mean ± SD. Among groups, we evaluated the relation between EF and its 2 determinants, end-diastolic volume and stroke volume. One-way analysis of variance with Tukey post-test for multiple comparisons was performed for comparisons of data among groups controlling for differences in age and gender. The primary focus of these comparisons was in subjects with HF and an EF of 40% to 55%, referred to as HFPEF. All statistical analyses were performed with SAS 9.1 (SAS Institute, Cary, North Carolina). A p value <0.05 was considered statistically significant.
Results
Demographic and clinical characteristics of the different cohorts are presented in Table 1. Subjects with HFPEF did not differ in age or gender compared with subjects with systolic HF, whereas those with HFNEF were older and more often women. In subjects with HFPEF, hypertension was less frequent compared with subjects with HFNEF but more frequent than in subjects with systolic HF. This was reflected by higher blood pressure in the HFNEF cohort and a higher rate of β-blocker and calcium channel blocker use. Although the cohorts with HF did not differ with regard to the prevalence of coronary heart disease overall, the prevalence of myocardial infarction was significantly more common in subjects with HFPEF and systolic HF than in those with HFNEF. Atrial fibrillation was more common in the HFNEF cohort compared with the HFPEF cohort, whereas diabetes was more common in the latter group.
Table 1.
Demographic and clinical characteristics
| Parameter | No HF/Normal EF (n = 93) |
HFNEF (n = 128) |
HFPEF (n = 38) |
SHF (n = 98) |
|---|---|---|---|---|
| Age(yrs) | 67 ± 9 | 72 ± 10*† | 66 ± 10 | 62 ± 16* |
| Men | 53% | 65% | 79% | 75% |
| Height (cm) | 165 ± 8 | 166 ± 7 | 168 ± 7 | 167 ± 8 |
| Weight (kg) | 64 ± 12 | 70 ± 12* | 70 ± 11 | 68 ± 13 |
| Body surface area (m2) | 1.70 ± 0.17 | 1.78 ± 0.17*† | 1.79 ± 0.15 | 1.75 ± 0.18‡ |
| Body mass index (kg/m2) | 24 ± 4 | 25 ± 4* | 25 ± 4 | 24 ± .4 |
| Hypertension | 0% | 88%*† | 77%*† | 54%* |
| Coronary heart disease | 0% | 63%* | 65%* | 51%* |
| Myocardial infarction | 0% | 12%*† | 39%*‡ | 27%* |
| Diabetes mellitus | 1% | 33%* | 48%*‡ | 41%* |
| Atrial fibrillation | 1% | 26%*† | 8%*‡ | 10%* |
| Medications | ||||
| Angiotensin-Converting enzyme inhibitor | 0% | 37%*† | 45%* | 50%* |
| Angiotensin receptor blockers | 0% | 11%* | 23%*† | 4%* |
| Calcium channel blocker | 1% | 57%*† | 39%*‡ | 26%* |
| β blocker | 3% | 55%*† | 58%*† | 39%* |
| Diuretics | 0% | 37%*† | 45%*† | 67%* |
| Digoxin | 0% | 10%*† | 23%*† | 46%* |
| Hemodynamics | ||||
| Systolic blood pressure (mm Hg) | 122 ± 11 | 139 ± 22*† | 141 ± 31*† | 126 ± 19‡ |
| Diastolic blood pressure (mm Hg) | 73 ± 7 | 76 ± 12* | 79 ± 14 | 76 ± 11 |
| Heart rate (beats/min) | 68 ± 9 | 71 ± 9*† | 69 ± 8† | 77 ± 13*† |
p <0.05 versus normal.
p <0.05 versus SHF.
p <0.05 versus HFNEF.
SHF = systolic HF.
Values of selected blood test are listed in Table 2. Renal function was worse in the HFNEF and HFPEF cohorts compared with the normal and systolic HF cohorts. B-type natriuretic peptide, N-terminal pro–B-type natriuretic peptide, and renin were moderately increased in the HFNEF and HFPEF groups (which did not differ significantly from each other) and were markedly increased in subjects with systolic HF. Angiotensin II, aldosterone, and endothelin did not differ among groups, with the exception of endothelin, which was mildly increased in the HFNEF group.
Table 2.
Blood tests
| Parameter | No HF/Normal EF (n = 93) |
HFNEF (n = 128) |
HFPEF (n = 38) |
SHF (n = 98) |
|---|---|---|---|---|
| Laboratory results | ||||
| Hemoglobin (g/L) | 146 ± 19 | 135 ± 24 | 145 ± 21 | 134 ± 31 |
| Urea (mmol/L) | 5.5 ± 1.9 | 8.0 ± 4.4* | 10 ± 11* | 8.4 ± 6.4 |
| Creatinine (μmol/l) | 72 ± 19 | 110 ± 93* | 117 ± 94* | 89 ± 57 |
| Estimated glomerular filtration rate (ml/min) | 88 ± 21 | 71 ± 28* | 73 ± 41* | 79 ± 28* |
| Neurohormones | ||||
| B-type natriuretic peptide (pg/ml) | 84 ± 89 | 500 ± 627† | 783 ± 1,058*† | 1,487 ± 1,242*‡ |
| N-terminal pro-B-type natriuretic peptide (pg/ml) | 94 ± 115 | 2,037 ± 3,484* | 5,623 ± 10,234* | 8,110 ± 9,867*‡ |
| Renin (ng/ml) | 0.8 ± 0.8 | 1.4 ± 1.6† | 1.1 ± 0.9† | 3.1 ± 3.3*‡ |
| Angiotensin II (pg/ml) | 46 ± 24 | 41 ± 33 | 59 ± 83 | 60 ± 60 |
| Aldosterone (pg/ml) | 520 ± 154 | 432 ± 201 | 472 ± 203 | 468 ± 351 |
| Endothelin (pg/ml) | 98 ± 28 | 125 ± 41* | 114 ± 35 | 110 ± 49 |
Echocardiographic indexes are presented in Table 3. Subjects with HFPEF demonstrated alterations in ventricular chamber size and function (namely diastolic and systolic internal dimensions, diastolic and systolic volumes, fractional shortening, and EF) that were, for the most part, midway between those of patients with HFNEF and those with systolic HF. As shown in Figure 1, decreases of EF across the predefined subgroups were linked with increases in end-diastolic volume (p <0.05 for comparison of all subgroups by analysis of variance). Wall thicknesses were greater in the HFNEF and HFPEF groups, but left ventricular mass and mass index were increased comparably in the systolic HF and HFPEF groups. End-diastolic volume/left ventricular mass ratio increased progressively in the HFNEF, HFPEF, and systolic HF groups, indicating an increasing degree of eccentric remodeling. Left atrial size was increased similarly in all HF cohorts. Interestingly, stroke volume index did not differ among cohorts, with the exception of the HFPEF group, where it was slightly increased compared with the normal group (Table 3 and Figure 1).
Table 3.
Echocardiography results
| Parameter | No HF/Normal EF (n = 93) |
HFNEF (n = 128) |
HFPEF (n = 38) |
SHF (n = 98) |
|---|---|---|---|---|
| 2-dimensionally guided M-mode | ||||
| Left ventricular internal dimension diastole (mm) | 45 ± 3 | 47 ± 6*† | 55 ± 7*†‡ | 62 ± 7*‡ |
| Left ventricular internal dimension systole (mm) | 29 ± 3 | 31 ± 5† | 42 ± 6*†ˆ | 51 ± 8‡ |
| Interventricular septal diastole (mm) | 10 ± 1 | 12 ± 2*† | 12 ± 2*† | 10 ± 2‡ |
| Posterior wall thickness diastole (mm) | 9 ± 1 | 11 ± 2*‡ | 11 ± 2*† | 10 ± 2‡ |
| Fractional shortening (%) | 35 ± 2 | 34 ± 4† | 24 ± 4*†‡ | 16 ± 5*‡ |
| Left atrial dimension (mm) | 33 ± 4 | 39 ± 5*† | 41 ± 6* | 42 ± 5*‡ |
| 2-dimensional volumes/mass | ||||
| End-diastolic volume (ml) | 81 ± 20 | 95 ± 32*† | 148 ± 38*†‡ | 178 ± 48*‡ |
| End-diastolic volume index (ml/m2) | 48 ± 10 | 53 ± 16† | 82 ± 20*†‡ | 101 ± 28*‡ |
| End-systolic volume (ml) | 29 ± 8 | 36 ± 15† | 81 ± 24*†‡ | 124 ± 40*‡ |
| End-systolic volume index (ml/m2) | 17 ± 4 | 20 ± 8† | 45 ± 13*†‡ | 70 ± 23*‡ |
| Stroke volume (ml) | 52 ± 13 | 60 ± 18* | 67 ± 16*† | 54 ± 14 |
| Stroke volume index (ml/m2) | 31 ± 7 | 32 ± 9 | 38 ± 8*†‡ | 31 ± 8 |
| EF | 65 ± 3 | 64 ± 5† | 46 ± 7*†‡ | 30 ± 6*‡ |
| Left ventricular mass (g) | 150 ± 33 | 215 ± 69*† | 264 ± 74*‡ | 271 ± 66*‡ |
| Left ventricular mass/BSA (g/m2) | 88 ± 18 | 118 ± 36*† | 145 ± 36*‡ | 150 ± 34*‡ |
| End-diastolic volume/mass ratio (ml/g) | 0.55 ± 0.13 | 0.45 ± 0.11*† | 0.57 ± 0.14†‡ | 0.67 ± 0.17*‡ |
p <0.05 versus normal.
p <0.05 versus SHF.
p <0.05 versus HFNEF.
BSA = body surface area. Other abbreviation as in Table 1.
Figure 1.
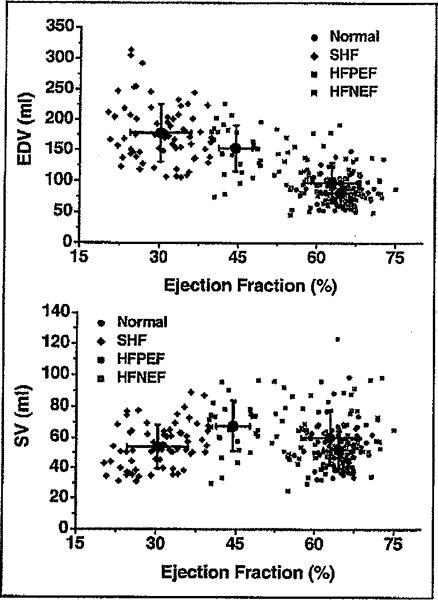
Relation between EF and end-diastolic volume (EDV) (top) and EF and stroke volume (SV) (bottom) stratified by cohorts (e.g., normal, HFNEF, HFPEF, and systolic HF [SHF]). See text for details.
Doppler measurements of diastolic function demonstrated progressive impairments as EF decreased, with the most severe abnormalities in those with the lowest EF. Tissue Doppler velocities showed progressive decreases in annular velocity in the HF cohorts and progressive increases in mitral flow propagation velocity (Table 4). Estimated values of left ventricular end-diastolic pressure and τ (time constant of relaxation) increased progressively from the normal to the HFNEF to the HFPEF to the systolic HF group.
Table 4.
Doppler parameters
| Parameter | No HF/Normal EF (n = 93) |
HFNEF (n = 128) |
HFPEF (n = 38) |
SHF (n = 98) |
|---|---|---|---|---|
| Mitral early (E) wave velocity (cm/s) | 73 ± 14 | 80 ± 24 | 75 ± 28† | 91 ± 27*‡ |
| Mitral late (A) wave velocity (cm/s) | 77 ± 14 | 88 ± 26*† | 82 ± 22† | 65 ± 30 |
| Deceleration time (ms) | 191 ± 34 | 220 ± 60*† | 217 ± 65† | 154 ± 73*‡ |
| E/A ratio | 1.0 ± 0.2 | 1.1 ± 0.8‡ | 1.0 ± 0.7† | 1.9 ± 1.3*‡ |
| Isovolumetric relaxation time (ms) | 96 ± 15 | 106 ± 35 | 118 ± 35* | 118 ± 38* |
| Tissue Doppler E′-wave velocity (cm/s) | 10 ± 2 | 8 ± 2*† | 7 ± 2*† | 6 ± 2*‡ |
| Tissue Doppler S′-wave velocity (cro/s) | 10 ± 1 | 9 ± 2*† | 8 ± 2*†‡ | 6 ± 1*‡ |
| Mitral flow propagation velocity | 1.3 ± 0.3 | 2.1 ± 0.8*† | 2.4 ± 0.8*† | 3.0 ± 0.8*‡ |
| Estimated left ventricular end-diastolic pressure (mm Hg) | 16 ± 1 | 18 ± 2*† | 19 ± 5*† | 21 ± 4*‡ |
| τ (ms) | 28 ± 13 | 45 ± 11*† | 48 ± 13*† | 56 ± 10*‡ |
Group-averaged noninvasively estimated end-systolic and end-diastolic pressure–volume relations are presented in Figure 2 and Table 5. Compared with the normal group, the end-systolic pressure–volume relations of HFNEF hearts did not differ but the end-diastolic pressure–volume relations were slightly shifted rightward. In the systolic HF group, the end-systolic and end-diastolic pressure–volume relations were markedly shifted toward larger volumes. End-systolic and end-diastolic pressure–volume relations of the HFPEF group were significantly rightward shifted, although not as dramatically as those of the systolic HF group. Differences in chamber properties are revealed by the comparison of values of volume at an end-systolic pressure of 120 mm Hg, whereas differences in chamber capacitances are revealed by the comparison of values of end-diastolic volume at a common end-diastolic pressure of 30 mm Hg (Table 5). Effective arterial elastance, the lumped index of ventricular afterload, did not vary significantly between cohorts. However, the ratio of arterial to chamber elastance was increased mildly in the HFNEF group, was increased moderately in the HFPEF group, and was increased markedly in the systolic HF group, indicating a progressively severe degree of ventricular–vascular mismatch.
Figure 2.
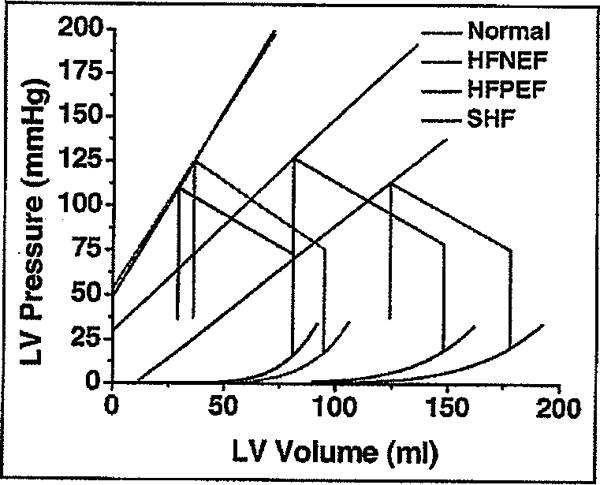
Noninvasively estimated average pressure–volume relations, including end-systolic and end-diastolic pressure–volume relations. See text for details. LV = left ventricular. Other abbreviation as in Figure 1.
Table 5.
Pressure–volume data
| Parameter | No HF/Normal EF (n = 93) |
HFNEF (n = 128) |
HFPEF (n = 38) |
SHF (n = 98) |
|---|---|---|---|---|
| Ea (mm Hg/ml) | 2.2 ± 0.5 | 2.3 ± 0.8 | 2.0 ± 0.7 | 2.3 ± 0.7 |
| Ees, (mm Hg/ml) | 2.1 ± 0.5 | 2.0 ± 0.8† | 1.2 ± 0.5*‡ | 1.0 ± 0.4*‡ |
| Ea/Ees ratio | 1.1 ± 0.2 | 1.3 ± 0.4‡ | 1.9 ± 0.7*†‡ | 2.6 ± 0.9*‡ |
| Systolic volume at 0 pressure (ml) | −40 ± 8 | −50 ± 17† | −37 ± 30† | 29 ± 132*‡ |
| Systolic volume at pressure of 120 mm Hg (ml) | 21 ± 12 | 30 ± 30† | 80 ± 61†‡ | 185 ± 205*‡ |
| End-diastolic volume at pressure of 30 mm Hg (ml) | 90 ± 22 | 104 ± 38† | 162 ± 41*‡ | 186 ± 56*‡ |
p <0.05 versus normal.
p <0.05 versus SHF.
p <0.05 versus HFNEF.
Ea = arterial elastance; Ees, = end-systolic elastance. Other abbreviation as in Table 1.
Discussion
Similar to previous investigations14 we have demonstrated that subjects with HF and a normal EF (>55%) differ in their clinical and demographic characteristics from subjects with mildly (40% to 55%) and severely (<40%) decreased EF. Specifically, the former group more often consists of older women with long-standing hypertension, whereas the presence of coronary artery disease, and specifically myocardial infarction, is less common than in subjects with HF and a decreased EF. In addition to these clinical and demographic differences, we were able to demonstrate, using comprehensive noninvasive characterization of ventricular and vascular properties by pressure–volume analysis, that these cohorts also differ on a pathophysiologic basis. In particular, subjects with a mildly decreased EF (i.e., the HFPEF cohort) demonstrated significant abnormalities of ventricular size and function that, on the pressure–volume plane, were more similar to those of patients with overt systolic dysfunction than to those with HFNEF. Despite mild decreases in their EF, the ventricles of these subjects were markedly enlarged and demonstrated eccentric remodeling, along with shifts in the end-systolic pressure–volume relation that demonstrated significantly decreased chamber contractility.
Based on comprehensive analysis of Doppler measurements of diastolic filling, abnormalities were identified in almost all subjects with HF in this study, irrespective of EF. Moreover, left atrial enlargement and increases in natruretic peptides consistent with increased filling pressures were found in all cohorts with HF. Collectively, these data confirm previous findings15,16 that such measurements are not useful for distinguishing subgroups of patients with HF. Rather, using noninvasive imaging and single-beat techniques to estimate parameters derived from pressure–volume analysis, subgroups of patients with HF based on EF were determined to have characteristic pathophysiologic phenotypes. Most importantly, patients with mildly decreased EF (40% to 55%), despite only mildly dilated left ventricular dimensions by 2-dimensional echocardiography, had significant ventricular remodeling (e.g., rightward shift in end-diastolic pressure–volume relation) and decreases in chamber contractility. This is markedly different from the physiologic parameters displayed in the cohort with HFNEF (with an EF >55%) and more similar to the phenotype observed in patients with overt systolic HF (with an EF <40%).
It is increasingly recognized that the cohort with HFNEF constitutes a heterogenous cohort with potentially multiple underlying pathophysiologic mechanisms contributing to the observed phenotype. In our subjects with HFNEF, we observed a higher prevalence of hypertension and atrial fibrillation than in other cohorts with HF, suggesting an important pathophysiologic role. Although left ventricular hypertrophy is often cited as an important pathophysiologic feature, wall thickness was only minimally increased in subjects with HFNEF compared with controls. Rather, abnormal ventricular remodeling (e.g., volume/mass ratio) was a differentiating feature, being decreased in subjects with HFNEF compared with normals and increased compared with normals in subjects with HFPEF and systolic HF. Doppler measurements of diastolic function were more abnormal in the HFNEF cohort than controls despite the presence of an end-diastolic pressure–volume relation that was rightward and downward shifted compared with controls, suggesting a predominate role for a generalized volume overload state or a shift of volume to the central circulation. Indeed, several causes of volume overload including renal dysfunction and anemia were more commonly observed in the HFNEF cohort.
The primary importance of identifying different subgroups of patients with HF is because the mechanism(s) of disease, prognosis, and optimal treatment can differ between groups. Until this is disproved, it is important to continue the search for the best method of subdividing patients for the purpose of clinical trials. EF has been the primary method for defining cohorts of subjects with HF. Because EF is a continuous variable, as emphasized in Figure 1, any cutoff used to categorize patients with HF into different subgroups is clearly arbitrary. For example, it would not be expected that the characteristics of patients with HF with an EF of 57% would differ significantly from those with an EF of 53%, although in the present study these patients are lumped into different groups. However, the results of the present study demonstrate that patients with HF with an EF of 45% are clearly and markedly different than those with an EF of 65% and inferences regarding primary pathophysiologic mechanisms operative in these 2 cohorts can be made.
The lack of discrete EF subgroups across the spectrum of HF, a consistent finding among many studies, has resulted in questions about the utility of EF to segregate patients with HF and lead to other concepts about pathophysiology.17 Some have suggested that rather than employing EF as a means of subdividing patients with HF, HF should be considered 1 pathophysiologic entity encompassing a continuous spectrum of closely related phenotypes.18 In this view, underlying myocardial dysfunction is present in the early stages of HF syndrome when diastolic abnormalities predominate. Compensatory neurohormonal activation and left ventricular hypertrophy serve to maintain a normal EF. However, over time, the phenotype can progress or be modified by treatment.17,18 Supporting data comes from several studies19–23 and our own data (Table 4) showing depressed systolic mitral annular amplitudes in subjects with HF compared with normal controls, suggestive of myocardial dysfunction, which progresses as the EF declines. The findings of a previous study in severely hypertensive rats are also consistent with this view.24 Another view, which we promote, is that patients should be sub-grouped according to the primary mechanism of myocardial insult (e.g., infarction, hypertension, infiltration, etc), regardless of EF, as has been done for systolic HF.25
On a practical level, several ongoing clinical trials of various pharmacologic therapies in patients with HF and a normal or preserved EF have been completed26–28 or are in progress.29,30 Although these trials have recruited subjects with HF and an average EF of >50%, a large portion of subjects in these trials have an EF that is not normal. In the Candesartan in Heart failure: Assessment of Reduction in Mortality and morbidity (CHARM) and Dig-Preserve studies, 35% and 25%, respectively, had an EF <50%. The demographic features of patients with an EF <50% in these trials were predominantly men with a high prevalence of previous myocardial infarction. These characteristics are similar to what we observed in our HFPEF population and, importantly, differ significantly from the cohort with HFNEF who are more typically women with long-standing hypertension.14 Of note, subgroup analyses of the results of those completed trials stratified by EF have not been published. Based on the discussions presented earlier, it is pertinent to question whether pooling data from all patients with EFs >40% is appropriate, because the clinical and pathophysiologic phenotypes of patients in the different EF ranges can be significantly different. Determination of whether the outcomes are driven by an effect in 1 population compared with another could be vital and may influence the conclusions of a clinical trial and, ultimately, practice guidelines for different patients.
The primary limitation of this study is the use of noninvasive methods to derive measurements of left ventricular performance and the fact that measurements were obtained only at rest. The use of invasive left ventricular monitoring is the gold standard for derivation of pressure–volume loops and end-systolic and end-diastolic pressure–volume relations. Because such methods are invasive, they are impractical for studying large numbers of patients. Several limitations of noninvasive estimates have been noted including an inability to quantify the effect of impaired relaxation (e.g., prolonged τ) on the end-diastolic pressure–volume relation and the confounding effect of wave amplification on estimates of end-systolic pressure. A second notable feature of this study is that it was performed in a racially homogenous Chinese population. Because it is clear that ethnicity (and gender) can be an important factor in disease mechanism, our study is free from such confounding factors. Additionally, the cohorts had a low prevalence of concomitant obesity, which is not typical of the population in the United States, where obesity and HF, especially with a normal EF, are tightly linked. However, these aspects of our study may limit the applicability of the results to other populations. Although we attempted to quantify the duration over which HF symptoms were present to study whether there was evidence of a time progression of disease, we found this to be a difficult and unverifiable (and therefore unreliable) process; we abandoned efforts related to this endeavor. Longitudinal analysis is best suited to evaluate this issue.
Acknowledgments
This work is supported by Grants 2007AA02Z4B7 and 2006DFB32210 from the Ministry of Science and Technology of China, Beijing, China and by Grant 7052063 from the Beijing Natural Science Foundation, Beijing, China. Dr. Maurer was supported by Grant R01AG027518-01A1 from the National Institutes of Health/National Institute on Aging, Bethesda, Maryland.
References
- 1.Lloyd-Jones DM, Larson MG, Leip EP, Beiser A, D’Agostino RB, Kannel WB, Murabito JM, Vasan RS, Benjamin EJ, Levy D. Lifetime risk for developing congestive heart failure: the Framingham Heart Study. Circulation. 2002;106:3068–3072. doi: 10.1161/01.cir.0000039105.49749.6f. [DOI] [PubMed] [Google Scholar]
- 2.Paulus WJ, Tschope C, Sanderson JE, Rusconi C, Flachskampf FA, Rademakers FE, Marino P, Smiseth OA, De KG, Leite-Moreira AF, et al. How to diagnose diastolic heart failure: a consensus statement on the diagnosis of heart failure with normal left ventricular ejection fraction by the Heart Failure and Echocardiography Associations of the European Society of Cardiology. Eur Heart J. 2007;28:2539–2550. doi: 10.1093/eurheartj/ehm037. [DOI] [PubMed] [Google Scholar]
- 3.Maron BJ. Hypertrophic cardiomyopathy: a systematic review. JAMA. 2002;287:1308–1320. doi: 10.1001/jama.287.10.1308. [DOI] [PubMed] [Google Scholar]
- 4.Maron BJ, Spirito P, Roman MJ, Paranicas M, Okin PM, Best LG, Lee ET, Devereux RB. Prevalence of hypertrophic cardiomyopathy in a population-based sample of American Indians aged 51 to 77 years (the Strong Heart Study) Am J Cardiol. 2004;93:1510–1514. doi: 10.1016/j.amjcard.2004.03.007. [DOI] [PubMed] [Google Scholar]
- 5.Schiller NB, Shah PM, Crawford M, DeMaria A, Devereux R, Feigenbaum H, Gutgesell H, Reichek N, Sahn D, Schnittger I. Recommendations for quantitation of the left ventricle by two-dimensional echocardiography. American Society of Echocardiography Committee on Standards, Subcommittee on Quantitation of Two-Dimensional Echocardiograms. J Am Soc Echocardiogr. 1989;2:358–367. doi: 10.1016/s0894-7317(89)80014-8. [DOI] [PubMed] [Google Scholar]
- 6.Devereux RB, Reichek N. Echocardiographic determination of left ventricular mass in man. Anatomic validation of the method. Circulation. 1977;55:613–618. doi: 10.1161/01.cir.55.4.613. [DOI] [PubMed] [Google Scholar]
- 7.Ommen SR, Nishimura RA, Appleton CP, Miller FA, Oh JK, Redfield MM, Tajik AJ. Clinical utility of Doppler echocardiography and tissue Doppler imaging in the estimation of left ventricular filling pressures: a comparative simultaneous Doppler-catheterization study. Circulation. 2000;102:1788–1794. doi: 10.1161/01.cir.102.15.1788. [DOI] [PubMed] [Google Scholar]
- 8.Lam CS, Roger VL, Rodeheffer RJ, Bursi F, Borlaug BA, Ommen SR, Kass DA, Redfield MM. Cardiac structure and ventricular-vascular function in persons with heart failure and preserved ejection fraction from Olmsted County, Minnesota. Circulation. 2007;115:1982–1990. doi: 10.1161/CIRCULATIONAHA.106.659763. [DOI] [PMC free article] [PubMed] [Google Scholar]
- 9.Chen CH, Fetics B, Nevo E, Rochitte CE, Chiou KR, Ding PA, Kawaguchi M, Kass DA. Noninvasive single-beat determination of left ventricular end-systolic elastance in humans. J Am Coll Cardiol. 2001;38:2028–2034. doi: 10.1016/s0735-1097(01)01651-5. [DOI] [PubMed] [Google Scholar]
- 10.Klotz S, Hay I, Dickstein ML, Yi GH, Wang J, Maurer MS, Kass DA, Burkhoff D. Single-beat estimation of end-diastolic pressure–volume relationship: a novel method with potential for noninvasive application. Am J Physiol Heart Circ Physiol. 2006;291:H403–H412. doi: 10.1152/ajpheart.01240.2005. [DOI] [PubMed] [Google Scholar]
- 11.Burkhoff D, Mirsky I, Suga H. Assessment of systolic and diastolic ventricular properties via pressure–volume analysis: a guide for clinical, translational, and basic researchers. Am J Physiol Heart Circ Physiol. 2005;289:H501–H512. doi: 10.1152/ajpheart.00138.2005. [DOI] [PubMed] [Google Scholar]
- 12.Sunagawa K, Maughan WL, Burkhoff D, Sagawa K. Left ventricular interaction with arterial load studied in isolated canine ventricle. Am J Physiol Heart Circ Physiol. 1983;245:H773–H780. doi: 10.1152/ajpheart.1983.245.5.H773. [DOI] [PubMed] [Google Scholar]
- 13.Kelly RP, Ting CT, Yang TM, Lin CP, Maughan WL, Chang MS, Kass DA. Effective arterial elastance as index of arterial vascular load in humans. Circulation. 1992;86:513–521. doi: 10.1161/01.cir.86.2.513. [DOI] [PubMed] [Google Scholar]
- 14.Sweitzer NK, Lopatin M, Yancy CW, Mills RM, Stevenson LW. Comparison of clinical features and outcomes of patients hospitalized with heart failure and normal ejection fraction (>l=55%) versus those with mildly reduced (40% to 55%) and moderately to severely reduced (<40%) fractions. Am J Cardiol. 2008;101:1151–1156. doi: 10.1016/j.amjcard.2007.12.014. [DOI] [PMC free article] [PubMed] [Google Scholar]
- 15.Maisel AS, McCord J, Nowak RM, Hollander JE, Wu AH, Duc P, Omland T, Storrow AB, Krishnaswamy P, Abraham WT, et al. Bedside B-Type natriuretic peptide in the emergency diagnosis of heart failure with reduced or preserved ejection fraction. Results from tbe Breathing Not Properly Multinational Study. J Am Coll Cardiol. 2003;41:2010–2017. doi: 10.1016/s0735-1097(03)00405-4. [DOI] [PubMed] [Google Scholar]
- 16.Vinch CS, Aurigemma GP, Hill JC, Gaasch WH, Volturo G, Tighe DA, Meyer TE. Usefulness of clinical variables, echocardiography, and levels of brain natriuretic peptide and norepinephrine to distinguish systolic and diastolic causes of acute heart failure. Am J Cardiol. 2003;91:1140–1143. doi: 10.1016/s0002-9149(03)00170-x. [DOI] [PubMed] [Google Scholar]
- 17.De Keulenaer GW, Brutsaert DL. Systolic and diastolic heart failure: different phenotypes of the same disease? Eur J Heart Fail. 2007;9:136–143. doi: 10.1016/j.ejheart.2006.05.014. [DOI] [PubMed] [Google Scholar]
- 18.De Keulenaer GW, Brutsaert DL. Diastolic heart failure: a separate disease or selection bias? Prog Cardiovasc Dis. 2007;49:275–283. doi: 10.1016/j.pcad.2006.08.002. [DOI] [PubMed] [Google Scholar]
- 19.Yu CM, Lin H, Yang H, Kong SL, Zhang Q, Lee SW. Progression of systolic abnormalities in patients with “isolated” diastolic heart failure and diastolic dysfunction. Circulation. 2002;105:1195–1201. doi: 10.1161/hc1002.105185. [DOI] [PubMed] [Google Scholar]
- 20.Sanderson JE. Diastolic heart failure or heart failure with a normal ejection fraction. Minerva Cardioangiol. 2006;54:715–724. [PubMed] [Google Scholar]
- 21.Sanderson JE. Heart failure with a normal ejection fraction. Heart. 2007;93:155–158. doi: 10.1136/hrt.2005.074187. [DOI] [PMC free article] [PubMed] [Google Scholar]
- 22.Sanderson JE. Systolic and diastolic ventricular dyssynchrony in systolic and diastolic heart failure. J Am Coll Cardiol. 2007;49:106–108. doi: 10.1016/j.jacc.2006.10.024. [DOI] [PubMed] [Google Scholar]
- 23.Yu CM, Sanderson JE, Marwick TH, Oh JK. Tissue Doppler imaging a new prognosticator for cardiovascular diseases. J Am Coll Cardiol. 2007;49:1903–1914. doi: 10.1016/j.jacc.2007.01.078. [DOI] [PubMed] [Google Scholar]
- 24.Klotz S, Hay I, Zhang G, Maurer M, Wang J, Burkhoff D. Development of heart failure in chronic hypertensive Dahl rats: focus on heart failure with preserved ejection fraction. Hypertension. 2006;47:901–911. doi: 10.1161/01.HYP.0000215579.81408.8e. [DOI] [PubMed] [Google Scholar]
- 25.Felker GM, Thompson RE, Hare JM, Hruban RH, Clemetson DE, Howard DL, Baughman KL, Kasper EK. Underlying causes and long-term survival in patients with initially unexplained cardiomyopathy. N Engl J Med. 2000;342:1077–1084. doi: 10.1056/NEJM200004133421502. [DOI] [PubMed] [Google Scholar]
- 26.Yusuf S, Pfeffer MA, Swedberg K, Granger CB, Held P, McMurray JJ, Michelson EL, Olofsson B, Ostergren J. Effects of candesartan in patients with chronic heart failure and preserved left-ventricular ejection fraction: the CHARM-Preserved Trial. Lancet. 2003;362:777–781. doi: 10.1016/S0140-6736(03)14285-7. [DOI] [PubMed] [Google Scholar]
- 27.Ahmed A, Rich MW, Fleg JL, Zile MR, Young JB, Kitzman DW, Love TE, Aronow WS, Adams KF, Jr, Gheorghiade M. Effects of digoxin on morbidity and mortality in diastolic heart failure: the ancillary digitalis investigation group trial. Circulation. 2006;114:397–403. doi: 10.1161/CIRCULATIONAHA.106.628347. [DOI] [PMC free article] [PubMed] [Google Scholar]
- 28.Cleland JG, Tendera M, Adamus J, Freemantle N, Polonski L, Taylor J. The perindopril in elderly people with chronic heart failure (PEP-CHF) study. Eur Heart J. 2006;27:2338–2345. doi: 10.1093/eurheartj/ehl250. [DOI] [PubMed] [Google Scholar]
- 29.McMurray JJ, Carson PE, Komajda M, McKelvie R, Zile MR, Ptaszynska A, Staiger C, Donovan JM, Massie BM. Heart failure with preserved ejection fraction: clinical characteristics of 4133 patients enrolled in the I-PRESERVE trial. Ear J Heart Fail. 2008;10:149–156. doi: 10.1016/j.ejheart.2007.12.010. [DOI] [PubMed] [Google Scholar]
- 30.Aldosterone antagonist therapy for adults with heart failure and preserved systolic function (TOPCAT) 2008 Available at: http://clinicaltrials.gov/ct2/show/NCT00094302?term=topcat&rank=;1. Last accessed Jan 24, 2009.