

Abstract
Single cell analysis is required to understand cellular heterogeneity in biological systems. We propose that single cells (blastomeres) isolated from early stage invertebrate, amphibian, or fish embryos are ideal model systems for the development of technologies for single cell analysis. For these embryos, although cell cleavage is not exactly symmetric, the content per blastomere decreases roughly by half with each cell division, creating a geometric progression in cellular content. This progression forms a ladder of single-cell targets for the development of successively higher sensitivity instruments. In this manuscript, we performed bottom-up proteomics on single blastomeres isolated by microdissection from 2-, 4-, 8-, 16-, 32- and 50-cell Xenopus laevis (African clawed frog) embryos. Over 1,400 protein groups were identified in single-run reversed-phase liquid chromatography-electrospray ionization-tandem mass spectrometry from single balstomeres isolated from a 16-cell embryo. When the mass of yolk-free proteins in single blastomeres decreased from ~0.8 μg (16-cell embryo) to ~0.2 μg (50-cell embryo), the number of protein group identifications declined from 1,466 to 644. Around 800 protein groups were quantified across four blastomeres isolated from a 16-cell embryo. By comparing the protein expression among different blastomeres, we observed that the blastomere-to-blastomere heterogeneity in 8-, 16-, 32- and 50-cell embryos increases with development stage, presumably due to cellular differentiation. These results suggest that comprehensive quantitative proteomics on single blastomeres isolated from these early stage embryos can provide valuable insights into cellular differentiation and organ development.
Graphical abstract
Single cell analysis is required to study cellular heterogeneity in biological systems, and is especially useful for neuroscience, developmental biology, and stem cell biology.1–3 Recent advances in our understanding of tumor heterogeneity further highlight the importance of single cell analysis for identifying the “cancer code” to provide improved cancer therapy.4 The development of high-sensitivity analytical methods for single cell analysis will benefit other sample-limited analyses, including the characterization of fine-needle aspirants and circulating tumor cells.
Mass spectrometry (MS) provides rich information in the analysis of biomolecules, e.g. proteins, peptides, and metabolites, in individual cells. MS based single cell peptidomics and metabolomics have progressed significantly during the past decade.3,5–12 However, single cell proteomics remains extremely challenging due to the limited protein content in most cells. For example, a single human somatic cell contains only ~100 pg protein,1 far below the sensitivity of most MS techniques.
Progress has been made to improve the sensitivity of proteomics, including improvements in sample preparation, the reduction of sample loss during peptide separations, and MS detection.13–24 Chen et al. reported over 800 protein identifications (IDs) from 100 cells by online integration of cell injection, lysis, protein digestion, and nano-reversed-phase liquid chromatography (RPLC)-electrospray ionization (ESI)-MS/MS analysis; the estimated detection limit of the system was 200 zmole of protein loaded onto the instrument.19 Murgia and colleagues performed shot-gun proteomics on single muscle fibers and identified thousands of proteins with an in-StageTip sample preparation method,25 and accurate mass- and retention time-based peptide and protein identifications.20 The estimated mass of protein in the single muscle fiber is at the 200 ng level.26 Recently, our group developed a monolithic microreactor for online proteome concentration, reduction, alkylation and digestion, followed by capillary zone electrophoresis (CZE)-MS/MS analysis, and identified nearly 1,000 proteins from 50 ng of Xenopus laevis zygote homogenate.24 Low zmole peptide detection limits have also been reported recently with CZE-MS and porous layer open tube (PLOT) based nano-RPLC-MS.21–22
Significant improvements have been achieved in proteomics in terms of sample preparation, peptide separation, and MS detection, but high nanogram amounts of protein materials are required to achieve thousands of protein IDs with bottom-up approaches, so that deep proteomic sequencing of a single human somatic cell is far beyond the state-of-the-art. Several publications have reported detection of hemoglobin from single red blood cells.27,28 Giesen et al. reported a mass cytometry method employing rare earth metals as reporters on antibodies and approached simultaneous imaging of 32 proteins at subcellular resolution.29
In 2014, our group quantified 3,000 proteins from a single Xenopus laevis fertilized egg using iTRAQ chemistry, which was the largest single cell proteomics dataset at that time.30 We observed remarkable cell-to-cell homogeneity in protein expression levels for embryos at the same stage of development, which makes Xenopus embryos valuable resources in the development of single-cell proteomic technology. Smits and colleagues later reported over 5,800 protein IDs from single Xenopus laevis fertilized eggs.31 The large number of protein IDs from this system is due to the large amount of protein materials in each egg (~130 μg total protein, ~13 μg of yolk-free protein). Very recently, Lombard-Banek et al. performed single cell proteomics on single blastomeres isolated from 16-cell Xenopus laevis embryos, and reported 500–800 protein group identifications from single blastomere in single CZE-MS runs with consumption of only 20 ng of the protein digest.32 On average, the mass of yolk-free proteins in single blastomeres isolated from the 16-cell embryo is close to 1 μg.
We believe that single blastomeres isolated from early stage Xenopus laevis embryos are a superior model system for single cell analysis. This system offers several important advantages:
First, the blastomeres can be isolated from Xenopus laevis early stage embryos via microdissection. The protein content of those embryos is remarkably homogeneous, providing outstanding embryo-to-embryo reproducibility for evaluation of technical precision of single cell measurements.30
Second, the protein mass in an intact embryo is about 130 μg and remains essentially constant through early development.33 As a result, the amount of protein per blastomere decreases monotonically through early stage development. As a complication, ~90% (w/w) of the total protein content is yolk proteins, with only ~13 μg of yolk-free proteins, in single early-stage embryos. When the embryos grow from 2-cell stage (stage 2) to 4,000-cell stage (stage 8), on average the mass of yolk-free proteins in single blastomeres declines geometrically from ~6.5 μg to ~3 ng, generating a three order of magnitude ladder in protein content.
Third, at the 16-cell stage, the blastomere-to-blastomere heterogeneity is significant because those blastomeres have differentiated and form the basis for the development of different organs.34 Comprehensive quantitative proteomics on single blastomeres isolated from early stage embryos will provide valuable insights into cellular differentiation during early embryo development.
Finally, Xenopus laevis is a vertebrate, and results obtained from this organism may provide insight into the development of other vertebrates.
Experimental
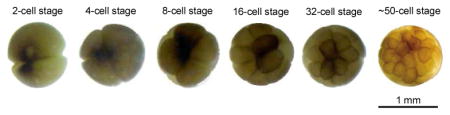
In this proof-of-principle work, bottom-up single cell proteomics was performed on single blastomeres isolated from 2-, 4-, 8-, 16-, 32- and 50-cell Xenopus laevis embryos (development stages 2, 3, 4, 5, and early and late stage 6), Fig. 1. Briefly, several blastomeres (2–5) were isolated from embryos at each stage via microdissection. Each blastomere was lysed and single blastomere proteome was extracted with an optimized buffer system,33 followed by proteome cleanup and digestion with a filter aided sample preparation (FASP) method.35 The resulting digest was directly analyzed by nano-RPLC-ESI-MS/MS (90-min RPLC gradient, Q-Exactive HF mass spectrometer) without sample cleanup or prefractionation, followed by peptide and protein identification with MaxQuant software based on MS/MS spectra and also accurate mass and retention time (AMT).36–37 The protein content in single blastomerers isolated from 50-cell embryo is very low (0.2 μg yolk-free proteins/blastomere), so we employed the “Match between runs” function in MaxQuant software to improve the protein IDs from those blastomeres. The “Match between runs” function uses aligned RPLC retention time and precise masses to transfer peptide IDs from the 2-cell stage blastomeres, where a given peptide is more likely to have high quality MS/MS spectra, to the 50-cell stage blastomeres, where lower abundance peptides are not fragmented due to low intensity, and only their accurate mass has been determined. Label-free quantification was also performed with the MaxLFQ method integrated in MaxQuant software in order to evaluate the blastomere-to-blastomere heterogeneity.38 The experimental details are illustrated in Supporting Material I.
Figure 1.

A) Micrographs of the Xenopus laevis embryos used in this experiment. B) The workflow of single cell proteomics on single blastomeres isolated from the embryos.
Results and discussion
On average, over 1,100 protein groups were identified from single blastomeres isolated from 2-, 4-, 8- and 16-cell embryos based on MS/MS spectra with false discovery rates (FDRs) less than 1% on both peptide and protein levels, Fig. 2A and S-Table 1 in Supporting material I. Roughly 770 and 160 protein groups were identified from single blastomeres isolated from 32-and 50-cell embryos based on MS/MS spectra, respectively. The dramatic drop in the number of protein group IDs is due to the roughly four times lower protein materials in single blastomeres from 50-cell embryos compared with that that from 16-cell embryos (~0.2 μg vs. ~0.8 μg).
Figure 2.

(A) Protein group identifications (IDs) from single blastomeres isolated from 2-, 4-, 8-, 16-, 32-, and 50-cell embryos based on only MS/MS spectra and both MS/MS spectra and AMT. AMT: accurate mass and time. (B) Cumulative relative standard deviation (RSD) of protein LFQ intensity distributions of all the proteins quantified from different blastomeres isolated from 8-, 16-, 32-, and 50-cell embryos.
When both MS/MS spectra and AMT were used for identifications, the number of protein group IDs improved significantly compared with MS/MS spectra alone, Fig. 2A and S-Table 1 in Supporting material I. Over 1,400 protein groups were identified via single run RPLC-MS/MS analysis of submicrogram amounts of protein materials from single balstomeres isolated from a 16-cell embryo based on MS/MS spectra and AMT. Very recently, CZE-MS/MS was also employed for proteomic analysis of single balstomeres isolated from a 16-cell Xenopus embryo, and 500–800 protein groups were identified by single run CZE-MS/MS analysis of 20 ng of protein materials from single blastomeres.32 In our work, roughly 640 protein groups were identified from single balstomeres isolated from a 50-cell embryo based on MS/MS spectra and AMT, which is four times higher than that identified based on MS/MS spectra alone. It is worth noting that we also performed a blank run before sample runs, and the blank run produced only nine protein IDs based on MS/MS spectra and AMT. To our knowledge, this is the first proteomic work on single blastomeres isolated from embryos beyond the 16-cell stage. The protein groups identified in this work are listed in Supporting material II.
When the mass of yolk-free proteins in single blastomeres decreases from ~0.8 μg (16-cell embryo) to ~0.2 μg (50-cell embryo), the number of protein group identifications declines from 1,466 to 644 (Fig. 2A), suggesting that proteomics on single blastomeres isolated from later-stage embryos challenges the sensitivity of current proteomics. To obtain deep proteomic analysis of single blastomeres isolated from embryos beyond the 50-cell stage, sample loss during preparation and separation must be reduced and the sensitivity of MS detection must be improved. Capillary zone electrophoresis (CZE)-MS has been demonstrated to produce better sensitivity than RPLC-MS for analysis of mass-limited proteome digests,39–40 and the on-line integration of proteome sample preparation and CZE-MS/MS has also been reported for pg-ng amounts of complex proteome analysis.23–24 Accordingly, coupling online proteome sample preparation with CZE-MS/MS is a promising method to improve the depth of single cell proteomic analysis.
Very recently, Lombard-Banek et al. performed the first quantitative proteomics on single blastomeres isolated from 16-cell Xenopus laevis embryo.32 Using CZE-MS/MS and tandem mass tags method, Lombard-Banek et al. quantified 150 protein groups between blastomeres, and demonstrated significant cellular heterogeneity in terms of protein abundance at the 16-cell stage.32 In our work, one embryo was used for each stage when single blastomeres were isolated via microdissection from 8-, 16-, 32- and 50-cell embryos. We used label free quantification (LFQ) to evaluate the blastomere-to-blastomere protein heterogeneity within an embryo. We quantified 808 protein groups across the three blastomeres isolated from the 8-cell embryo, and 799, 596, and 161 protein groups for blastomeres from the 16-, 32- and 50-cell embryos, respectively. The relative standard deviation (RSD) of protein LFQ intensity from single blastomeres isolated from the same embryo gradually increases as the embryo develops, Fig. 2B, which presumably is due to cellular differentiation. The quantified proteins from the blastomeres isolated from embryos at 8-, 16-, 32-, and 50-cell stages are also listed in Supporting material II. By further analyzing the quantified proteins with very high RSD of protein LFQ intensity, we observed that yolk proteins, VTGB1 and VTGA2, tend to have high abundance heterogeneity across the analyzed blastomeres from 8-cell, 16-cell, and 32-cell embryos, which is expected because vegetal blastomeres have much higher level of yolk proteins than animal blastomeres. Fourteen proteins quantified across blastomeres isolated from 50-cell embryo have higher than 70% RSD of protein LFQ intensity, suggesting the significant abundance heterogeneity across those blastomeres, S-Figure 1 in Supporting material I. Gene Ontology enrichment results (P value better than 0.05) on those 14 proteins demonstrate that the biological process of those proteins are highly enriched in regulation of protein and RNA localization to the Cajal body (>100-fold enrichment), regulation of telomerase activity (>100-fold enrichment), and protein folding and stabilization (>40-fold enrichment); their molecular function are enriched in unfolded protein binding (90-fold enrichment) and nucleotide binding (7-fold enrichment); and their cellular component are highly enriched in endoplasmic reticulum chaperone complex (>100-fold enrichment), chaperonin-containing T-complex (>100-fold enrichment), zona pellucida receptor complex (>100-fold enrichment), melanosome (86-fold enrichment) and myelin sheath (42-fold enrichment).
In summary, we performed single cell proteomics on blastomeres isolated from 2-, 4-, 8-, 16-, 32- and 50-cell Xenopus laevis embryos via microdissection. The mass of yolk-free proteins from single blastomeres isolated from these successive developmental stages gradually decreases from 6.5 μg (2-cell stage) to 0.2 μg (50-cell stage), and the number of protein group IDs from those single blastomeres declines from nearly 1,600 (2-cell stage) to ~640 (50-cell stage). Label free quantification data demonstrates an expected blastomere-to-blastomere heterogeneity in 8-, 16-, 32- and 50-cell embryos in terms of protein expression,32 suggesting that further comprehensive quantitative proteomics on single blastomeres isolated from those early stage embryos can provide valuable insights into cell differentiation.
Supplementary Material
Acknowledgments
We thank Drs. William Boggess and Matthew Champion in the Notre Dame Mass Spectrometry and Proteomics Facility for their help with this project. This project was supported by grants from the National Institutes of Health (R01GM096767 and R01HD084399). EHP acknowledges support from a National Science Foundation Graduate Research Fellowship under Grant No. DGE-1313583.
References
- 1.Cohen D, Dickerson JA, Whitmore CD, Turner EH, Palcic MM, Hindsgaul O, Dovichi NJ. Annu Rev Anal Chem. 2008;1:165–190. doi: 10.1146/annurev.anchem.1.031207.113104. [DOI] [PubMed] [Google Scholar]
- 2.Schubert C. Nature. 2011;480:133–137. doi: 10.1038/480133a. [DOI] [PubMed] [Google Scholar]
- 3.Rubakhin SS, Romanova EV, Nemes P, Sweedler JV. Nat Methods. 2011;8:S20–29. doi: 10.1038/nmeth.1549. [DOI] [PMC free article] [PubMed] [Google Scholar]
- 4.Bendall SC, Nolan GP. Nat Biotechnol. 2012;30:639–647. doi: 10.1038/nbt.2283. [DOI] [PubMed] [Google Scholar]
- 5.Rubakhin SS, Sweedler JV. Anal Chem. 2008;80:7128–7136. doi: 10.1021/ac8010389. [DOI] [PMC free article] [PubMed] [Google Scholar]
- 6.Aerts JT, Louis KR, Crandall SR, Govindaiah G, Cox CL, Sweedler JV. Anal Chem. 2014;86:3203–3208. doi: 10.1021/ac500168d. [DOI] [PMC free article] [PubMed] [Google Scholar]
- 7.Lorenzo Tejedor M, Mizuno H, Tsuyama N, Harada T, Masujima T. Anal Chem. 2012;84:5221–5228. doi: 10.1021/ac202447t. [DOI] [PubMed] [Google Scholar]
- 8.Chen F, Lin L, Zhang J, He Z, Uchiyama K, Lin JM. Anal Chem. 2016;88:4354–4360. doi: 10.1021/acs.analchem.5b04749. [DOI] [PubMed] [Google Scholar]
- 9.Nemes P, Knolhoff AM, Rubakhin SS, Sweedler JV. Anal Chem. 2011;83:6810–6817. doi: 10.1021/ac2015855. [DOI] [PMC free article] [PubMed] [Google Scholar]
- 10.Wei Z, Xiong X, Guo C, Si X, Zhao Y, He M, Yang C, Xu W, Tang F, Fang X, Zhang S, Zhang X. Anal Chem. 2015;87:11242–11248. doi: 10.1021/acs.analchem.5b02115. [DOI] [PubMed] [Google Scholar]
- 11.Ong TH, Kissick DJ, Jansson ET, Comi TJ, Romanova EV, Rubakhin SS, Sweedler JV. Anal Chem. 2015;87:7036–7042. doi: 10.1021/acs.analchem.5b01557. [DOI] [PMC free article] [PubMed] [Google Scholar]
- 12.Onjiko RM, Moody SA, Nemes P. Proc Natl Acad Sci U S A. 2015;112:6545–6550. doi: 10.1073/pnas.1423682112. [DOI] [PMC free article] [PubMed] [Google Scholar]
- 13.Waanders LF, Chwalek K, Monetti M, Kumar C, Lammert E, Mann M. Proc Natl Acad Sci U S A. 2009;106:18902–18907. doi: 10.1073/pnas.0908351106. [DOI] [PMC free article] [PubMed] [Google Scholar]
- 14.Wang N, Xu M, Wang P, Li L. Anal Chem. 2010;82:2262–2271. doi: 10.1021/ac9023022. [DOI] [PubMed] [Google Scholar]
- 15.Tian R, Wang S, Elisma F, Li L, Zhou H, Wang L, Figeys D. Mol Cell Proteomics. 2011;10:M110.000679. doi: 10.1074/mcp.M110.000679. [DOI] [PMC free article] [PubMed] [Google Scholar]
- 16.WiTniewski JR, Ostasiewicz P, Mann M. J Proteome Res. 2011;10:3040–3049. doi: 10.1021/pr200019m. [DOI] [PubMed] [Google Scholar]
- 17.Sun L, Zhu G, Li Y, Yang P, Dovichi NJ. Anal Chem. 2012;84:8715–8721. doi: 10.1021/ac3019608. [DOI] [PMC free article] [PubMed] [Google Scholar]
- 18.Chen W, Wang S, Adhikari S, Deng Z, Wang L, Chen L, Ke M, Yang P, Tian R. Anal Chem. 2016;88:4864–4871. doi: 10.1021/acs.analchem.6b00631. [DOI] [PubMed] [Google Scholar]
- 19.Chen Q, Yan G, Gao M, Zhang X. Anal Chem. 2015;87:6674–6680. doi: 10.1021/acs.analchem.5b00808. [DOI] [PubMed] [Google Scholar]
- 20.Murgia M, Nagaraj N, Deshmukh AS, Zeiler M, Cancellara P, Moretti I, Reggiani C, Schiaffino S, Mann M. EMBO Rep. 2015;16:387–395. doi: 10.15252/embr.201439757. [DOI] [PMC free article] [PubMed] [Google Scholar]
- 21.Sun L, Zhu G, Zhao Y, Yan X, Mou S, Dovichi NJ. Angew Chem Int Ed. 2013;52:13661–13664. doi: 10.1002/anie.201308139. [DOI] [PMC free article] [PubMed] [Google Scholar]
- 22.Li S, Plouffe BD, Belov AM, Ray S, Wang X, Murthy SK, Karger BL, Ivanov AR. Mol Cell Proteomics. 2015;14:1672–1683. doi: 10.1074/mcp.M114.045724. [DOI] [PMC free article] [PubMed] [Google Scholar]
- 23.Sun L, Zhu G, Dovichi NJ. Anal Chem. 2013;85:4187–4194. doi: 10.1021/ac400523x. [DOI] [PMC free article] [PubMed] [Google Scholar]
- 24.Zhang Z, Sun L, Zhu G, Cox OF, Huber PW, Dovichi NJ. Anal Chem. 2016;88:877–882. doi: 10.1021/acs.analchem.5b03496. [DOI] [PMC free article] [PubMed] [Google Scholar]
- 25.Kulak NA, Pichler G, Paron I, Nagaraj N, Mann M. Nat Methods. 2014;11:319–324. doi: 10.1038/nmeth.2834. [DOI] [PubMed] [Google Scholar]
- 26.Lowry CV, Kimmey JS, Felder S, Chi MM, Kaiser KK, Passonneau PN, Kirk KA, Lowry OH. J Biol Chem. 1978;253:8269–8277. [PubMed] [Google Scholar]
- 27.Whittal RM, Keller BO, Li L. Anal Chem. 1998;70:5344–5347. doi: 10.1021/ac980754k. [DOI] [PubMed] [Google Scholar]
- 28.Mellors JS, Jorabchi K, Smith LM, Ramsey JM. Anal Chem. 2010;82:967–973. doi: 10.1021/ac902218y. [DOI] [PMC free article] [PubMed] [Google Scholar]
- 29.Giesen C, Wang HA, Schapiro D, Zivanovic N, Jacobs A, Hattendorf B, Schüffler PJ, Grolimund D, Buhmann JM, Brandt S, Varga Z, Wild PJ, Günther D, Bodenmiller B. Nat Methods. 2014;11:417–422. doi: 10.1038/nmeth.2869. [DOI] [PubMed] [Google Scholar]
- 30.Sun L, Bertke MM, Champion MM, Zhu G, Huber PW, Dovichi NJ. Sci Rep. 2014;4:4365. doi: 10.1038/srep04365. [DOI] [PMC free article] [PubMed] [Google Scholar]
- 31.Smits AH, Lindeboom RG, Perino M, van Heeringen SJ, Veenstra GJ, Vermeulen M. Nucleic Acids Res. 2014;42:9880–9891. doi: 10.1093/nar/gku661. [DOI] [PMC free article] [PubMed] [Google Scholar]
- 32.Lombard-Banek C, Moody SA, Nemes P. Angew Chem Int Ed. 2016;55:2454–2458. doi: 10.1002/anie.201510411. [DOI] [PMC free article] [PubMed] [Google Scholar]
- 33.Peuchen EH, Sun L, Dovichi NJ. Anal Bioanal Chem. 2016 doi: 10.1007/s00216-016-9564-2. [DOI] [PMC free article] [PubMed] [Google Scholar]
- 34.Moody SA. Dev Biol. 1987;119:560–578. doi: 10.1016/0012-1606(87)90059-5. [DOI] [PubMed] [Google Scholar]
- 35.Wiśniewski JR, Zougman A, Nagaraj N, Mann M. Nat Methods. 2009;6:359–362. doi: 10.1038/nmeth.1322. [DOI] [PubMed] [Google Scholar]
- 36.Cox J, Mann M. Nat Biotechnol. 2008;26:1367–1372. doi: 10.1038/nbt.1511. [DOI] [PubMed] [Google Scholar]
- 37.Smith RD, Anderson GA, Lipton MS, Pasa-Tolic L, Shen Y, Conrads TP, Veenstra TD, Udseth HR. Proteomics. 2002;2:513–523. doi: 10.1002/1615-9861(200205)2:5<513::AID-PROT513>3.0.CO;2-W. [DOI] [PubMed] [Google Scholar]
- 38.Cox J, Hein MY, Luber CA, Paron I, Nagaraj N, Mann M. Mol Cell Proteomics. 2014;13:2513–2526. doi: 10.1074/mcp.M113.031591. [DOI] [PMC free article] [PubMed] [Google Scholar]
- 39.Wang Y, Fonslow BR, Wong CC, Nakorchevsky A, Yates JR., 3rd Anal Chem. 2012;84:8505–8513. doi: 10.1021/ac301091m. [DOI] [PMC free article] [PubMed] [Google Scholar]
- 40.Ludwig KR, Sun L, Zhu G, Dovichi NJ, Hummon AB. Anal Chem. 2015;87:9532–9537. doi: 10.1021/acs.analchem.5b02457. [DOI] [PMC free article] [PubMed] [Google Scholar]
Associated Data
This section collects any data citations, data availability statements, or supplementary materials included in this article.