Abstract
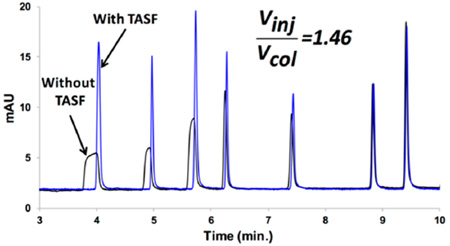
Capillary HPLC (cLC) with gradient elution is the separation method of choice for the fields of proteomics and metabolomics. This is due to the complementary nature of cLC flow rates and electrospray or nanospray ionization mass spectrometry (ESI-MS). The small column diameters result in good mass sensitivity. Good concentration sensitivity is also possible by injection of relatively large volumes of solution and relying on solvent-based solute focusing. However, if the injection volume is too large or solutes are poorly retained during injection, volume overload occurs which leads to altered peak shapes, decreased sensitivity, and lower peak capacity. Solutes that elute early even with the use of a solvent gradient are especially vulnerable to this problem. In this paper, we describe a simple, automated instrumental method, temperature-assisted on-column solute focusing (TASF), that is capable of focusing large volume injections of small molecules and peptides under gradient conditions. By injecting a large sample volume while cooling a short segment of the column inlet at subambient temperatures, solutes are concentrated into narrow bands at the head of the column. Rapidly raising the temperature of this segment of the column leads to separations with less peak broadening in comparison to solvent focusing alone. For large volume injections of both mixtures of small molecules and a bovine serum albumin tryptic digest, TASF improved the peak shape and resolution in chromatograms. TASF showed the most dramatic improvements with shallow gradients, which is particularly useful for biological applications. Results demonstrate the ability of TASF with gradient elution to improve the sensitivity, resolution, and peak capacity of volume overloaded samples beyond gradient compression alone. Additionally, we have developed and validated a double extrapolation method for predicting retention factors at extremes of temperature and mobile phase composition. Using this method, the effects of TASF can be predicted, allowing determination of the usefulness of this technique for a particular application.
Graphical Abstract
With the advent of electrospray ionization mass spectrometry (ESI-MS), capillary HPLC (cLC) has become a widely used separation method. Due to reduced volumetric flow rates and increased ionization efficiency, cLC couples particularly well with ESI-MS.1–4 This has led to cLC’s dominance in the fields of proteomics,5–10 metabolomics,3,7,11–16 and in vivo determination of neuropeptides.17–21 Combined with gradient elution, peak capacities exceeding 80022,23 have been achieved. In their work with ultrahigh-pressure cLC, Shen et al. were able to identify over 2000 peptides and 5000 metabolites using tandem MS for detection.23 High sensitivity with small volume samples is particularly important as interest in developing cLC for clinical use is growing,12,24–28 with some recent methods achieving full or partial FDA validation.4 Of course, the increased concentration sensitivity of cLC systems2,4,14,29–35 can be advantageously applied to any analysis based on small volume samples.
A disadvantage accompanying the use of small diameter columns is the potential for volume overload, the situation in which the injection volume is large enough to alter a solute’s peak shape.2,36–39 While a solvent gradient/reversed phase cLC system may not be highly susceptible to volume overload for the more hydrophobic solutes, the more polar solutes still can suffer from broadening due to volume overload.36,38 Of course, which solutes in a sample fall into the “more polar” class and suffer volume overload and which do not because they fall into the “more hydrophobic” class depends on the injection volume and the particular chromatographic conditions.36,38,40,41 Volume overload decreases the overall peak capacity and sensitivity of the method.36,38,39,42 Manipulating the gradient to avoid having solutes in the early eluting, “more polar”, class flies in the face of gradient optimization37,43–45 which attempts to use all of the peak capacity available in the specified separation time. What is needed is a general approach for focusing large-volume injections (>100% of the column volume) that allows an analytical method to take advantage of the full peak capacity of the gradient system and sensitivity of a capillary scale column.
Due to low thermal mass and thin silica walls, rapid heating and cooling of cLC columns is possible without increasing bandspreading from radial thermal gradients.46,47 Additionally, elevated temperature is effective in improving the efficiency of capillary columns.48 However, elevated temperatures also add to the challenge of managing large volume injections because increasing temperature typically decreases retention making volume overload more of a problem.
Since retention in LC is temperature dependent, transient temperature changes can be used to alter retention factors in chromatographically useful ways.49–53 Solute trapping using subambient temperatures has been explored. Holm et al. developed a capillary column oven in which the column was placed on a “cold zone” held at 0 °C during injection and then manually moved in space to a “hot zone” for the separation phase. Using this approach, the authors were able to minimize peak widths of large-volume injections of the antioxidant Irganox 1076 (clog P 13.9)54 in a neat acetonitrile mobile phase.55 Eghbali et al. used dry ice and boiling water to cool/heat circulating nitrogen gas, allowing focusing of the protein lysozyme at −20 °C near the end of the column.56 While each work demonstrated the effectiveness of temperature focusing, the former involved very hydrophobic solutes and the authors of the latter work doubted the usefulness of their approach for small molecules.56 Additionally, neither approach was automated which limits throughput and threatens irreproducibility.
We have previously shown that temperature-assisted on-column solute focusing (TASF) is effective in improving volume-overloaded isocratic separations of hydroxybenzoate esters beyond that achieved with solvent focusing alone.57,58 With TASF, the head of the column is cooled to subambient temperatures during injection. This results in focusing of solutes into narrow bands at the head of the column. Subsequently raising the temperature increases solute velocity to achieve a separation in a reasonable time. However, previous TASF studies were done using small molecules, under isocratic conditions, and with a simple approach to controlling temperature. In this paper, we demonstrate that our fully automated TASF apparatus used with reversed-phase LC (RPLC) is a practical method for focusing large volume injections of both small molecules (values of log P (or clog P) range from 1.16 to 4.75)59,60 and peptides and can also focus solute bands beyond gradient compression alone. In order to be able to simulate or predict the outcome of a TASF-enhanced separation, values of both very high and very low retention factors, k′, are needed. We developed and validated a double extrapolation procedure based on an equation by Neue and Kuss61 and the van’t Hoff relationship for obtaining such k′ values.
EXPERIMENTAL SECTION
Reagents and Solutions
Uracil, acetanilide, methyl and ethyl esters of p-hydroxybenzoic acid (parabens), acetophenone, propiophenone, butyrophenone, benzophenone, valerophenone, hexanophenone, heptanophenone, and octanophenone were from Sigma-Aldrich (St. Louis, MO). Stock solutions, 25 mM, were made in acetonitrile (Chromsolv, LC-MS grad, Fisher Scientific, Fair Lawn NJ). Samples were diluted to concentrations from 5 to 20 µM with deionized water. Sample concentrations were selected to maximize concentration while factoring in column loadability and solubility. Water was from a Millipore Milli-Q Synthesis A10 purification system (Billerica, MA). Peptide samples were from an LC-MS grade BSA tryptic digest from Fisher. The lyophilized sample was diluted, as per reagent instructions, to 1 pmol/µL in 95:5 0.1% formic acid/acetonitrile. Formic acid was from Sigma. The BSA sample was stored at −5 °C when not in use and used within 48 h of thawing/dilution.
Instrumentation
A Thermo/Dionex UltiMate 3000 Nano LC (NCS-3500RS, Germering, Germany) system consisting of a nanoflow pump, a low-pressure loading pump, integrated column oven, and WPS-3000RS autosampler was used for this work. Autosampler temperature was set to 35 °C for small molecule work (to increase sample solubility) and 5 °C for BSA samples. Detection was achieved by a Waters Acquity TUV detector (Millford, MA) fitted with a 10 nL flow cell. Signal from the detector was interfaced with an external Thermo analog-to-digital converter. Acquisition rate was 100 Hz. The system was controlled by Chromeleon software (version 6.8).
TASF Hardware
Hardware for this system is similar to that used previously.58 Briefly, timed injections were made using an external 6-port Cheminert injection valve (C72x-669D, VICI Valco, Houston, TX) fitted with a 75 µm × 75 cm nanoViper capillary (Thermo) loop. Samples were loaded into the sample loop using the loading pump and autosampler of the NSC-3500 system. Focusing segment temperature was controlled by a 1.0 × 1.0 cm Peltier thermoelectric device (TEC, Custom Thermoelectric, 04801-rG30-34RB, Bishopville, MD). To improve heat transfer between the TEC and heat sink compared to our previous system, the TEC was silver soldered to a custom liquid cooled copper heat sink. Heat sink temperature was regulated using a HAAKE A80 temperature controlled cooler (Thermo, Paramus, NJ) pumping an ethylene glycol/water mixture at about 1 L/min. The TEC was powered by a MAXIM Integrated 1968 electronic TEC driver (Sunnyvale, CA). Temperature was monitored by a 36-gage type-T thermocouple from Omega Engineering (Stamford, CT) interfaced with a National Instruments 9211 4-channel thermocouple module (Austin, TX). TEC temperature was logged at 7 Hz and controlled using a simple feedback loop written in LabVIEW 2015 (NI). TEC control, remote start, and valve injection signals were made by a USB-6008 multifunction DAQ (NI). The downstream, isothermal segment of the column was heated resistively using a Kapton resistive heater (KH-106-10-P, Omega) and a Love Model 1500 proportional-integral-derivative (PID) controller (Dwyer Instruments, Michigan City, IN) as described previously.62
TASF Control
Temperature transients must be fast to ensure efficient release of focused bands as well as precisely controlled to ensure reproducibility and minimize temperature over- and undershoot. To achieve this, a commercially available electronic TEC driver was used to run a high power, low thermal mass TEC with control software written in-house. A simple feedback loop-based routine was developed in LabVIEW to control the driver. At the beginning of the day, the software “learns” the relationship between temperature and control voltage. This is achieved by setting an arbitrary temperature in the software for which the driver establishes a voltage to maintain that temperature at the TEC (±0.05 °C). Temperature measurements and voltage adjustments are made at 7 Hz. The program stores the maximum and minimum voltages required to reach the separation and focusing temperatures, respectively. In operation, a LabVIEW program initiates a temperature change at a programmed time. When the target temperature is raised, it applies a control voltage corresponding to a temperature that is a few degrees below the target. Then, a feedback loop takes over. On the basis of ΔT, the difference between the measured and target temperatures, the program increases the control voltage, in steps that can be defined by the user, to approach the target temperature. The steps become smaller as ΔT becomes smaller. When ΔT changes sign, so do the control voltage steps. For cooling, the process is analogous. By adjusting the voltage step size for a particular range of values of ΔT, the approach to the final voltage can be made more aggressive with a slight overshoot or gentler with no overshoot. While not a proportional-integral-derivative (PID) control algorithm, this program mimics a PID result and works equally well in the heating and cooling modes without the need for separate PID parameters in each operational mode.
Chromatographic Conditions
Five µL of each sample was delivered from the autosampler to the valve by the loading pump, which served to fill the 1 µL sample loop. A 1 min delay between autosampler injection and valve injection was employed to ensure the injection plug was centered in the sample loop.
Column Preparation
Columns were packed in-house following a previously developed method.57,58 Briefly, 100 µm fused silica capillaries from Polymicro Technologies (Phoenix, AZ) were packed with Acquity CSH C18 1.7 µm particles (Waters). Column length, 14.2 cm, was controlled by defining the volume of slurry in the column packing bomb. Following packing with stationary phase, the remainder of the capillary blank was packed with 8 µm solid silica spheres (Thermo). Column length was trimmed to a final length of 16.7 cm. We refer to these dual-phase columns as “packed-void” columns. The column fluid volume, not including the packed-void segment, was estimated at 683 nL. A 5.0 cm × 100 µm, single-phase column was used for solute retention studies.
van’t Hoff Retention Studies
Temperature was controlled by the column oven of the Ultimate 3000 system. Extra-column time was determined to be 0.35 min by making 50 nL timed injections into the 25 µm ID detection capillary. Isocratic runs were performed for each solute under at least 4 different mobile phase compositions and 5 temperatures between 30 and 65 °C. See Table S-1 for exact conditions used for each solute. The minimum temperature of 30 °C was dictated by the column oven’s lack of cooling capabilities. The order of temperatures was randomized and at least 1 h of equilibration time was given between temperature changes to ensure temperature stability. Detection conditions were identical to those described above.
TASF Conditions
For TASF experiments, the focusing temperature was −7.5 °C and the separation temperature was 65 °C. The temperature range was dictated by the maximum achievable by the TEC under experimental conditions. The lower temperature was the minimum practical based on our pump’s maximum pressure and issues related to condensation at the TEC surface. The focusing temperature was held during the time of injection plus an additional 5 s. The column was equilibrated at the initial conditions for 5 min prior to the start of each run. The TEC was held at the focusing temperature for 1 min prior to injection. Thus, the gradient time was coordinated to begin at the start of injection. After focusing, the temperature was raised quickly to the separation temperature and remained there for the remainder of the run. All runs were performed a minimum of three times.
Chromatography
Timed injections of solutions of small organic molecules (20 µM acetanilide, 15 µM acetophenone, 5 µM hexano- to octanophenone, and 7 µM benzophenone) from the 1 µL loop served to introduce samples. The volume injection is deduced from the injection time and the flow rate, 1.00 µL/min. The initial gradient used consisted of 5–75% ACN over 12 min (5.8% ACN/min). UV absorbance was measured at 254 nm. Additional runs performed to create variety of gradient steepness were: 14.2% ACN/min and 2.7% ACN/min. To determine the usefulness of TASF with different injection volumes, the small molecule mixture described previously was injected at volumes of 50, 150, 250, 500, and 1000 nL. To maintain detectable signals, solute concentrations were increased accordingly. For this study, the gradient conditions were 5–75% ACN over 12 min.
For peptide experiments, 2 µL of the BSA sample was injected using an overfilled-loop. Gradient conditions were 5–40% ACN over 15 min with a flow rate of 1.00 µL/min. The separation temperature was 65 °C, and the focusing temperature was −7.5 °C. The focusing temperature was held for 125 s. UV absorbance was measured at 214 nm. All chromatograms were analyzed using a simple peak finding, integration, and characterization program written in-house in MATLAB R2015a (MathWorks, Matick, MA).
RESULTS AND DISCUSSION
Theory
A brief review of the dominant contributions peak broadening when considering volume overload will explain conceptually how TASF works. Observed peak variance in time units, σt,obs, is dominated by independent broadening processes occurring before, during, and after separation on the column.63
| (1) |
Since postcolumn dispersion, σt,post, can be considered small with appropriate detection under both TASF and isothermal conditions, it is not considered further.
| (2) |
In volume overload, the variance due to the injection volume dominates the precolumn contribution. Thus, the injection variance is dependent on both injection volume, Vinj, and column characteristics, including radius, rc, as seen in eq 3.
| (3) |
εTot represents the total porosity of the column. The retention factor during injection, k1, and keff, the effective retention factor at elution as defined by Snyder and Dolan,64 are temperature-dependent terms; uav is the average linear velocity, which converts length units to time units. According to eq 3, injection variance is largely dependent on the k1 term and, because this term is in the denominator, small values of k1 result in larger values of σinj. TASF acts by lowering the temperature at the head of the column, thus increasing k1 and decreasing broadening due to injection.42 This effect is most obvious for compounds that have relatively small retention factors at the column temperature.
Peak width in gradient elution is determined by way of eq 4, which is based on linear solvent strength theory (LSST).64
| (4) |
where t0 is the dead time of the column and G(p) is the gradient compression factor. This factor, which is dependent on gradient steepness, represents the compression of the solute band on the column. It arises because the velocity of the solute front is lower than that of the rear.64 TASF takes advantage of the temperature dependence of retention factors to minimize injection variance whereas gradients partially reverse the effects of column band spreading, reducing the column variance. Thus, the actions of TASF and gradients are independent of one another and can be used in conjunction to minimize observed peak broadening.50
Determination of Retention Factors at Extremes of Temperature and ϕ
In order to predict the effect of TASF, k1 must be known accurately. As described above, TASF will employ temperatures of −7.5 and 65 °C. Determining k1 for the more hydrophobic solutes at the former temperature and the more hydrophilic solutes at the latter temperature is challenging. While others have predicted retention factors at subambient temperatures by extrapolation of linear van’t Hoff plots,56 to our knowledge, no prior studies have examined models for extrapolation of retention as a function of temperature and mobile phase composition. Thus, we sought a reliable method to extrapolate k1 data obtained under more reasonable conditions to our extreme conditions.
Extrapolation requires a mathematical model for retention. Three models were considered, namely, LSST64 (eq 5) and two equations from Neue and Kuss (eqs 6 and 7).61
| (5) |
| (6) |
| (7) |
Eqs 5 and 6 are used at a given temperature, T (K), while eq 7 includes a temperature dependence. For each equation, k0 or k0(T) is the retention factor in pure water and S and S(T) describe the relationship between solute retention and ϕ. S(T) and k0(T) are constants in eqs 5 and 6 for a given temperature, T, but vary with temperature. S and k0 in eq 7 are constants.61 In eqs 6 and 7, a and a(T) account for curvature in the relationship between ln k and ϕ, and D reflects temperature effects.
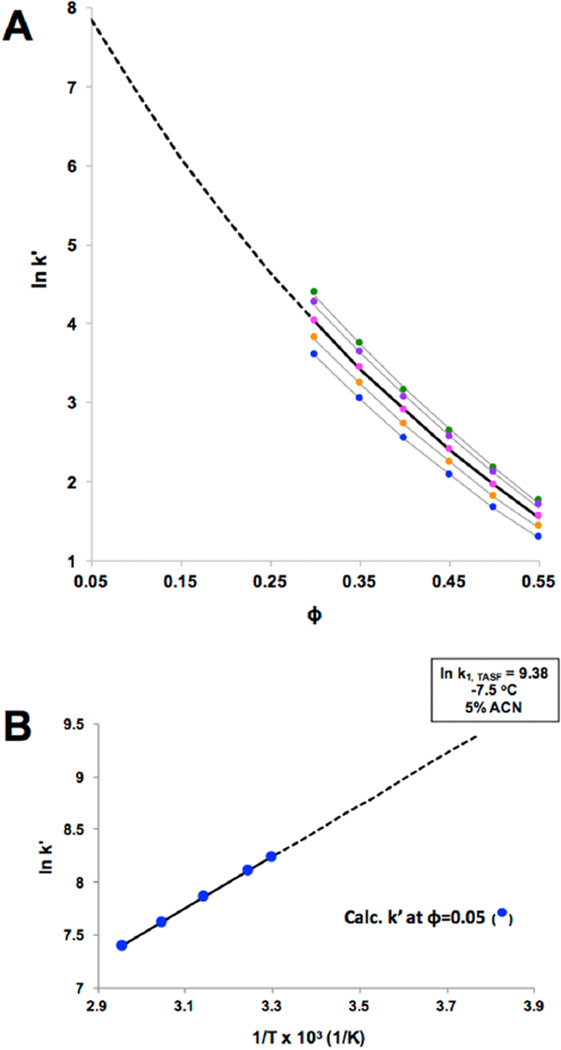
As eqs 5 and 6 have temperature-dependent constants, a two-step extrapolation was carried out. Figure 1 shows the basic idea. We first determined k′ values for each solute at a minimum of five temperatures and four solvent compositions that led to a wide range of measurable values (~1 < k′ < 35). These data form the basis for extrapolation (Table S-1). As shown in Figure 1A, values of k′ for a single temperature and a range of values of ϕ were used in a curve fitting procedure to determine the temperature-dependent constants in eqs 5 and 6. These values were used to extrapolate to the lowest solvent strength, ϕ = 0.05. Figure 1A shows the fits of eq 6 for hexanophenone and the extrapolation for one temperature, the dashed line. This procedure was repeated for each temperature. The result is a set of (extrapolated) values for k′ as a function of temperature at ϕ = 0.05. The second step is to plot these extrapolated values vs 1/T to determine the retention enthalpy at the lowest solvent strength, ϕ = 0.05, and further to extrapolate this van’t Hoff plot to the focusing temperature, −7.5 °C (Figure 1B). For eq 5, ln k0 and S were determined at each temperature using linear regression. For eq 6, the Solver function of Excel was used to determine the constants at each temperature by minimizing the sum of squared residuals between experimental and calculated values at each ϕ. Eq 7 was used differently. Solver was used to determine the constants for a single solute (e.g., all of the points in Figure 1A), and k′ was calculated by extrapolation to T = −7.5 °C. and ϕ = 0.05. The analogous procedures were used for some solutes to get k′ for T = 65 °C and ϕ = 0.05.
Figure 1.
Illustration of k1 determination process for hexanophenone. (A) Experimental data obtained using the conditions described in the Experimental Section. A single extrapolation based on eq 6 is shown. (B) Data found as shown in (A) vs 1/T and extrapolated to −7.5 °C.
The accuracy of each model was determined using two methods. First, for those solutes for which experimental data could be obtained at ϕ = 0.05, the processes described above were carried out without using the data at ϕ = 0.05. van’t Hoff plots based on experimental k′ values and the three sets of extrapolated values were compared (Figure S-6). The model with the closest slope to the experimental data was considered to be most accurate. This turns out to be eq 6.
The second method was to compare the methylene group selectivity, αCH2, from extrapolated k′ values to a known value. While literature on methylene selectivity at these particular conditions is not readily available, ln (αCH2) in pure water has been reported on four C18 phases at slightly different tem- peratures near room temperature.65 On the basis of these data, at an average temperature of 26.8 ± 2.0 °C, ln (αCH2) is 1.39 ± 0.01.65 Fortuitously, under our experimental conditions (ϕ = 0.05 and −7.5 °C), the solvent strength is similar to water at room temperature. This is because a decrease of 5 °C increases retention to about the same extent as a 1% increase in acetonitrile composition decreases retention.66 Thus, the solvent strength in a water mobile phase near room temperature would remain about the same if we decreased the temperature from 26.8 to −7.5 °C and made the mobile phase composition 6.9% ACN (ΔT/5). This is similar to our sample composition at the lower temperature (5.0% ACN). Thus, we determined slopes of a plot of calculated ln k versus the number of methylene groups at ϕ = 0.05 and −7.5 °C for the straight-chain phenones (Figure S-7). These slopes are αCH2. Its value was 1.33 when using eq 6 to calculate k′ values. Values from the other two equations were very different (Figure S-7). Both of our validation methods point to the accuracy of eq 6 so retention data extrapolated using eq 6 were used for subsequent calculations.
Small Molecule Studies
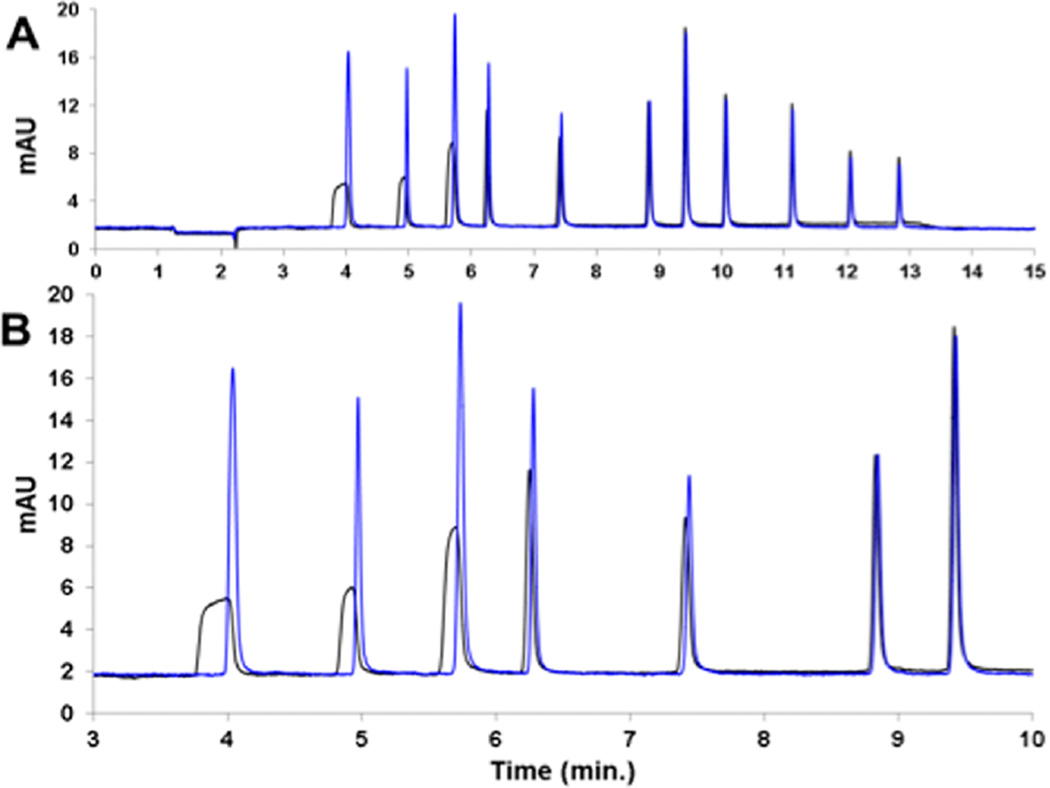
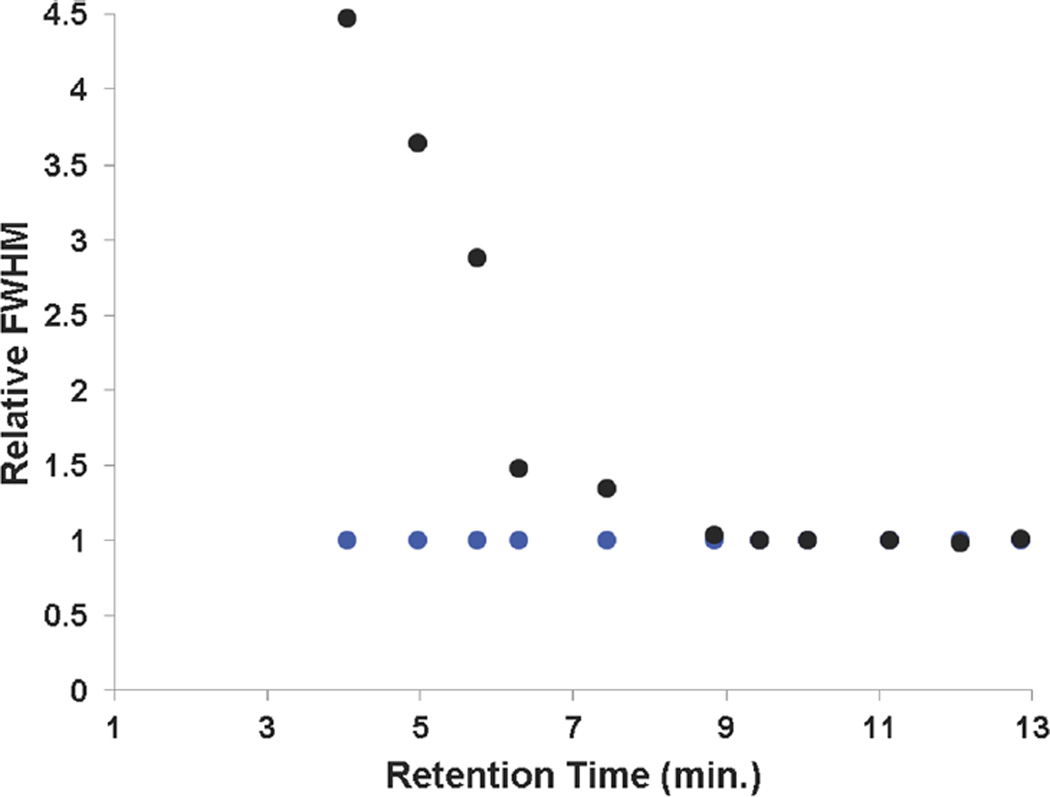
The utility of TASF for small molecules is illustrated in Figure 2, in which a chromatogram from a large-volume injection of a mixture of small molecules is dramatically improved compared to the isothermal separation (Figure 2A). This improvement is especially evident in Figure 2B, which shows the first seven peaks in greater detail. Volume overload is visually evident from the greater peak width of the first six peaks without TASF. This is consistent with what is expected on the basis of eq 3. The remainder of the separation is virtually identical to the isothermal results as is evident in Figure 2A. Figure 3 quantitatively illustrates the effectiveness of TASF for each peak in the chromatogram shown in Figure 1. For example, TASF decreases the full width at half-maximum, fwhm, of the acetanilide peak by a factor of 4.5 despite a low k′ (k1,isothermal = 5.46, k1,TASF = 21.3) at the start of the gradient. Thus, TASF reduces volume overload, but there is no degradation of peak shape for well-retained solutes. Decreased peak width for early eluting solutes provides more usable chromatographic space and thus higher peak capacities. By integrating the area under 1/w between the first and the last solute retention times44 (Figure S-8C), the peak capacity under TASF conditions was found to be 85 as compared to 70 for isothermal conditions. By improving peak width and resolution in the first 7.5 min of the separation, considerably more room is made for the detection of other polar compounds that may not be otherwise resolved.
Figure 2.
Chromatograms of 1000 nL injections of a small molecule mixture under isothermal (black line) and TASF (blue line) conditions with a gradient of 5−75% ACN over 12 min. Panel A illustrates all the solutes of the mixture whereas Panel B shows the early eluting peaks in more detail. The solutes in order of elution are acetanilide, methylparaben, acetophenone, ethylparaben, propiophenone, butyrophenone, benzophenone, valerophenone, hexanophenone, heptanophenone, and octanophenone. Panels are representative of n = 3 replicates.
Figure 3.
Relative fwhm (fwhm/fwhmTASF) for isothermal (black dots) and TASF (blue dots) separations based on the chromatograms depicted in Figure 2.
Injection Volume Studies
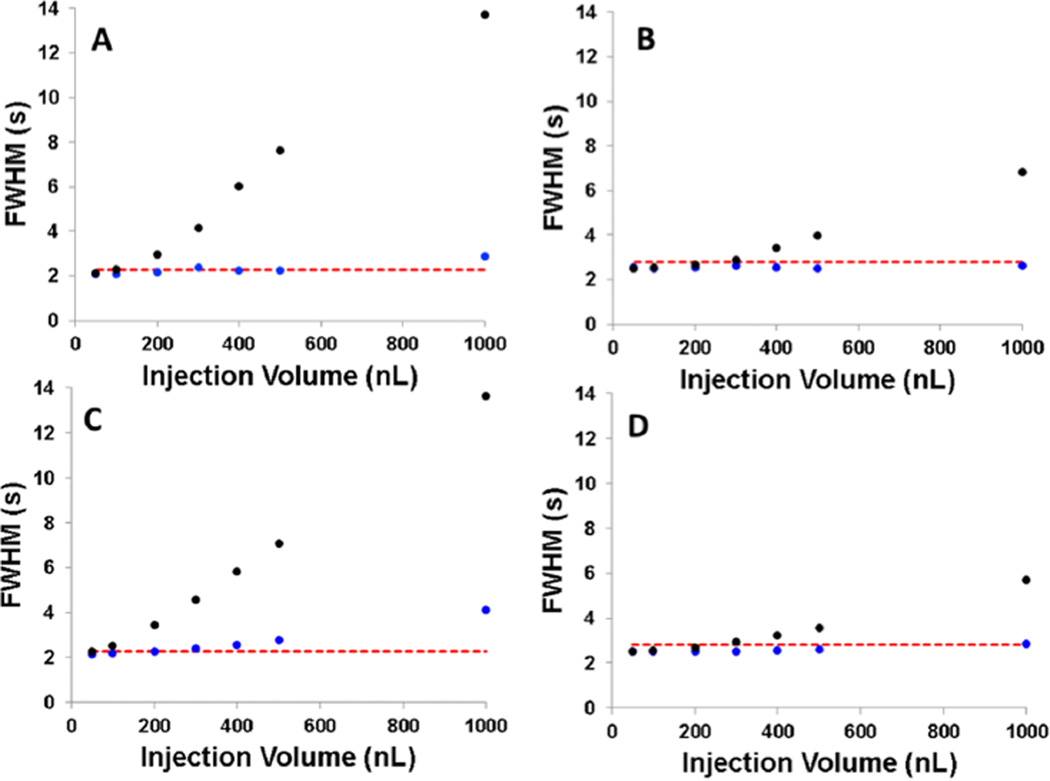
It is clear that TASF improves chromatography with large-volume injections, but to determine the point at which TASF is no longer essential in gradient elution for a given injection volume, k1, and keff, a range of injection volumes and resulting half-widths were compared. Experimental results for first and third peaks of the mixture can be found in Figure 4A,B, respectively. Both acetanilide and acetophenone showed considerable improvement in peak width for a range of large volume injections. For acetophenone, overloading effects were no longer apparent at injection volumes below 250 nL. At this point, the observed variance is dominated by column variance alone and minimal broadening due to injection is seen. However, with TASF, injection variance is almost completely eliminated, allowing observed widths of even 1000 nL injections to be at or less than peak widths of 50 nL injections (within 10%). A 10% loss of efficiency, as indicated by the red dashed line, is tolerable given the benefits of injecting large volumes. Using eqs 2 and 3, these results are modeled reasonably well (Figure 4C,D), illustrating the ability to predict the usefulness of TASF under particular conditions.
Figure 4.
Experimental and predicted peak widths under isothermal (black dots) and TASF (blue dots) conditions for injection volumes ranging from 50 to 1000 nL. Panels A and B are the experimental values for acetanilide and acetophenone, respectively, and Panels C and D are the calculated values for acetanilide and acetophenone, respectively, found using eqs 3 and 4 and based on experimental conditions. The red dashed line indicates 10% greater peak width than that measured at the 50 nL injection volume. Calculations are based on n = 3 replicates at each condition.
Gradient Slope Studies
Gradient compression, G(p), narrows solute zones due to increasing solvent strength, resulting in decreased peak widths.36,64 The gradient compression effect is dependent on the slope of the gradient, b, which can be calculated using the LSST parameter, S, the difference between the initial and final mobile phase composition, Δϕ, and the duration of the gradient, tg.64
| (8) |
| (9) |
| (10) |
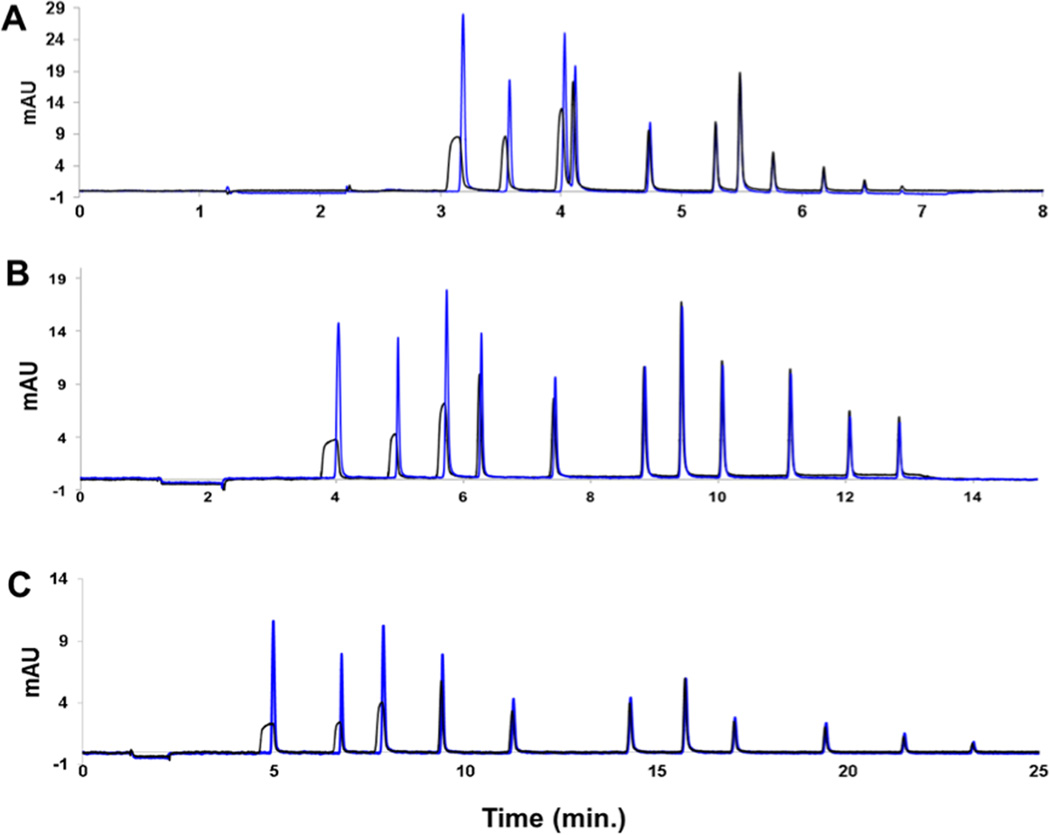
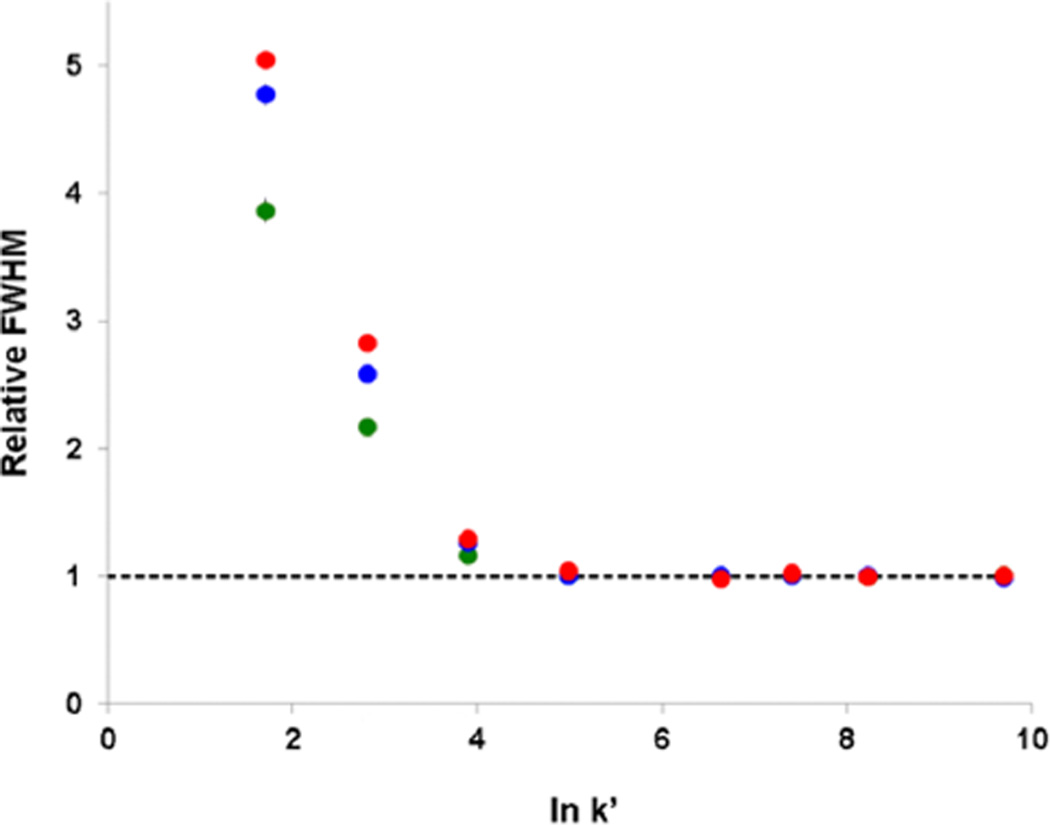
It is of interest to determine the effects of TASF with changing gradient slope. This was examined by varying the tg and final ϕ, resulting in gradient slopes of 0.2 (tg = 24 min, ϕf = 0.7), 0.5 (tg = 12 min, ϕf = 0.75), and 1.1 (tg = 6 min, ϕf = 0.9). It is clear in Figure 5 that TASF focuses more polar solutes beyond gradient compression in each scenario. Further- more, this effect is greatest for the shallowest gradient slope, as seen in Figure 6. On the basis of eq 8, steep gradient slopes and small k1 values result in the highest solvent-based gradient compression.64 Therefore, TASF has the greatest impact when used with a shallow gradient, which is pertinent to the separation of complex mixtures since these mixtures are commonly analyzed using long, shallow gradients.67 This is consistent with peptide studies using end-of-the-column focusing, wherein solute trapping time was the highest for long gradients.56 While the greatest advantage of TASF is realized with the shallowest gradient, there is still considerable decrease in peak width for polar solutes with the steepest gradient. This demonstrates the ability of TASF to focus beyond what can be achieved with gradient compression alone due to the complementary nature of these focusing techniques.
Figure 5.
Chromatograms of a 1000 nL injection of the small molecule mixture under isothermal (black line) and TASF (blue line) conditions with varying gradient steepness. (A) 5–90% ACN over 6 min (14.2% ACN/min). (B) 5–75% ACN over 12 min (5.8% ACN/min). (C) 5–70% over 24 min (2.7% ACN/min). Chromatograms are representative of n = 3 replicates.
Figure 6.
Comparison of relative peak widths (fwhmiso/fwhmTASF) at varying gradient steepness depicted in Figure 4. The green dots indicate the 14.2% ACN/min gradient, blue dots indicate the 5.8% ACN/min gradient, and red dots indicate the 2.7% ACN/min gradient. The black dashed line indicates fwhmTASF/fwhmTASF.
Predictability
Rearrangement of eqs 2 and 3 models the influence of TASF with gradient elution, which can be used to predict experimental results and determine the critical values that characterize the usefulness of this technique.
| (11) |
| (12) |
Replacing the denominator of the first bracketed term with its physical definition of the column volume, Vcol, and substitution of the second bracketed term with the inverse of the column broadening term in length units, σcol,l, leads to eq 12. The square of the ratio of the column length, L, and the latter quantity is the number of theoretical plates, N. This leads to eq 13 where we indicate that N is an “observed” quantity, in this case including gradient compression.
| (13) |
γ represents a tolerance term, indicating the acceptable increase in peak width one is willing to tolerate in making large-volume injections. Although the definition of N in terms of a peak width in units of time in gradient elution differs from that in isocratic elution,64 in units of length on column, they are the same. Eq 13 can be used easily to estimate the potential effectiveness of TASF for a particular separation. Using eq 13, was determined that the minimum k1 required to achieve an observed variance equal to 1.1 times the column variance (γ = 1.1) with a 1000 nL injection is 170. This is consistent with the experimental results seen in Figure 2. For reference, the predicted k1 under TASF conditions for acetanilide is 21.3, acetophenone is 59.8, and propiophenone is 410. Those solutes with k1 < 170 show dramatic improvement in peak width with TASF while the peaks with k1 > 170 had widths that are relatively close under TASF and isothermal conditions.
Eq 13 can be rearranged to show the largest injection volume that can be used under given conditions, eq 14.
| (14) |
Here, it can be clearly seen that the effect of gradient compression as expressed in Nobs is to increase the allowable volume injected. Using eqs 4 and 14, the combined effects of gradient elution and TASF can be reasonably estimated, allowing prediction of TASF utility for a particular solute prior to experimentation.
Peptide Mixture Studies
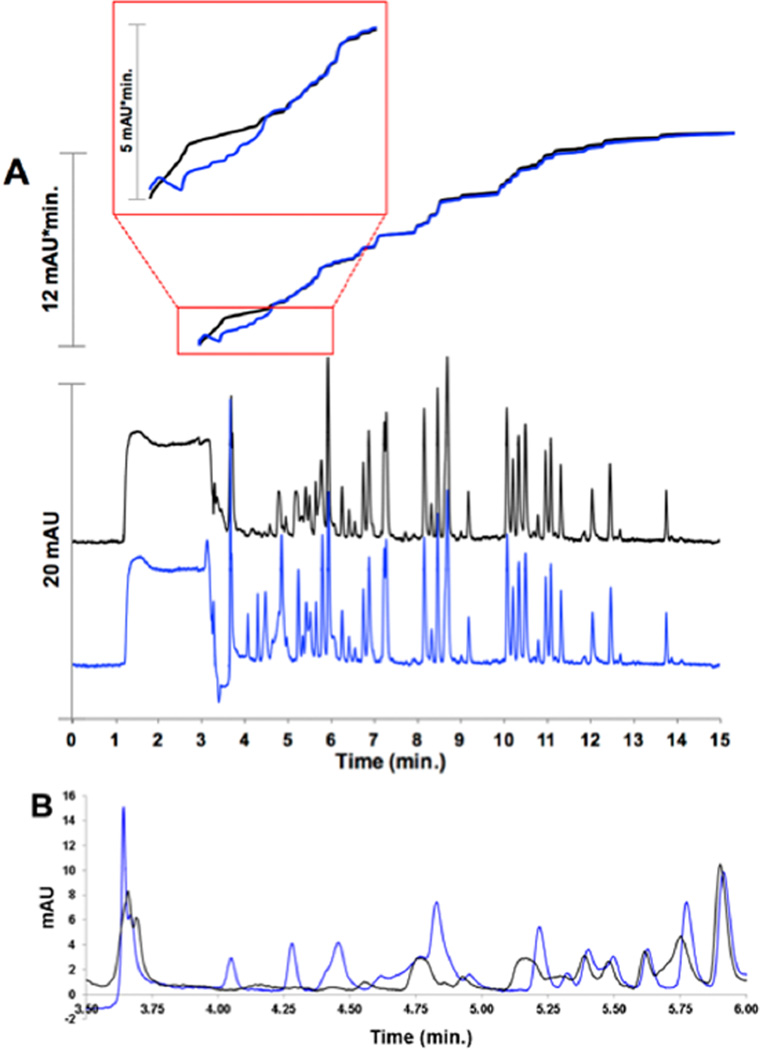
In general, the effect of changing ϕ on retention is more dramatic for larger molecular weight solutes such as peptides, resulting in greater gradient compression.36 We have shown that TASF is able to focus large injections of small molecules beyond gradient compression alone, so it seems reasonable that biological samples could also benefit from this effect. Indeed, Eghbali et al. focused targeted proteins near the column outlet by lowering the temperature of the end of the column during select portions of a gradient elution run.56 Figure 7A shows chromatograms of a BSA tryptic digest from injections of 2 µL, over 290% of the column volume. Focusing time was increased to 125 s to accommodate the additional injection time. With TASF, peak shapes for early eluting solutes are significantly improved as is resolution, particularly up to the 6 min mark. Most noticeable are the four additional peaks detected between 3.5 and 4.5 min. We can infer the effect of TASF by considering the total peak area over time, shown in Figure 7. From 6 min to the end of the chromatogram, the areas of the two chromatograms are virtually identical. This is consistent with TASF having little influence over solute behavior for those solutes that would have focused effectively without TASF. In the earliest part of the chromatogram following the injection transient, the areas of the two chromatograms have different trajectories. The isothermal trace increases rapidly near 3.5 min as poorly retained solutes elute. This shows that, while early eluting solutes are detected, they are not resolved. Conversely, with TASF, there is a slow, stepwise increase in area corresponding to the well-resolved peaks in the 4–6 min region. This highlights the ability of TASF to resolve early eluting solute peaks that were eluted unresolved without TASF.
Figure 7.
Separation of a 2 µL injection of BSA tryptic digest under isothermal (black line) and TASF (blue line) conditions. Panel A has four traces. The bottom two are the chromatograms, and the top two are integrations of the chromatograms. The inset shows an enlargement of the peak area trace from the start of integration (2.5 min) to 6 min. Panel B is an enlargement of the first 6 min of the chromatogram, illustrating the increased sensitivity and resolution of poorly retained solutes. A gradient of 5–40% ACN over 15 min was used for these experiments. Chromatograms are representative of n = 2 replicates.
The appearance of the additional unknown early eluting peaks and improvement in peak shape for multiple solutes highlights the benefit of placing the focusing segment at the column inlet. In this configuration, the approach is general, applicable to all solutes in the mixture with negative retention enthalpies not just beneficial for a few specific solutes in select regions of the chromatogram. This feature has obvious implications for the determination of multiple solutes in complex mixtures where elution times for target analytes may not accommodate multiple focusing, release and thermal re-equilibrations of the focusing segment.
In the example just described, the sample was prepared in 5% acetonitrile to facilitate dissolution of the peptides but this limits solvent focusing. Biological samples are often prepared in pure aqueous solvents, which improves solvent focusing but may exclude less soluble peptides from detection. TASF could therefore be useful when the sample must contain some organic solvent by providing additional focusing without sacrificing solubility.
CONCLUSIONS
These results clearly illustrate the effectiveness of TASF for increasing sensitivity for volume-overloaded solutes beyond what can be achieved with solvent gradient elution alone. This is applicable not only for complex mixtures of small molecules but also for biological samples. Additionally, this completely instrumental technique offers an automated method to improve sensitivity, peak capacity, and resolution over a range of injection volumes and gradient conditions. Furthermore, using our double extrapolation method for predicting retention factors at extremes of temperature and mobile phase composition, the effects of TASF on chromatograms can be modeled. This allows one to predict the utility of TASF for a particular application.
It should be noted that, in theory, TASF is capable of focusing even more polar compounds than those used here. Stationary and mobile phase conditions can be tailored to particular sample mixture. As long as the solutes of interest have negative enthalpies under those conditions, increased separation performance with TASF is a possibility. As this is often the case for stationary phases such as HILIC,68–71 mixed mode,72 and carbon phases,73–79 it is clear that the benefits of TASF can be widely applied to a range of applications beyond conventional reversed phase.
Supplementary Material
Acknowledgments
Funding for this work was provided by the National Institutes of Health through Grants R01 GM044842 and R01 MH104386, an Arts and Sciences Fellowship from the Kenneth P. Dietrich School of Arts and Sciences (R.E.W.), and a Graduate Research Fellowship from the National Science Foundation, DGE-1247842 (S.R.G.). We thank Anthony Horner (University of Pittsburgh) for development and assistance with Matlab programs and Dr. Ed Bouvier and Dr. Moon Chul Jung of Waters Corporation for the generous gift of Acquity packing material and TUV. We also thank Tom Gasmire, Josh Byler, and Jim McNerney from the Dietrich School of Arts and Sciences Machine and Electronics shops for their assistance in designing and constructing TASF instrumentation.
Footnotes
ASSOCIATED CONTENT
- A description of the methods used to determine flow rate accuracy and dwell time of the chromatographic system as well as accompanying plots; a description of the feedback loop used to operate the TASF hardware along with temperature and pressure profiles for a typical run; experimental conditions for the van’t Hoff experiments and plots illustrating how these experiments were used to extrapolate solute retention factors; additional figures of merit comparing TASF to isothermal separations for the small molecule sample. (PDF)
The authors declare no competing financial interest.
REFERENCES
- 1.Granger J, Plumb R, Castro-Perez J, Wilson ID. Chromatographia. 2005;61:375–380. [Google Scholar]
- 2.Desmet G, Eeltink S. Anal. Chem. 2013;85:543–556. doi: 10.1021/ac303317c. [DOI] [PubMed] [Google Scholar]
- 3.Gika HG, Theodoridis GA, Plumb RS, Wilson ID. J. Pharm. Biomed. Anal. 2014;87:12–25. doi: 10.1016/j.jpba.2013.06.032. [DOI] [PubMed] [Google Scholar]
- 4.Wilson SR, Vehus T, Berg HS, Lundanes E. Bioanalysis. 2015;7:1799–1815. doi: 10.4155/bio.15.92. [DOI] [PubMed] [Google Scholar]
- 5.Lee H, Griffin TJ, Gygi SP, Rist B, Aebersold R. Anal. Chem. 2002;74:4353–4360. doi: 10.1021/ac025757i. [DOI] [PubMed] [Google Scholar]
- 6.Lasonder E, Ishihama Y, Andersen JS, Vermunt AMW, Pain A, Sauerwein RW, Eling WMC, Hall N, Waters AP, Stunnenberg HG, Mann M. Nature. 2002;419:537–542. doi: 10.1038/nature01111. [DOI] [PubMed] [Google Scholar]
- 7.Ishihama Y. J. Chromatogr. A. 2005;1067:73–83. doi: 10.1016/j.chroma.2004.10.107. [DOI] [PubMed] [Google Scholar]
- 8.Rogeberg M, Vehus T, Grutle L, Greibrokk T, Wilson SR, Lundanes E. J. Sep. Sci. 2013;36:2838–2847. doi: 10.1002/jssc.201300499. [DOI] [PubMed] [Google Scholar]
- 9.Falkenby LG, Such-Sanmartin G, Larsen MR, Vorm O, Bache N, Jensen ON. J. Proteome Res. 2014;13:6169–6175. doi: 10.1021/pr5008575. [DOI] [PubMed] [Google Scholar]
- 10.Moruz L, Pichler P, Stranzl T, Mechtler K, Kall L. Anal. Chem. 2013;85:7777–7785. doi: 10.1021/ac401145q. [DOI] [PMC free article] [PubMed] [Google Scholar]
- 11.Theodoridis G, Gika HG, Wilson ID. TrAC, Trends Anal. Chem. 2008;27:251–260. [Google Scholar]
- 12.Filla LA, Yuan W, Feldman EL, Li S, Edwards JL. J. Proteome Res. 2014;13:6121–6134. doi: 10.1021/pr501030e. [DOI] [PMC free article] [PubMed] [Google Scholar]
- 13.Chen S, Hoene M, Li J, Li Y, Zhao X, Haring HU, Schleicher ED, Weigert C, Xu G, Lehmann R. J. Chromatogr. A. 2013;1298:9–16. doi: 10.1016/j.chroma.2013.05.019. [DOI] [PubMed] [Google Scholar]
- 14.Gao X, Zhang Q, Meng D, Isaac G, Zhao R, Fillmore TL, Chu RK, Zhou J, Tang K, Hu Z, Moore RJ, Smith RD, Katze MG, Metz TO. Anal. Bioanal. Chem. 2012;402:2923–2933. doi: 10.1007/s00216-012-5773-5. [DOI] [PMC free article] [PubMed] [Google Scholar]
- 15.Tseng YJ, Kuo CT, Wang SY, Liao HW, Chen GY, Ku YL, Shao WC, Kuo CH. Electrophoresis. 2013;34:2918–2927. doi: 10.1002/elps.201200580. [DOI] [PubMed] [Google Scholar]
- 16.Haggarty J, Oppermann M, Dalby MJ, Burchmore RJ, Cook K, Weidt S, Burgess KE. Metabolomics. 2015;11:1465–1470. doi: 10.1007/s11306-014-0770-7. [DOI] [PMC free article] [PubMed] [Google Scholar]
- 17.Haskins WE, Wang Z, Watson CJ, Rostand RR, Witowski SR, Powell DH, Kennedy RT. Anal. Chem. 2001;73:5005–5014. doi: 10.1021/ac010774d. [DOI] [PubMed] [Google Scholar]
- 18.Zhou Y, Mabrouk OS, Kennedy RT. J. Am. Soc. Mass Spectrom. 2013;24:1700–1709. doi: 10.1007/s13361-013-0605-1. [DOI] [PMC free article] [PubMed] [Google Scholar]
- 19.Zhang Z, Jia C, Li L. J. Sep. Sci. 2012;35:1779–1784. doi: 10.1002/jssc.201200051. [DOI] [PMC free article] [PubMed] [Google Scholar]
- 20.Maes K, Van Liefferinge J, Viaene J, Van Schoors J, Van Wanseele Y, Bechade G, Chambers EE, Morren H, Michotte Y, Vander Heyden Y, Claereboudt J, Smolders I, Van Eeckhaut A. J. Chromatogr. A. 2014;1360:217–228. doi: 10.1016/j.chroma.2014.07.086. [DOI] [PubMed] [Google Scholar]
- 21.Mabrouk OS, Kennedy RT. J. Neurosci. Methods. 2012;209:127–133. doi: 10.1016/j.jneumeth.2012.06.006. [DOI] [PMC free article] [PubMed] [Google Scholar]
- 22.Han J, Ye L, Xu L, Zhou Z, Gao F, Xiao Z, Wang Q, Zhang B. Anal. Chim. Acta. 2014;852:267–273. doi: 10.1016/j.aca.2014.09.006. [DOI] [PubMed] [Google Scholar]
- 23.Shen Y, Zhang R, Moore RJ, Kim J, Metz TO, Hixson KK, Zhao R, Livesay EA, Udseth HR, Smith RD. Anal. Chem. 2005;77:3090–3100. doi: 10.1021/ac0483062. [DOI] [PubMed] [Google Scholar]
- 24.Wang F, Wei X, Zhou H, Liu J, Figeys D, Zou H. Proteomics. 2012;12:3129–3137. doi: 10.1002/pmic.201200162. [DOI] [PubMed] [Google Scholar]
- 25.Grebe SKG, Singh RJ. Clin. Biochem. Rev. 2011:32. [PMC free article] [PubMed] [Google Scholar]
- 26.Abbatiello SE, Schilling B, Mani DR, Zimmerman LJ, Hall SC, MacLean B, Albertolle M, Allen S, Burgess M, Cusack MP, Gosh M, Hedrick V, Held JM, Inerowicz HD, Jackson A, Keshishian H, Kinsinger CR, Lyssand J, Makowski L, Mesri M, Rodriguez H, Rudnick P, Sadowski P, Sedransk N, Shaddox K, Skates SJ, Kuhn E, Smith D, Whiteaker JR, Whitwell C, Zhang S, Borchers CH, Fisher SJ, Gibson BW, Liebler DC, MacCoss MJ, Neubert TA, Paulovich AG, Regnier FE, Tempst P, Carr SA. Mol. Cell. Proteomics. 2015;14:2357–2374. doi: 10.1074/mcp.M114.047050. [DOI] [PMC free article] [PubMed] [Google Scholar]
- 27.Rauh M. J. Chromatogr. B: Anal. Technol. Biomed. Life Sci. 2012;883–884:59–67. doi: 10.1016/j.jchromb.2011.09.030. [DOI] [PubMed] [Google Scholar]
- 28.Alberice JV, Amaral AF, Armitage EG, Lorente JA, Algaba F, Carrilho E, Marquez M, Garcia A, Malats N, Barbas C. J. Chromatogr. A. 2013;1318:163–170. doi: 10.1016/j.chroma.2013.10.002. [DOI] [PubMed] [Google Scholar]
- 29.Bjellaas T, Holm A, Molander P, Tornes JA, Greibrokk T, Lundanes E. Anal. Bioanal. Chem. 2004;378:1021–1030. doi: 10.1007/s00216-003-2405-0. [DOI] [PubMed] [Google Scholar]
- 30.Novotny MV, Daido I. Microcolumn Separations Columns, Instrumentation, and Ancillary Techniques. Amsterdam, New York; New York: Elsevier Science Pub. Co.; 1985. [Google Scholar]
- 31.Moore AW, Jorgenson JW. Anal. Chem. 1995;67:3448–3455. doi: 10.1021/ac00115a013. [DOI] [PubMed] [Google Scholar]
- 32.Molander P, Thommesen SJ, Bruheim IA, Trones R, Greibrokk T, Lundanes E, Gundersen TE. J. High Resolut. Chromatogr. 1999;22:490–494. [Google Scholar]
- 33.Trones R, Tangen A, Lund W, Greibrokk T. J. Chromatogr. A. 1999;835:105–112. [Google Scholar]
- 34.Prüß A, Kempter C, Gysler J, Jira T. J. Chromatogr. A. 2004;1030:167–176. doi: 10.1016/j.chroma.2003.11.017. [DOI] [PubMed] [Google Scholar]
- 35.Wei H, Nolkrantz K, Parkin MC, Chisolm CN, O’Callaghan JP, Kennedy RT. Anal. Chem. 2006;78:4342–4351. doi: 10.1021/ac052196x. [DOI] [PubMed] [Google Scholar]
- 36.Gilar M, McDonald TS, Roman G, Johnson JS, Murphy JP, Jorgenson JW. J. Chromatogr. A. 2015;1381:110–117. doi: 10.1016/j.chroma.2015.01.002. [DOI] [PubMed] [Google Scholar]
- 37.Snyder LR, Kirkland JJ, Dolan JW. Introduction to Modern Liquid Chromatography. 3rd. Hoboken, NJ: John Wiley and Sons, Inc.; 2010. [Google Scholar]
- 38.Foster MD, Arnold MA, Nichols JA, Bakalyar SR. J. Chromatogr. A. 2000;869:231–241. doi: 10.1016/s0021-9673(99)00957-7. [DOI] [PubMed] [Google Scholar]
- 39.Heron S, Tchapla A, Chervet J-P. Chromatographia. 2000;51:495–499. [Google Scholar]
- 40.Layne J, Farcas T, Rustamov I, Ahmed F. J. Chromatogr. A. 2001;913:233–242. doi: 10.1016/s0021-9673(00)01199-7. [DOI] [PubMed] [Google Scholar]
- 41.Leon-Gonzalez ME, Rosales-Conrado N, Perez-Arribas LV, Polo-Diez LM. J. Chromatogr. A. 2010;1217:7507–7513. doi: 10.1016/j.chroma.2010.09.076. [DOI] [PubMed] [Google Scholar]
- 42.Rezai MA, Famiglini G, Cappiello A. J. Chromatogr. A. 1996;742:69–78. [Google Scholar]
- 43.Wang X, Barber WE, Carr PW. J. Chromatogr. A. 2006;1107:139–151. doi: 10.1016/j.chroma.2005.12.050. [DOI] [PubMed] [Google Scholar]
- 44.Grushka E. Anal. Chem. 1970;42:1142–1147. [Google Scholar]
- 45.Robards K, Haddad PR, Jackson PE. Principles and Practice of Modern Chromatographic Methods. San Diego, CA: Academic Press, Inc.; 1997. [Google Scholar]
- 46.Bird RB, Stewart WE, Lightfoot EN. Transport Phenomena. 2nd. New York: John Wiley and Sons, Inc.; 2002. [Google Scholar]
- 47.Poppe H, Kraak JC, Huber JFK, van den Berg JHM. Chromatographia. 1981;14:515–523. [Google Scholar]
- 48.Bowermaster J, McNair H. J. Chromatogr. 1983;279:431–438. [Google Scholar]
- 49.Zhu PL, Dolan JW, Snyder LR. J. Chromatogr. A. 1996;756:41–50. doi: 10.1016/s0021-9673(96)00721-2. [DOI] [PubMed] [Google Scholar]
- 50.Jandera P, Blomberg LG, Lundanes E. J. Sep. Sci. 2004;27:1402–1418. doi: 10.1002/jssc.200401852. [DOI] [PubMed] [Google Scholar]
- 51.Giddings JC. Unified Separation Science. New York: Wiley-Interscience; 1991. [Google Scholar]
- 52.Greibrokk T, Andersen T. J. Sep. Sci. 2001;24:899–909. [Google Scholar]
- 53.Grushka E, Colin H, Guiochon G. J. Chromatogr. 1982;248:325–339. [Google Scholar]
- 54.Gasslander U, Arbin A, Albertsson A-C. Polymer. 2007;48:7523–7530. [Google Scholar]
- 55.Holm A, Molander P, Lundanes E, Greibrokk T. J. Sep. Sci. 2003;26:1147–1153. [Google Scholar]
- 56.Eghbali H, Sandra K, Tienpont B, Eeltink S, Sandra P, Desmet G. Anal. Chem. 2012;84:2031–2037. doi: 10.1021/ac203252u. [DOI] [PubMed] [Google Scholar]
- 57.Groskreutz SR, Weber SG. J. Chromatogr. A. 2014;1354:65–74. doi: 10.1016/j.chroma.2014.05.056. [DOI] [PMC free article] [PubMed] [Google Scholar]
- 58.Groskreutz SR, Horner AR, Weber SG. J. Chromatogr. A. 2015;1405:133–139. doi: 10.1016/j.chroma.2015.05.071. [DOI] [PMC free article] [PubMed] [Google Scholar]
- 59.Chuman H, Mori A, Tanaka H, Yamagami C, Fujita T. J. Pharm. Sci. 2004;93:2681–2697. doi: 10.1002/jps.20168. [DOI] [PubMed] [Google Scholar]
- 60.Schultz TW, Hewitt M, Netzeva TI, Cronin MTD. QSAR Comb. Sci. 2007;26:238–254. [Google Scholar]
- 61.Neue UD, Kuss HJ. J. Chromatogr. A. 2010;1217:3794–3803. doi: 10.1016/j.chroma.2010.04.023. [DOI] [PubMed] [Google Scholar]
- 62.Zhang J, Liu Y, Jaquins-Gerstl A, Shu Z, Michael AC, Weber SG. J. Chromatogr. A. 2012;1251:54. doi: 10.1016/j.chroma.2012.06.002. [DOI] [PMC free article] [PubMed] [Google Scholar]
- 63.Colin H, Martin M, Guiochon G. J. Chromatogr. 1979;185:79–95. [Google Scholar]
- 64.Snyder LR, Dolan JW. High-Performance Gradient Elution: The Practical Application of the Linear-Solvent-Strength Model. John Wiley and Sons, Inc.; 2007. [Google Scholar]
- 65.Gilpin RK, Jaroniec M, Lin S. Chromatographia. 1990;30:393–399. [Google Scholar]
- 66.Chen MH, Horvath C. J. Chromatogr. A. 1997;788:51–61. doi: 10.1016/s0021-9673(97)00715-2. [DOI] [PubMed] [Google Scholar]
- 67.Liu H, Finch JW, Lavallee MJ, Collamati RA, Benevides CC, Gebler JC. J. Chromatogr. A. 2007;1147:30–36. doi: 10.1016/j.chroma.2007.02.016. [DOI] [PubMed] [Google Scholar]
- 68.Jandera P. Anal. Chim. Acta. 2011;692:1–25. doi: 10.1016/j.aca.2011.02.047. [DOI] [PubMed] [Google Scholar]
- 69.Soukup J, Jandera P. Biologija. 2011;57:85–91. [Google Scholar]
- 70.Soukup J, Jandera P. J. Chromatogr. A. 2012;1245:98–108. doi: 10.1016/j.chroma.2012.05.024. [DOI] [PubMed] [Google Scholar]
- 71.Kumar A, Heaton JC, McCalley DV. J. Chromatogr. A. 2013;1276:33–46. doi: 10.1016/j.chroma.2012.12.037. [DOI] [PubMed] [Google Scholar]
- 72.Yi Y. Capillary HPLC Separation of Selected Neuropeptides. Pittsburgh: University of Pittsburgh; 2012. [Google Scholar]
- 73.Mao Y, Carr PW. Anal. Chem. 2000;72:110–118. doi: 10.1021/ac990638x. [DOI] [PubMed] [Google Scholar]
- 74.Saifutdinov BR, Emel’yanova NS, Pimerzin AA. Prot. Met. Phys. Chem. Surf. 2014;50:317–325. [Google Scholar]
- 75.Kuznetsova ES, Buryak AK. Colloids Surf., A. 2011;383:73–79. [Google Scholar]
- 76.Melmer M, Stangler T, Premstaller A, Lindner W. J. Chromatogr. A. 2010;1217:6092–6096. doi: 10.1016/j.chroma.2010.07.059. [DOI] [PubMed] [Google Scholar]
- 77.Gaudin K, Hanai T, Chaminade P, Baillet A. J. Chromatogr. A. 2007;1157:56–64. doi: 10.1016/j.chroma.2007.05.028. [DOI] [PubMed] [Google Scholar]
- 78.Kwaterczak A, Bielejewska A. Anal. Chim. Acta. 2005;537:41–46. [Google Scholar]
- 79.Moeckel HJ, Braedikow A, Melzer H, Aced G. J. Liq. Chromatogr. 1991;14:2477–2498. [Google Scholar]
Associated Data
This section collects any data citations, data availability statements, or supplementary materials included in this article.


