Abstract
In 1943, Luria and Delbrück used a phage resistance assay to establish spontaneous mutation as a driving force of microbial diversity1. Mutation rates are still studied using such assays, but these can only examine the small minority of mutations conferring survival in a particular condition. Newer approaches, such as long-term evolution followed by whole-genome sequencing 2, 3, may be skewed by mutational “hot” or “cold” spots 3, 4. Both approaches are affected by numerous caveats 5, 6, 7 (see Supplemental Information). We devise a method, Maximum-Depth Sequencing (MDS), to detect extremely rare variants in a population of cells through error-corrected, high-throughput sequencing. We directly measure locus-specific mutation rates in E. coli and show that they vary across the genome by at least an order of magnitude. Our data suggest that certain types of nucleotide misincorporation occur 104-fold more frequently than the basal rate of mutations, but are repaired in vivo. Our data also suggest specific mechanisms of antibiotic-induced mutagenesis, including downregulation of mismatch repair via oxidative stress; transcription-replication conflicts; and in the case of fluoroquinolones, direct damage to DNA.
De novo mutations in bacteria remain a notoriously difficult target for high-throughput sequencing. Whereas E. coli mutate less than 1 in 109 bases per generation, high-fidelity polymerases used for library preparation PCR make errors ~4 in 106 bases8. Illumina machines misread ~1 in 103 bases 9. Recent methods, such as barcoding of reads from the same original DNA molecule8 have lowered the error rate of sequencing. However, such methods can be of low yield10 and do not address errors introduced by PCR. PCR errors can be overcome using duplex barcoding, which forms a consensus from both strands of a DNA template molecule11. However, even when a small region is targeted12, duplexing lowers yield even further. The mutational landscape of an RNA virus with mutation rate 104-fold greater than E. coli was recently mapped using “circle sequencing”. However, this technique is not designed for targeted coverage of a single locus, and its accuracy is limited by sequence read length10, 13.
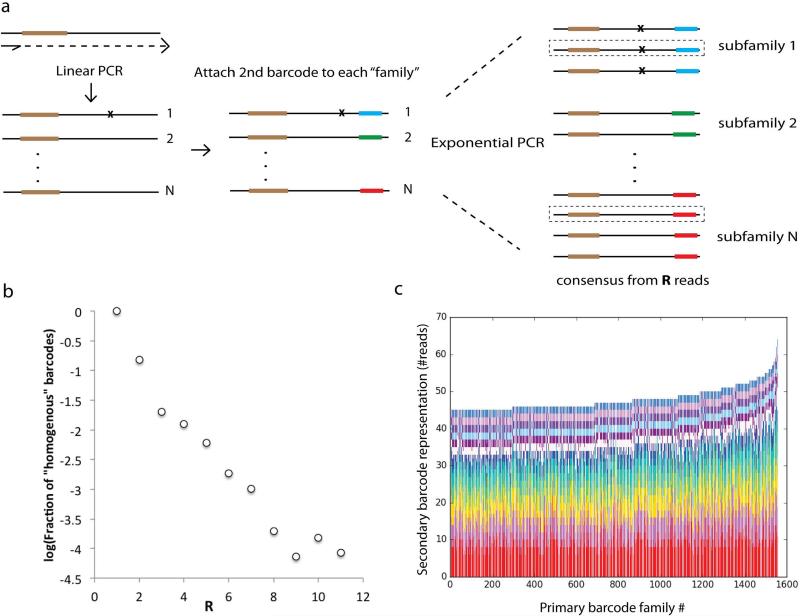
We introduce Maximum-Depth Sequencing (MDS) for detecting extremely rare variants in any region of interest (ROI) in a population of cells (See Methods, Fig. 1a). By synthesizing unique barcodes directly onto the ROI of an original genomic DNA molecule and then copying that molecule using linear amplification, we increase yield (Fig. 1B) and drown out both polymerase and sequencing errors (Fig. 1C). On mock cultures with single-nucleotide mutants spiked in at known concentrations, MDS reliably recovers the expected proportion of mutants at the lowest frequency tested, 10−6 (Extended Data Fig. 1). On in vitro synthesized DNA templates, MDS reduces the error rate to less than 5×10⁻⁸ per nucleotide sequenced (Fig. 1C, Extended Data Fig. 2). By increasing the number of reads used to call a consensus sequence (R), MDS can lower error rate indefinitely, given sufficient coverage (Methods: Error Rate of MDS). Application of a second barcode after linear PCR increases accuracy at an even sharper rate and was used here to demonstrate library preparation efficiency (Extended Data Fig. 2 and Supplemental Information: Testing Sample Preparation and PCR Efficiency.)
Fig. 1. MDS Overview.
(a) Comparison of traditional barcoding protocol with MDS. See Methods for details. Note an additional barcode can be attached after linear amplification to further increase accuracy (see Extended Data Fig. 2). (b) Mean yield of various methods, in consensus nucleotides called per nucleotides sequenced. Results from our study are boxed. (C) Mean error rate of various methods when applied to in vitro synthesized DNA, in frequency of miscalled bases (log10 scale). Error rates from our study are given using both Phusion and Q5 polymerase. *Analysis of 1,685,502 consensus nucleotides yielded no errors. The value shown is extrapolated from the Q5 error rate and expected reduction given R=3. Yield and error rate from previous methods are from (10). MDS experiments were performed in quadruplicate. Error bars are standard deviation.
We use MDS to investigate mutation rates in MG1655 E. coli grown for ≤120 generations. We investigate six ~100 nucleotide ROIs: 1) part of the coding sequence (CDS) of the beta subunit of RNA Polymerase (rpoB), which when mutated confers rifampicin resistance; 2) the 3’ untranslated region (UTR) of rpoB; 3) the RNAP omega subunit, rpoZ; 4) the CDS of cold-shock response gene cspE; 5) the center of the CDS of penicillin-binding protein gene mrcA and 6) the 3’ end of the CDS of mrcA. The last three genes, when knocked out, do not affect cell growth14, 15. While rpoB, rpoZ, and cspE are highly transcribed, mrcA is one of the least-transcribed genes in E. coli under normal conditions15. All ROIs have balanced AT/CG content, are transcribed on the leading strand, and lack homopolymers >8nt.
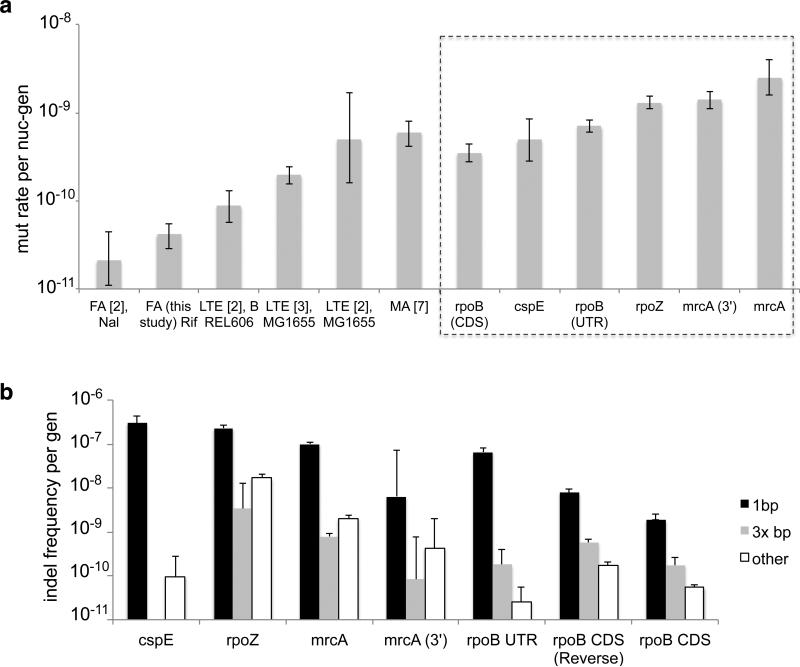
Mutation rates in E. coli have been reported from 0.2×10⁻¹⁰ to 5×10⁻¹⁰ nucleotides/generation3, 16, 17. Our calculated rate of mutation in rpoB CDS using synonymous substitutions is 4.1×10⁻¹⁰ nucleotides/generation, comparable to the rate obtained in 17 and at least one long-term evolution experiment using MG16552. Yet it is also higher than rates calculated by fluctuation assay and long-term evolution on other strains (Fig. 2A, Extended Data Fig. 3). We performed fluctuation assays and recovered a similar spectrum and low rate of mutation to others using such approaches16. It is likely that the higher rate of mutation in rpoB obtained with MDS indicates a rate uninfluenced by negative selection, phenotypic lag, or imperfect plating efficiency5.
Fig. 2. Substitution rates and indel frequencies.
(a) Comparison of mutation rates calculated from fluctuation assays (FA) using either rifampicin (Rif) or nalidixic acid (Nal), long-term evolution (LTE), and mutation accumulation (MA). Rates calculated using MDS are boxed. All error bars are 95% CI. Note that number of generations is calculated according to population doubling time in Ref. 2 and 3 (see SI: Generation Time Models). (b) Frequency of indel mutations recovered at t=120 generations. Values are normalized for possible indel lengths considered in each category. Experiments are biological quadruplicates.
Mutation rate in nonessential ropZ, and cspE, as well as rpoB UTR, is only slightly higher than that in essential rpoB CDS, but our calculated rate of mutation in the middle of mrcA is 3.5×10⁻⁹ nucleotides/generation, an order of magnitude higher than the observed rate in rpoB CDS and significantly higher than the rates of mutation in all other ROIs (p<0.001 by ANOVA). The 3’ end of mrcA also has a higher rate of mutation than all other ROIs considered except for the middle of mrcA, suggesting spatial clustering of mutation rates. Comparison of genomes from several E. coli strains has suggested that clustered, highly transcribed genes are protected from mutation by an unknown mechanism4, a finding that has since been challenged3, 18. Our results demonstrate that at least one gene with low transcription rate has significantly higher mutation rate than three others with high transcription rate.
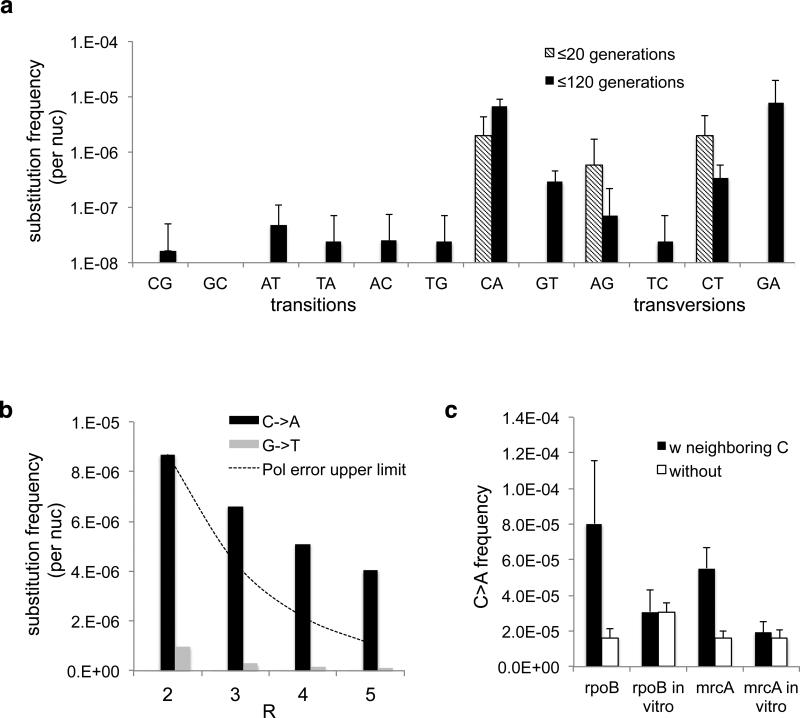
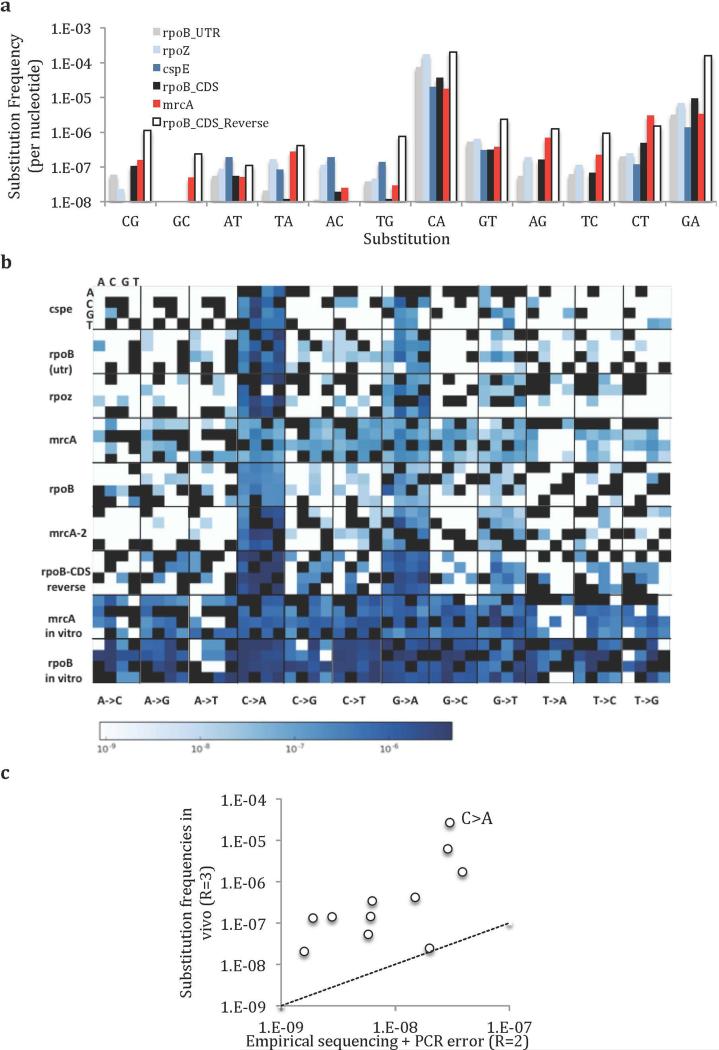
The mutational spectrum from MDS matches that found in long-term sequencing experiments, with transition mutations favored over transversions (Fig. 3A, Extended Data Fig. 4, 5a). We also note an unexpected high frequency of C->A substitutions. These appear not to be lasting mutations, as complementary G->T substitutions emerged with less than 0.1-fold frequency. A similar effect was found to a lesser extent for G->A/C->T substitutions. Increasing R did not significantly reduce these high substitution frequencies (Fig. 3B, SI: Model of Damaged Base Pairs), suggesting that the majority of in vivo C->A substitutions are not due to damaged nucleotides. We found that in vitro templates synthesized with 8-oxoG resulted in low C->A substitution rates (Extended Data Fig. 3C), and treatment of in vivo DNA with fpg did not change the observed substitution frequency (Extended Data Fig. 3C), further confirming that these C->A substitutions are unlikely due to 8-oxoG. It is possible that As, or rAs, are misincorporated into the genome at C sites in vivo. We found that neighboring Cs are predictive of a higher frequency of C->A substitutions, suggesting that these transient substitutions cluster spatially along the genome, unlike polymerase or sequencing errors (Fig. 3C, Extended Data Fig. 3b, 4, 5b).
Fig. 3. Substitution spectra.
(a) Frequency of base substitutions recovered in our sequencing protocol at t=20 generations and t=120 generations in rpoB CDS. Values are not normalized by number of generations and thus are true frequencies, not mutation rates. Experiments are biological quadruplicates. Error bars are 95% CI upper bound. (b) The high frequency of C->A substitutions is consistent even as R increases. If these substitutions were polymerase errors due to damaged nucleotides, they should decline with increasing R faster than the line representing a model in which the polymerase makes C->A errors with 50% frequency for a subpopulation of DNA molecules (see Supplemental Information: Model of Damaged Base Pairs). (c) C->A substitutions in vivo cluster in nucleotides with at least 2 neighboring Cs within a 2bp radius, unlike polymerase errors (*=p<0.01 by t-test).
In vivo these misincorporations must be reversed before genome replication. However, our observations represent a snapshot of this dynamic process before repair can occur. Although these events would be invisible to conventional methods, the frequency of these substitutions, at ~10−5 per nucleotide, is over 104 times more frequent than the true rate of mutation.
To clarify which substitutions are transient vs. involved in “true” mutation, we analyzed DNA from bacteria harvested after ≤20 generations, a short enough time period to where few true mutations are expected given our sample size (Fig. 3A).
We observed enrichment for most types of substitutions in our ≤120 generation trial over our ≤20 generation control, as would be expected from true mutations. However, C->A, A->G, and C->T substitutions occur in comparable frequency in the 20 and 120 generation trials, suggesting these substitutions reflect a continual process of base misincorporation and repair. We did not include these abundant A and T substitutions in our calculation of mutation rates. However, these findings suggest that the mechanism underlying the increase of AT content in E. coli grown for long periods2 is a dynamic process of misincorporation and repair.
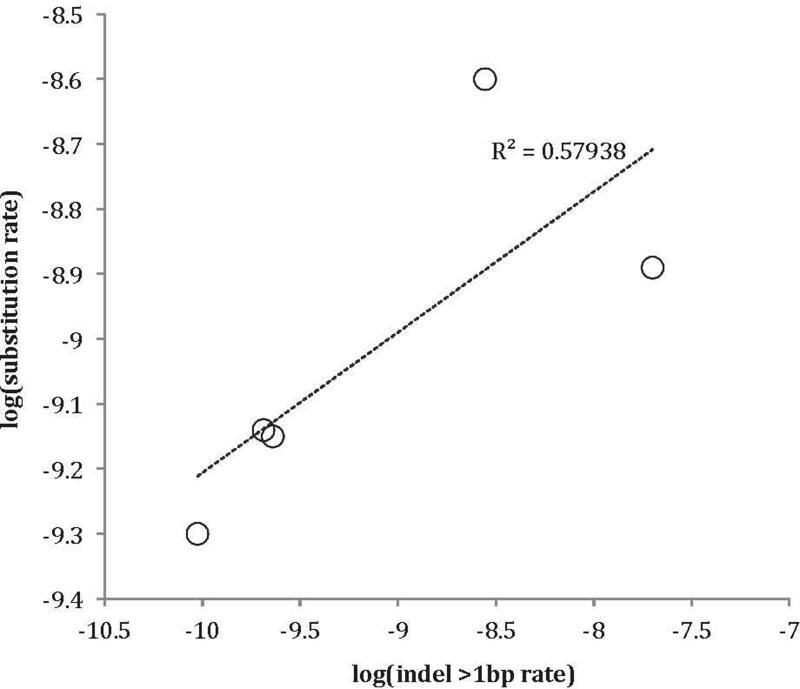
We calculated short (≤12bp) indel rates in mrcA, rpoB UTR, ropZ, and cspE ROIs (Fig. 2B). Indel rate varies widely by position and size. As might be expected19, 100% of the observed 1bp indels occur at a site adjacent to a homopolymer. The frequency of 1-bp indels also increases with homopolymer length, suggesting why cspE, with an 8-bp T homopolymer, has the highest 1-bp indel rate. Longer indels are not localized to homopolymers and are positively correlated with substitution rates across all ROIs (Extended Data Fig. 6), supporting previous work suggesting that indels and substitutions spatially cluster in comparisons of genomes from divergent bacterial species20. In all ROIs deletions were detected at >10-fold frequency of insertions.
Single nucleotide indels and longer frame-shifting mutations were also observed in rpoB CDS, albeit at low frequency, even though such mutations should be deleterious. As expected, the rate of in-frame indels was higher than the rate of frameshift indels of length >1bp (Fig. 2B). Because of the low rate of indel errors from in vitro polymerases used here8, it is plausible that the observed frameshift mutations are from inviable bacteria, as such cells’ DNA may still enter our protocol. The recovery of frameshift indels, as well as the insignificant difference between rates of synonymous and nonsynonymous substitutions in rpoB CDS (Supplemental Table 3), demonstrate that selection in our protocol is minimal.
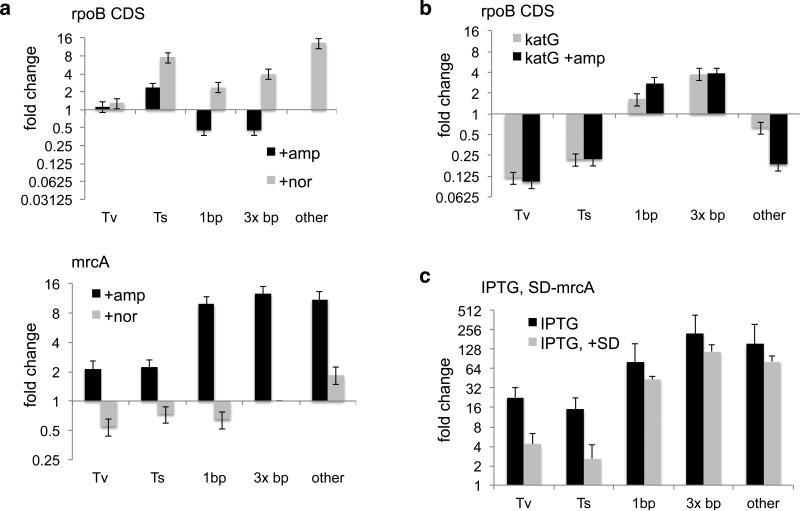
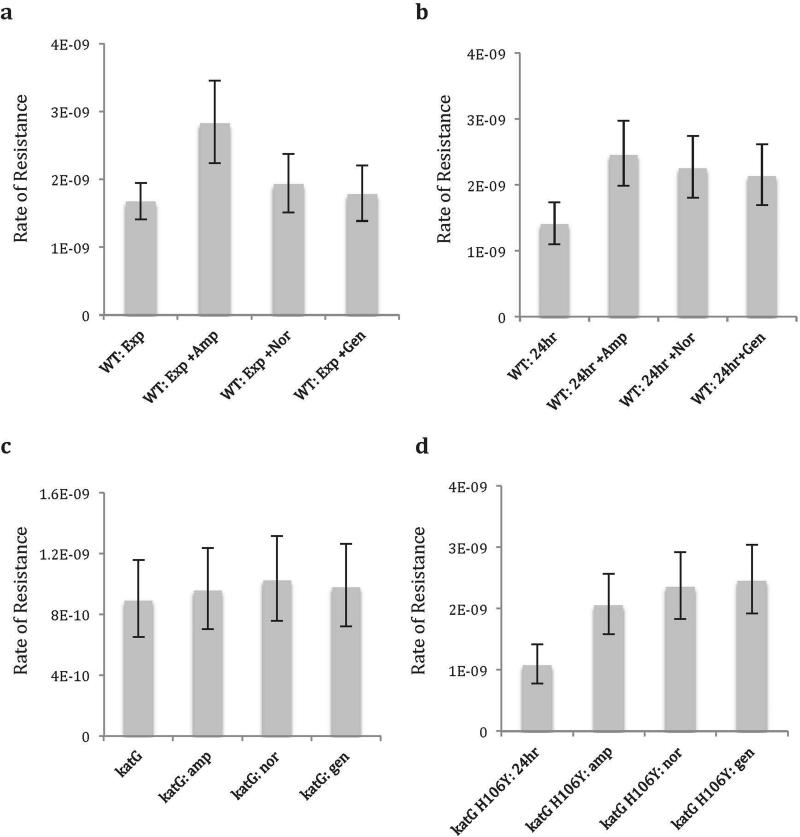
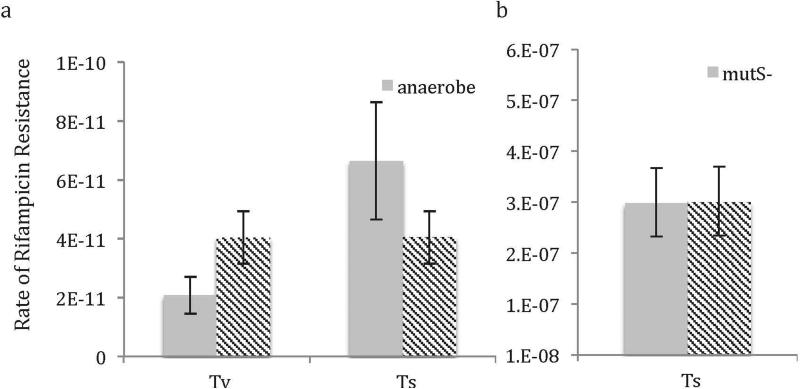
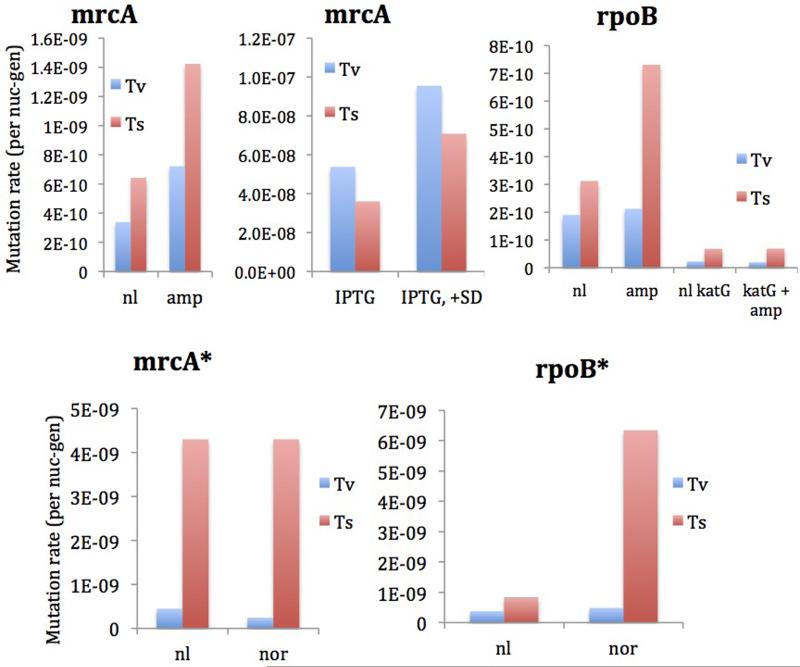
Exposing E. coli to sub-inhibitory doses of multiple classes of antibiotics increases the rate at which bacteria acquire resistance to rifampicin. Whether this increase is caused by nucleotide oxidation21, 22, downregulation of mismatch repair23, or an unrelated pathway24, has become a topic of immense interest. We investigated the effect of sub-inhibitory doses of ampicillin and norfloxacin—a beta lactam and fluoroquinolone respectively—on mutation rate using MDS of rpoB CDS and mrcA as well as detailed fluctuation assays16, 25 (Fig. 4A). Addition of ampicillin increased the rate of transition mutations in rpoB, a signature indicative of down-regulated mismatch repair3. In cells overexpressing catalase, basal mutation rate decreased by a factor of 8 (Fig. 4B), indicating that background oxidation contributes significantly to the basal mutation rate under non-stressed conditions. Addition of ampicillin during catalase overexpression did not increase this low rate (Fig. 4B). Overexpression of a catalase with inactivating point mutation H106Y did not confer similar mutagenic protection (Extended Data Fig. 7). These results together support a model in which ampicillin causes oxidative stress21, which acts upstream of downregulation of mismatch repair23 to increase mutation rate. Consistently, cells grown in anaerobic conditions did not display an increase in transition rate when challenged with ampicillin (Extended Data Fig. 8A). The same was true in aerobic conditions if mismatch repair gene mutS was knocked out (Extended Data Fig. 8B. See SI for further discussion).
Fig. 4. Relationships between mutation rates and physiologic conditions.
(a) Fold change in transversion (Tv), transition (Ts), and indel rate in response to ampicillin or norfloxacin according to MDS (for fluctuation assay results and raw substitution rates see Extended Data Fig. S9). (b) Fold change in mutation rate in a strain overexpressing catalase (KatG). (c) Fold change in mutation rate of mrcA in response to induction via IPTG promoter. Experiments are biological quadruplicates. Error bars are 95% CI.
In contrast, exposure to norfloxacin increased the rate of >1-bp indel formation in both mrcA and rpoB (Fig. 4A). Norfloxacin inhibits DNA gyrase and can cause double-strand breaks in DNA26. This physical interaction thus directly causes antibiotic-induced mutagenesis in norfloxacin-treated cells.
There is debate as to whether highly transcribed genes in bacteria have a higher18, 27, or lower4 mutation rate than other genes. Our analysis in E coli shows that mrcA has a higher basal rate of mutation than more highly transcribed genes. Yet interestingly, addition of ampicillin increased transversions and indel formation in mrcA, but not in rpoB CDS (Fig. 4A). It is known that mrcA undergoes mild induction upon addition of ampicillin28. To further study the effect of transcription on mutagenesis, we created a strain in which a chromosomal copy of mrcA is regulated by an IPTG promoter. Induction of mrcA transcription increased the frequency of all classes of mrcA substitution and indel ~8-fold more than when wild-type cells were exposed to ampicillin (Fig. 4c). These results suggest that although in basal conditions cells may have a means of protecting the most highly transcribed genes, co-directional collisions between transcription and replication machinery, which can cause double-strand breaks29, are themselves mutagenic. Induction itself may thus be an important mechanism of stress-induced mutagenesis30.
The low translation rate of mrcA, coupled with our finding that rpoB UTR has a higher rate of mutation than the CDS, suggest that translation may be protective to highly transcribed genes. We constructed an additional strain in which IPTG-regulated mrcA has a canonical Shine-Dalgarno (SD) sequence and start codon, rather than its low-translation endogenous sequence. Increasing translation decreased substitution rate in the IPTG-induced state by a factor of 50% and a factor of 75% when high-frequency (C>A etc.) substitutions are excluded (Fig. 4c). Although translation does not lower the mrcA mutation rate to rpoB levels, it likely contributes to protection of highly transcribed genes (SI: Relationship between Transcription, Translation, and Mutation Rate).
Straightforward extensions to MDS would allow for analysis of many ROIs simultaneously and assembly of longer ROIs (SI: MDS Protocol). MDS may also be useful in detection of genetic abnormalities in cell-free DNA due to fetal mutations or cancer.
Methods
Maximum-Depth Sequencing
First, genomic DNA is treated with a restriction enzyme, which cleaves at the 3’ end of the ROI. A single PCR cycle is performed with barcoded primers annealing to the 3’ end of the ROI. Because of the exposed 3’ site on the genomic DNA molecule left by the restriction enzyme, the genomic DNA molecule acts as a “primer,” causing the barcode and an adaptor to be synthesized onto the end of the ROI. This synthesis effectively attaches the barcode to the original genomic DNA molecule. Unused barcoded primers are removed, and N cycles of linear amplification are performed using only primers to the forward adapter sequence. This step is key to screening polymerase errors. The polymerase may make an error in any single round of synthesis, increasing the probability of generating a faulty read by N, but by copying the same original DNA molecule multiple times, the probability of recovering a defective copy after analysis is reduced by a factor of NR, where R is the number of independent reads used to build a consensus sequence. Thus the total error reduction is 1/NR-1 fold (see below). In this study, typically N=12 and R≥3, although the empiric value of N after accounting for inefficiencies in PCR is somewhat lower (see Extended Data Fig. 2 and Supplemental Information: Testing Sample Preparation and PCR Efficiency). Note that one could also attach a second barcode to each read after linear amplification but before exponential amplification—doing so could allow one to reduce the error rate even further by ensuring multiple reads from the linear amplification step are used in the analysis. By targeting a ROI, we can also use paired-end sequencing to increase yield. Detailed error rate spectra for both Phusion and Q5 polymerase are measured and reported in Supplemental Table 1. It should be noted that when R>2, MDS errors such as those shown in Figure 1 are derived almost entirely from transition substitutions typical of PCR polymerases, and that for other kinds of substitutions, error rate is virtually nonexistent. In MDS, each read represents additional 1× coverage of the ROI. Thus, MDS can achieve ~109-fold coverage using an Illumina HiSeq machine. For details on the specific enzymes, primers, and PCR conditions used in this study see Supplemental Information: MDS Protocol. For details on consensus base calling, see Supplemental Information: Analysis.
Error Rate of MDS
Sources of error include damaged DNA during extraction, polymerase errors during PCR, and sequencing errors. Because our goal is to identify rare mutants, we consider error as the rate of false positives, which affect mutant frequency to a much larger extent than false negatives8.
If the probability of a single nucleotide X being misread as Y due to polymerase error is Ppol,X→Y and the rate of the corresponding sequencing error is Pseq,X→Y, then the probability that X will be read as Y due to either source of error in a standard sequencing protocol is
| (1) |
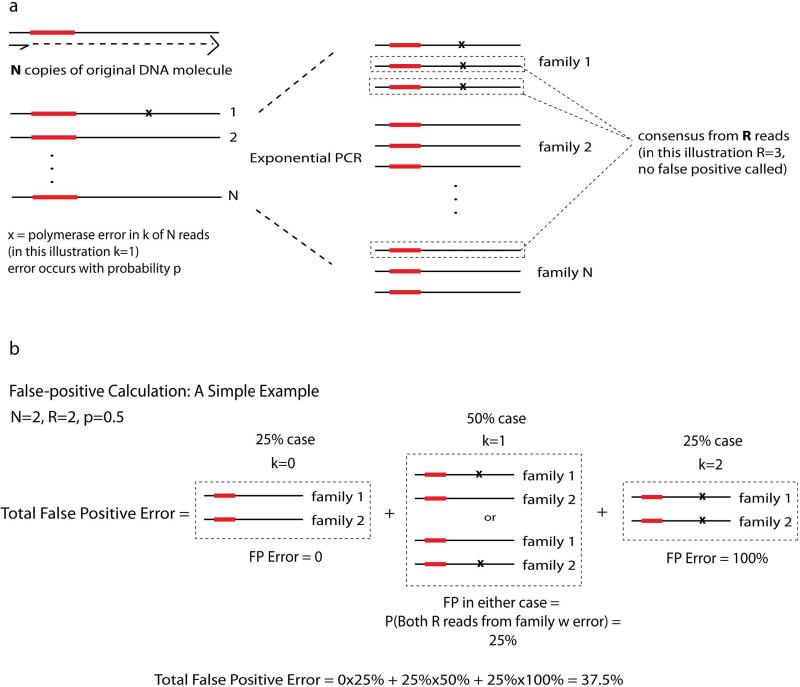
As discussed briefly in the main text, in our assay, the total polymerase error rate Epol,X→Y can be derived as follows (for visual aid, see Extended Data Fig. 10). After exponential PCR, there are N pools of reads, each derived from one of the original linear amplification steps. The probability of having k pools derive from an original polymerase error is binomially distributed. Furthermore, because pN<<1, the distribution is Poisson.
| (2) |
The probability of a false positive is the probability that all R reads used to form a consensus came from one of the k “error” pools
| (3) |
Where MR is the Rth moment of the Poisson distribution in equation 2 and BR is the Rth Bell polynomial Np<1, an upper bound on this error formula can be written as follows:
| (4) |
Where the upper bound of the Rth Bell number BR(1) is from ref 31. These bounds will decrease rapidly as R increases given that R≤N.
We note that in practice, the probability that the same error would emerge in k<1 reads produced by the linear amplification step is ~10−12, so low that the expected number of such multi-errors for all the nucleotides sequenced in this study is <1. With this in mind, it is possible to simplify equation 4 so that that the Bell number term is a non-contributor to the total error. Under this assumption, the probability of false positive is
| (5) |
The above formula for Epol,X→Y only takes into account errors introduced during linear amplification. However, the maximum error that could be contributed during a subsequent round of doubling, or exponential, PCR (D) can be found by substituting 2D N for N in the equation above. The sum of all possible errors from all rounds of PCR would thus be
| (6) |
For R=2 this will be a geometric series with sum no greater than 2Epol,X→Y. For R>2 the sum will be closer to Epol,X→Y.
The error rate of sequencing after forming a barcode, as discussed thoroughly in other texts 8, 10 is the probability that the same error happens R̃ times
| (7) |
Where R̃ is the number of “not necessarily independent” reads used to form a consensus (i.e. overlapping paired-end sequences of the same read are included). If single-end sequencing is used, R̃ = R. If paired-end sequencing is used, a maximum of R̃ = 2R not necessarily independent reads are used.
Alternatively, one could estimate Eseq,X→Y based on the sum of the quality scores of the R̃ reads contributing to the consensus, but in practice we find this to be unnecessary because sequencing errors are not the major contributor to overall error when R>2.
The total error rate for any given nucleotide position is the sum of all EX→Y, X ≠ Y, for a given X. The values reported in the main text and Fig. 1C are total error. Raw polymerase and sequencing error rates9 are shown in Supplemental Table 1. Note that this model is also the basis for the damaged base pair analysis presented in Figure 3B and the SI.
Growth and Mutation Rate Analysis
E. coli were streaked onto Luria-Bertani (LB) Agar from freezer stocks and grown at 30°C for 24 hours. According to plating and colony-forming unit (CFU) counting, the average number of cells in such colonies is 3×10⁸ (thus the number of generations is ln(3×10⁸)=19.5. Bacteria from a single colony were used to inoculate a small liquid culture (1mL LB broth in a round-bottom tube). For the purposes of generation counting, it is assumed that after the transition to growing in liquid, growth occurs for only ~3 generations. The culture was grown in a 37°C shaker to allow for the transition to growth in broth for 12 hours, after which a measurable optical density could be reliably detected.
4 μ L (~107 bacteria) were transferred to a fresh 100mL LB liquid culture (in a 250mL Erlenmeyer flask). Liquid cultures were grown for 24 hours on a 37°C shaker, to a density of 2.5×10⁹ bacteria according to cell counts (for a total of 2.5×10¹¹ bacteria). This process was repeated 9 times. The average number of generations a bacterium would have grown in each liquid culture is
| (8) |
Thus the average total number of generations is 19.5 + 3 + 9×10.1 = 113.
In addition to the large passage size, we stop passaging hundreds of generations before selective sweeps are expected to occur32 and, importantly, long before selection for a hyper-mutating strain might be expected6. We also performed simulations to test the effects the probability that any two bacteria have the same founder given expected conditions of passage size (see Supplemental Information: Calculation of Mutation Rate).
Mutation rates in our assay are chosen to maximize the likelihood of recovering the mean mutant frequency for substitutions of a given type X->Y, which we find are well approximated by a Poisson process over a certain number of generations (in this case 113).
| (9) |
More precisely, the frequency is defined as the number of barcode groups with a given mutation divided by the total number of barcode groups under consideration. For example, if R≥3 then freq(Ȳ) is the number of read families of size ≥3 with mutation Y divided by the total number of read families of size ≥3. Mutation rates given in Fig. 2 are computed from the average across all x of , with C->A, G->T, C->T, and G->A substitutions excluded for aforementioned reasons. In their place, a correction term (the average transversion or transition rate based on all other substitutions) is used so that the mutation rate is not systematically underestimated.
Four biological replicates of each condition were grown. All liquid cultures, including the small founding culture, had the possible addition of 1 μL/mL ampicillin or 15 ng/mL norfloxacin. Cultures for the short-term growth assay and mock culture were grown similarly except without passaging (Supplemental Information: Mock culture and short growth assay).
Strains
MG1655 E. coli were used as wild-type cells for all experiments. The IPTG-regulated mrcA strain MG1655 and IPTG-regulated strain with modified Shine-Dalgarno were recombineered according to 33. For details, see Supplemental Information: Strains. For details on the catalase overexpression mutant and inactive H106Y catalase overexpression mutant see 22. In the mutS knockout strain, MG1655 mutS was replaced with a kanamycin resistance cassette.
Preparation of DNA samples
Genomic DNA: Spin down up to 5mL of bacterial liquid culture (see later section for specific growth conditions). Resuspend cells in 500μL Tris-EDTA buffer (pH 7.5). Add 1000 units of Ready-Lyse (Epicentre). Incubate at room temperature for 1 hour. Freeze in −80°C overnight. Perform genomic DNA extraction using Qiagen genomic tip (100G), but without lysozyme. Quantify using Nanodrop.
In vitro DNA: Single-stranded oligos with sequences corresponding to MG1655 rpoB at position 1511-1632 and mrcA at 1258-1379 were ordered from IDT and resuspended in deionized water. These oligos were used directly as input to the Extreme-depth sequencing protocol above for calculation of error rate in Fig. 1 and the “Negative Control” rows in Supplemental Table 1. Note: As expected from quality control reports from IDT, we found a large number of indels in the in vitro synthesized templates (~1% of molecules had some type of indel). However, the fact that we recovered a low substitution rate could be used to confirm the chemical purity of the mononucleotide pools used for synthesis by IDT.
Separately, 10ng of the same DNA oligos were used as templates for a standard 20-cycle exponential PCR reaction with only the ROI-annealing component of the forward and reverse primers above using either Q5 or Phusion polymerase. The amplified DNA was used as input into the MDS protocol and used to calculate the intrinsic substitution error rate of those two polymerases as reported in Supplemental Table 1.
Sequencing Depth
On average, we divide single HiSeq Rapid Runs of ~240M reads into four different “conditions,” each corresponding to a particular ROI from bacteria grown under a certain condition. The ~60M reads of each condition are further subdivided in order to process triplicate or quadruplicate trials.
We recover ~2.5M total barcode “families” for each condition using our threshold of R≥3 (for the purposes of calculating total yield, we divide by 2 since each read is pair-end sequenced). We examine ~100bp per ROI, thus providing a significant pool from which to observe mutations. There is an interesting level of variability across quadruplicates, likely due to stochastic variation when combining and purifying DNA samples and in binding to the HiSeq flowcell itself (Extended Data Fig. 1b, c). Note that when mutation frequencies are averaged over multiple trials, each trial is weighted according to its relative representation in terms of number of families.
Fluctuation Assays
Fluctuation assays were carried out as in16. We picked single colonies of E. coli as above and grew them in 1mL Luria-Bertani (LB) broth overnight. 0.1 μL from this starter culture was used to inoculate 25 separate trial cultures. Each trial culture was grown (in a 37°C shaker) to either an optical density (OD600) of 0.3 (for exponential growth trials) in 2mL LB broth or for 24 hours (for saturation) in 0.2mL LB broth and plated cultures on petri dishes containing LB agar with 100mg/mL rifampicin. Colonies were grown for 48hrs in 30°C and colony-forming units (CFU) were counted. The rpoB region conferring rifampicin resistance was sequenced and used to compute the mutational profiles in Fig. 4. Number of bacteria per culture was calculated by serial dilution, plating on LB agar, and counting CFU after 48hrs growth in 37°C. Mutation rates and 95% CIs were computed using the Ma-Sandri-Sarkar method34 as implemented in25. Broth was possibly supplemented 1 μL/mL ampicillin, 15 ng/mL norfloxacin, or 250ng/mL gentamycin. LB broth was placed in an LS-580 anaerobe chamber (Anaerobe Systems) overnight to yield anaerobic media.
Extended Data
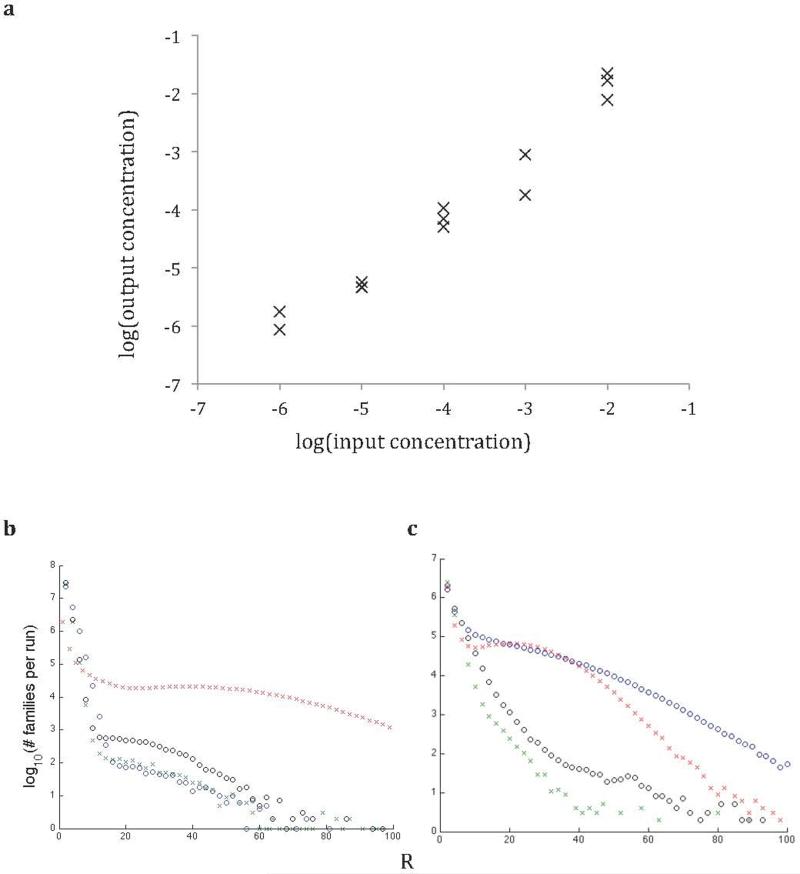
Extended Data Fig. 1.
(a) Mock culture composed of rpoB point mutants of known concentration was sequenced using MDS. Output concentrations of each point mutant recovered from R=2 analysis are plotted against its input concentration (see Supplemental Table 2 for details). (b-c) Distribution of the sizes of barcode families in four trials, shown as log10(# barcode families) per trial vs. size of barcode family in reads (R). (b) Trials used for the calibration run shown in (a) (~100M reads total, divided into four trials) (c) Representative quadruplicate trials (from rpoB of WT bacteria grown in LB broth with no antibiotics) taking up a total of one quarter of the output of a HiSeq rapid run, a total of ~60M reads.
Extended Data Fig. 2.
(a) Barcodes are attached to original DNA molecules as per MDS protocol. After linear amplification, a second barcode is attached to the opposite end of each read (see Supplemental Information: Testing Sample Preparation and PCR Efficiency). Exponential PCR is then performed. In the analysis phase, reads can be grouped both by primary barcode (i.e. a classic MDS barcode family) and a second barcode corresponding to a “subfamily” of reads with the same parent from a particular linear amplification step before exponential amplification. (b) The probability that for a given family only reads of one subfamily are recovered (a “homogenous” barcode) decreases exponentially with R. For example, for R=3, the probability all 3 reads are of the same subfamily is 0.02. (c) We show the number of reads in each subfamily, sorted within each column by subfamily size, for the 1500 largest primary barcode families in the experiment. For families of such size, it is unlikely that a single subfamily will account for more than 25% of the total number of reads recovered from that family.
Extended Data Fig. 3.
(a) Empirically, average substitution frequency (with high frequency substitutions such as C>A excluded) stabilizes as R increases. Note substitution frequencies are not normalized by number of generations. (b) Empirical sequencing C>A error rate at C>A mutational hotspots with neighboring Cs (same as those in Fig. 3c) vs. all other positions. (c) C>A substitution frequencies when 10% 8-oxoG is synthetically added to in vitro DNA and in fpg-treated samples. Frequencies are reported from ROI positions with potential 8-oxoG incorporations as described in template “rpoB_reverse_complement_8-oxo-dG.” Frequencies are reported at R=2 level. For R>2, no C>A substitutions were found in 72,646 in vitro template sites. Data represent biological triplicates. Error bars are standard deviation.
Extended Data Fig. 4.
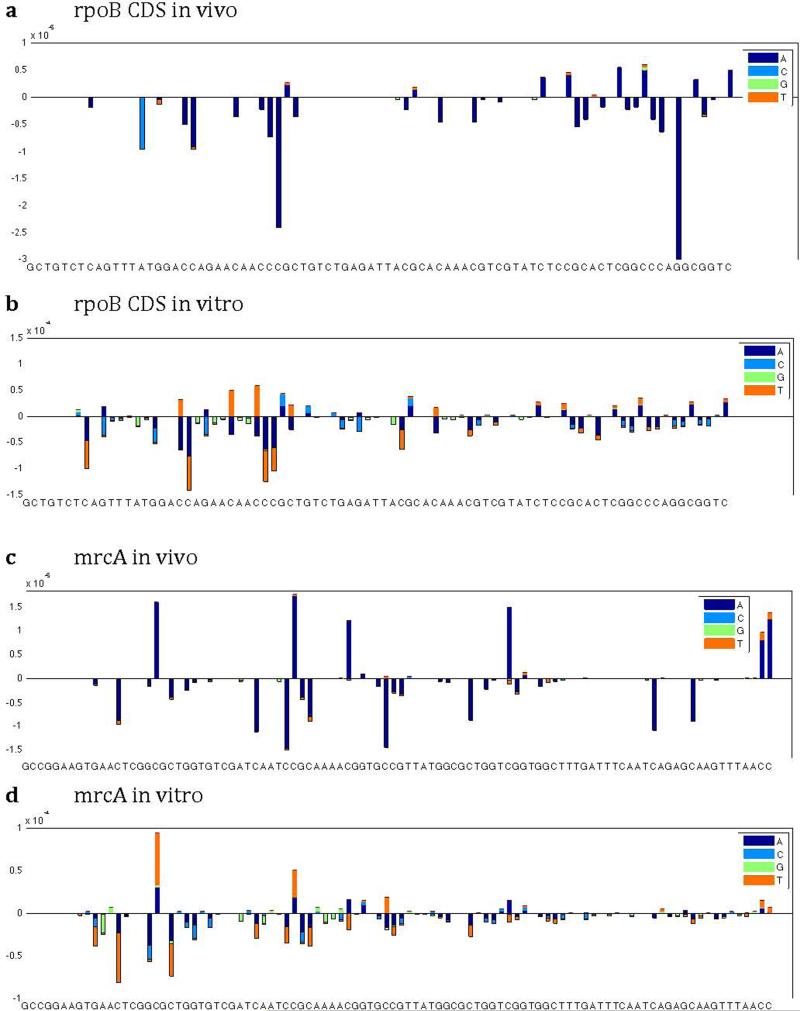
Substitution rates per locus. Positive frequencies denote synonymous substitutions. Negative frequencies denote nonsynonymous substitutions. For (a) and (c), values are averaged across quadruplicate trials. For (b) and (d), in vitro synthesized DNA has undergone 20-cycle PCR amplification using Q5 polymerase.
Extended Data Fig. 5. Mutational spectra and contexts.
a) Substitution frequencies of all ROIs after ~120 generations of growth. Note that values are not normalized for the number of generations and are thus true frequencies, rather than mutation rates. b) Mutation frequencies are shown in context of their 5’ (A, C, G, or T on the x axis) and 3’ (A, C, G, or T on the y axis) neighbors. c) The relative relationship between in vivo substitution frequencies and expected errors due to sequencing and PCR (from in vitro DNA assays) is poorly described by a linear approximation (R2 = 0.27). Furthermore, the recovered frequency from in vivo substitutions (R=3) is higher than the rate of error (equivalent frequencies would be represented by the dotted line), even with the relatively relaxed read-cutoff threshold of R=2 (The sequencing + PCR error with an R=3 cutoff is approximately an order of magnitude lower). Templates are rpoB CDS and mrcA ROIs.
Extended Data Fig. 6.
Comparing substitution rate and indel rate across 5 ROIs reveals a positive correlation (Pearson correlation coefficient = 0.76).
Extended Data Fig. 7.
Rate of rifampicin resistance per generation as calculated in fluctuation assays in (a) WT cells grown in exponential phase only, (b) WT cells grown to saturation, (c) katG overexpression mutant grown to saturation and (d) inactive katG (H106Y point mutation) overexpression mutant grown to saturation. Growth in LB broth was supplemented with possible subinhibitory doses of ampicillin (amp), norfloxacin (nor), or gentamycin (gen). Rates are mean. Error bars are 95% CI. N=25 (see Methods: Fluctuation Assays).
Extended Data Fig. 8.
Transversion (Tv) and transition (Ts) rates (per nucleotide-generation) as calculated in fluctuation assays in (a) anaerobic conditions and (b) in a mutS knockout. Note that because the Ts rate was so high in mutS- strains, Tv mutations could not be detected. Rates are mean. Error bars are 95% CI. N=25 (see Methods: Fluctuation Assays).
Extended Data Fig. 9.
Rates of rpoB and mrcA substitutions in the presence of antibiotics as calculated by MDS. *=Grown separately and prepared with Phusion rather than Q5. Although not shown, we note that only in-frame (3×) indels were observed in rpoB in fluctuation assays, as expected since frameshift indels would be deleterious. These increased in frequency by a factor of 10 on addition of norfloxacin.
Extended Data Fig. 10.
Schematic depicting the mathematical derivation of the false positive rate of MDS due to polymerase error. (a) The origin of various terms used in equations 2-7. (b) Illustration of an example calculation of false positive rate given more “intuitive” values of N, R, and p. The false positive rate is calculated in a way that accounts for the possibility that an error in one or more “linear” cycles propagates to a whole family of reads. The number of reads with an error (k) is Poisson distributed according to equation 2. The probability of a false positive is the sum of the probabilities that all R reads come from one of k families, for all possible k, according to equation 3. Note that in practice, p<10−6, and in our study N=12, R>2, making the false positive rate much lower (see Fig. 1).
Supplementary Material
Acknowledgment
We thank Adriana Heguy and the NYU Genome Technology Center, which is partially supported by the Cancer Center Support Grant, P30CA016087, at the Laura and Isaac Perlmutter Cancer Center. This work utilized computing resources at the High Performance Computing Facility of the Center for Health Informatics and Bioinformatics at the NYU Langone Medical Center. We thank Dan Dwyer and Krishnamurthy Shankarling for materials and Timur Artemyev for his generous contribution. This work was supported by NIH grant R01GM107329 and HHMI (E.N.). J.J. was supported by the NYU Medical Scientist Training Program and a National Defense Science and Engineering Graduate Fellowship.
Footnotes
Author Contributions
J.J. and I.S. designed the MDS protocols. J.J., A.R., and E.N. designed the biological experiments. J.J., A.R., and Y.A. performed the experiments. J.J., B.M., S.S., and I.S. performed the data analysis. J.J. and E.N. wrote the manuscript with input from all coauthors. B.M. and E.N. supervised the research.
The authors declare no competing financial interests.
Availability
Raw sequence data is available from Sequence Read Archive (SRA301985). Code is available from http://github.com/justinjee/MDS and https://github.com/susinmotion/barcode_tries.
References
- 1.Luria SE, Delbrück M. Mutations of Bacteria from Virus Sensitivity to Virus Resistance. Genetics. 1943;28(6):491–511. doi: 10.1093/genetics/28.6.491. [DOI] [PMC free article] [PubMed] [Google Scholar]
- 2.Wielgoss S, et al. Mutation Rate Inferred From Synonymous Substitutions in a Long-Term Evolution Experiment With Escherichia coli. G3 (Bethesda) 2011;1(3):183–6. doi: 10.1534/g3.111.000406. [DOI] [PMC free article] [PubMed] [Google Scholar]
- 3.Lee H, Popodi E, Tang H, Foster PL. Rate and molecular spectrum of spontaneous mutations in the bacterium Escherichia coli as determined by wholegenome sequencing. PNAS. 2012;109(41):E2774–E2783. doi: 10.1073/pnas.1210309109. doi: 10.1073/pnas.1210309109. [DOI] [PMC free article] [PubMed] [Google Scholar]
- 4.Martincorena I, Seshasayee ASN, Luscombe NM. Evidence of nonrandom mutation rates suggests an evolutionary risk management strategy. Nature. 2012;485:95–98. doi: 10.1038/nature10995. [DOI] [PubMed] [Google Scholar]
- 5.Lenski RE, Slatkin M, Ayala FJ. Mutation and selection in bacterial populations: alternatives to the hypothesis of directed mutation. PNAS. 1989;86(8):1775–8. doi: 10.1073/pnas.86.8.2775. [DOI] [PMC free article] [PubMed] [Google Scholar]
- 6.Wielgoss S, et al. Mutation rate dynamics in a bacterial population reflect tension between adaptation and genetic load. PNAS. 2013;110(1):222–7. doi: 10.1073/pnas.1219574110. [DOI] [PMC free article] [PubMed] [Google Scholar]
- 7.Drake JW. Contrasting Mutation Rates from Specific-Locus and Long-Term Mutation-Accumulation Procedures. G3. 2012;2(4):483–485. doi: 10.1534/g3.111.001842. [DOI] [PMC free article] [PubMed] [Google Scholar]
- 8.Kinde I, Wu J, Papadopoulos N, Kinzler KW, Vogelstein B. Detection and quantification of rare mutations with parallel sequencing. PNAS. 2011;108(23):9530–9535. doi: 10.1073/pnas.1105422108. doi: 10.1073/pnas.1105422108. [DOI] [PMC free article] [PubMed] [Google Scholar]
- 9.Minoche AE, Dohm JC, Himmelbauer H. Evaluation of genomic highthroughput sequencing data generated on Illumina HiSeq and Genome Analyzer systems. Genome Biology. 2011;12:R112. doi: 10.1186/gb-2011-12-11-r112. doi: 10.1186/gb-2011-12-11-r112. [DOI] [PMC free article] [PubMed] [Google Scholar]
- 10.Lou DI, et al. High-throughput DNA sequencing errors are reduced by orders of magnitude using circle sequencing. PNAS. 2013;110(49):19872–7. doi: 10.1073/pnas.1319590110. [DOI] [PMC free article] [PubMed] [Google Scholar]
- 11.Schmitt MW, et al. Detection of ultra-rare mutations by next-generation sequencing. PNAS. 2012;109(36):14508–13. doi: 10.1073/pnas.1208715109. [DOI] [PMC free article] [PubMed] [Google Scholar]
- 12.Schmitt MW, et al. Sequencing small genomic targets with high efficiency and extreme accuracy. Nature Methods. 2015 doi: 10.1038/nmeth.3351. doi:10.1038/nmeth.3351. [DOI] [PMC free article] [PubMed] [Google Scholar]
- 13.Acevedo A, Brodsky L, Andino R. Mutational and fitness landscapes of an RNA virus revealed through population sequencing. Nature. 2014;202:686–90. doi: 10.1038/nature12861. [DOI] [PMC free article] [PubMed] [Google Scholar]
- 14.Baba T, et al. Construction of Escherichia coli K-12 in-frame, single-gene knockout mutants: the Keio collection. Molecular Systems Biology. 2006;2006;2:0008. doi: 10.1038/msb4100050. [DOI] [PMC free article] [PubMed] [Google Scholar]
- 15.Taniguchi Y, et al. Quantifying E. coli proteome and transcriptome with single-molecule sensitivity in single cells. Science. 2010;329:533–8. doi: 10.1126/science.1188308. [DOI] [PMC free article] [PubMed] [Google Scholar]
- 16.Garibyan L, et al. Use of the rpoB gene to determine the specificity of base substitution mutations on the Escherichia coli chromosome. DNA Repair. 2003;2(5):593–608. doi: 10.1016/s1568-7864(03)00024-7. [DOI] [PubMed] [Google Scholar]
- 17.Drake JW. A constant rate of spontaneous mutation in DNA-based microbes. PNAS. 1991;88:1760–4. doi: 10.1073/pnas.88.16.7160. [DOI] [PMC free article] [PubMed] [Google Scholar]
- 18.Chen X, Zhang J. No Gene-Specific Optimization of Mutation Rate in Escherichia coli. Mol Biol Evol. 2013;30(7):1559–1562. doi: 10.1093/molbev/mst060. [DOI] [PMC free article] [PubMed] [Google Scholar]
- 19.McDonald MJ, Wang W-C, Huang H-D, Leu J-Y. Clusters of Nucleotide Substitutions and Insertion/Deletion Mutations Are Associated with Repeat Sequences. PLOS Biology. 2011 doi: 10.1371/journal.pbio.1000622. DOI: 10.1371/journal.pbio.1000622. [DOI] [PMC free article] [PubMed] [Google Scholar]
- 20.Zhu L, Wang Q, Tang P, Araki H, Tian D. Genomewide Association between Insertions/Deletions and the Nucleotide Diversity in Bacteria. Mol Biol Evol. 2009;26(10):2353–61. doi: 10.1093/molbev/msp144. [DOI] [PubMed] [Google Scholar]
- 21.Kohanski MA, DePristo MA, Collins JJ. Sub-lethal antibiotic treatment leads to multidrug resistance via radical-induced mutagenesis. Mol Cell. 2010;37(3):311–20. doi: 10.1016/j.molcel.2010.01.003. [DOI] [PMC free article] [PubMed] [Google Scholar]
- 22.Dwyer DJ, et al. Antibiotics induce redox-related physiological alterations as part of their lethality. PNAS. 2014;111(20):E2100–E2109. doi: 10.1073/pnas.1401876111. doi: 10.1073/pnas.1201876111. [DOI] [PMC free article] [PubMed] [Google Scholar]
- 23.Gutierrez A, et al. β-lactam antibiotics promote bacterial mutagenesis via an RpoS-mediated reduction in replication fidelity. Nat Comm. 2013;4:1510. doi: 10.1038/ncomms2607. doi:10.1038/ncomms2607. [DOI] [PMC free article] [PubMed] [Google Scholar]
- 24.Liu Y, Imlay JA. Cell Death from Antibiotics Without the Involvement of Reactive Oxygen Species. Science. 2013;339(6124):1210–3. doi: 10.1126/science.1232751. [DOI] [PMC free article] [PubMed] [Google Scholar]
- 25.Lang GI, Murray AW. Estimating the per-base-pair mutation rate in the yeast Saccharomyces cerevisiae. Genetics. 2008;178(1):67–82. doi: 10.1534/genetics.107.071506. [DOI] [PMC free article] [PubMed] [Google Scholar]
- 26.Pohlhaus JR, Kreuzer KN. Norfloxacin-induced DNA gyrase cleavage complexes block Escherichia coli replication forks, causing double-stranded breaks in vivo. Mol Microbiol. 2005;56(6):1416–29. doi: 10.1111/j.1365-2958.2005.04638.x. [DOI] [PMC free article] [PubMed] [Google Scholar]
- 27.Merrikh H, Zhang Y, Grossman AD, Wang JD. Replicationtranscription conflicts in bacteria. Nat Rev Microbiol. 2012;10(7):449–58. doi: 10.1038/nrmicro2800. [DOI] [PMC free article] [PubMed] [Google Scholar]
- 28.Sangurdekar DP, Srienc F, Khodursky AB. A classification based framework for quantitative description of large-scale microarray data. Genome Biol. 2006;7(4):R32. doi: 10.1186/gb-2006-7-4-r32. [DOI] [PMC free article] [PubMed] [Google Scholar]
- 29.Dutta D, Shatalin K, Epshtein V, Gottseman ME, Nudler E. Linking RNA polymerase backtracking to genome instability in E coli. Cell. 2011;146(4):533–43. doi: 10.1016/j.cell.2011.07.034. [DOI] [PMC free article] [PubMed] [Google Scholar]
- 30.Rosenberg SM. Evolving Responsibly: Adaptive Mutation. Nat Rev Gen. 2001;2:504–14. doi: 10.1038/35080556. [DOI] [PubMed] [Google Scholar]
- 31.Berend D, Tassa T. Improved bounds on Bell numbers and on moments of sums of random variables. Probability and Mathematical Statistics. 2010;30(2):185–205. [Google Scholar]
- 32.Woods RJ, et al. Second-Order Selection for Evolvability in a Large Escherichia coli Population. Science. 2011;331(6023):1433–6. doi: 10.1126/science.1198914. [DOI] [PMC free article] [PubMed] [Google Scholar]
- 33.Datsenko KA, Wanner BL. One-step inactivation of chromosomal genes in Escherichia coli K-12 using PCR products. Proc Natl Acad Sci U S A. 2000;97:6640–5. doi: 10.1073/pnas.120163297. [DOI] [PMC free article] [PubMed] [Google Scholar]
- 34.Sarkar S, Ma WT, Sandri GH. On fluctuation analysis: a new, simple and efficient method for computing the expected number of mutants. Genetica. 1992;85:173–179. doi: 10.1007/BF00120324. [DOI] [PubMed] [Google Scholar]
- 35.Borgström E, et al. Phasing of single DNA molecules by massively parallel barcoding. Nature Communications. 2015;6:7173. doi: 10.1038/ncomms8173. [DOI] [PMC free article] [PubMed] [Google Scholar]
- 36.Maharjan R, Ferenci T. Mutational Signatures Indicative of Environmental Stress in Bacteria. Mol Biol Evol. 2015;32(2):380–391. doi: 10.1093/molbev/msu306. [DOI] [PubMed] [Google Scholar]
- 37.Proshkin S, Rahmouni AR, Mironov A, Nudler E. Cooperation Between Translating Ribosomes and RNA Polymerase in Transcription Elongation. Science. 2010;328(5977):504–8. doi: 10.1126/science.1184939. [DOI] [PMC free article] [PubMed] [Google Scholar]
- 38.Mellon I, Hanawalt PC. Induction of the Escherichia coli lactose operon selectively increases repair of its transcribed DNA strand. Nature. 1989;342:95–8. doi: 10.1038/342095a0. [DOI] [PubMed] [Google Scholar]
Associated Data
This section collects any data citations, data availability statements, or supplementary materials included in this article.


