

Abstract
BACKGROUND
Preterm birth (PTB) is a multifactorial disorder, and air pollution has been suggested to increase the risk of occurrence. However, large population studies controlling for multiple exposure measures in high-density settings with established commuter patterns are lacking.
OBJECTIVE
We performed a geospatial analysis with the use of a publicly available database to identify whether residence during pregnancy, specifically with regard to exposure to traffic density and mobility in urban and suburban neighborhoods, may be a contributing risk factor for premature delivery.
STUDY DESIGN
In our cohort study, we analyzed 9004 pregnancies with as many as 4900 distinct clinical and demographic variables from Harris County, Texas. On the basis of primary residency and occupational zip code information, geospatial analysis was conducted. Data on vehicle miles traveled (VMT) and percentages of inhabitants traveling to work were collected at the zip code level and additionally grouped by the three recognized regional commuter loop high-density thoroughfares resulting from two interstate/highway belts (inner, middle, and outer loops). PTB was categorized as late (34 1/7 to 36 6/7 weeks) and early PTB (22 1/7 to 33 6/7 weeks), and unadjusted odds ratios (OR) and adjusted ORs were ascribed.
RESULTS
PTB prevalence in our study population was 10.1% (6.8% late and 3.3% early preterm), which is in accordance with our study and other previous studies. Prevalence of early PTB varied significantly between the regional commuter loop thoroughfares [OR for inner vs outer loop: 0.58 (95% confidence interval, 0.39–0.87), OR for middle vs outer loop, 0.74 (0.57–0.96)]. The ORs for PTB and early PTB were shown to be lower in gravidae from neighborhoods with the highest VMT/acre [OR for PTB, 0.82 (0.68–0.98), OR for early PTB, 0.78 (0.62–0.98)]. Conversely, risk of PTB and early PTB among subjects living in neighborhoods with a high percentage of inhabitants traveling to work over a greater distance demonstrated a contrary tendency [OR for PTB, 1.18 (1.03–1.35), OR for early PTB, 1.48 (1.17–1.86)]. In logistic regression models, the described association between PTB and residence withstood and could not be explained by differences in maternal age, gravidity or ethnicity, tobacco use, or history of PTB.
CONCLUSION
While PTB is of multifactorial origin, the present study shows that community-based risk factors (namely urban/suburban location, differences in traffic density exposure, and need for traveling to work along highevehicle density thoroughfares) may influence risk for PTB. Further research focusing on previously unrecognized community-based risk factors may lead to innovative future prevention measures.
Keywords: geospatial analysis, neighborhood, pregnancy outcome, preterm birth, traffic density exposure
Preterm birth is a leading cause of neonatal mortality and morbidity and is an important contributor to the global burden of disease.1,2 Incidences of preterm birth (PTB) vary remarkably among different countries, exhibiting a PTB rate approximating 11% to 12% in the United States and about 5% to 9% in similarly developed nations.3 Both short- and long-term sequelae such as respiratory distress, apnea, and kernicterus but also long-term consequences (ie, cerebral palsy, chronic lung disease, and visual impairment) occur frequently in conjunction with PTB and contribute to high incurred cost burdens in care.1–7 There are multiple known clinical risk factors for PTB, the most predictive of which is a history of PTB.1,8–12 Measures that have been found to be preventive of PTB include antenatal progesterone administration for the prevention of recurrent PTB,13,19 smoking cessation,8,14–16 and cervical cerclage in limited subject cohorts.1,13,17 However, none of these risk factors (alone or in combination) sufficiently explain the disparity in rates observed among similarly developed nations (ie, prevalence and incidence comparisons between the United States. and others).
Interestingly, exposure to air pollution has been associated with PTB as well as other adverse pregnancy outcomes,1,14–16,18,19 and traffic noise (largely a surrogate for ambient exposure measures) has been shown to be associated with lower birth weight.17,20 The influence of traffic and traffic-related air pollution on PTB remains controversial.1,18,19,21 Emissions of hazardous air pollutants from mobile sources and their fuels are termed “Mobile Source Air Toxics (MSATs)” by the EPA. As a general rule, high–population density regions of the United States with significant commuter distances and few mass transit options (eg, train, subway, bus, or bike routes) have significantly higher rates of exposure.17,18 Moreover, many of the MSATs are found in combustible tobacco, and maternal smoking is a well-known risk factor for PTB in all populations studied to date.1
We hypothesized that geospatial coding in the third most populous county in the United States (Harris County), which also currently lacks a broadly distributed low emission mass transit system, could be used to investigate the potential association between ambient exposures and PTB. Our aim was to describe the effect of ambient traffic exposure on preterm birth by applying geospatial analysis to a county wide health system (Harris Health System, Harris County) with a designated delivery hospital. For this purpose, we used a population-wide emissions database in combination with our robust perinatal database, allowing us to evaluate the presence of vehicular traffic and prevalence of preterm birth in different neighborhoods. As a result of today’s mobility, we considered that inhabitants will be exposed to different traffic density values while both living in and traveling through a community, for example, to work. We therefore used validated measures of traffic densities (ie, in zip code areas or neighborhoods and along thoroughfares), which are approximated by the determination of vehicle miles traveled (VMT) with vehicle traffic counts and road length.20,22,23
Materials and Methods
Subjects and specimens
For this study, we used PeriBank, a perinatal database curated by Baylor College of Medicine (IRB No. H-26364; H-33382). At the time of admission, gravidae were enrolled by skilled Peri-Bank personnel after written informed consent was obtained. Up to 4900 variables of clinical data were sought from the electronic medical record, prenatal records, and by in-person interview. The quality of the data was ascertained by regular verification of a subset of the inserted clinical data and by a board-certified maternal-fetal medicine physician scientist (K.A.) as previously published.24 Clinical data that were extracted for this study comprise the patient history (including smoking status, nicotine and substance use, and familial obstetrical history and prenatal care clinics and providers), socioeconomic status (education, income, immigration status), and residential and workplace data (each trimester of pregnancy residence and workplace 5-digit zip code). Not all 4900 potential Peri-Bank variables were used in this analysis.
Inclusion criteria
Subjects included in the current study were enrolled in our PeriBank database between August 2011 and December 2014 (n = 10,812). Exclusion criteria included gravidae with twin pregnancies (n = 604), pregnancies without delivery at the current hospital (n = 32), and those missing information on validated zip code information (n = 648) and/or a residential zip code outside of Harris County (n = 524).
Data sources for geospatial analysis
The Environmental Health Service at Baylor College of Medicine provided the dataset on traffic density on zip code basis for Harris County. To calculate traffic densities in different zip codes, vehicle miles of travel (VMT) per acre were determined by measuring the emergence of daily traffic in a road segment and subsequently summing all segments that belong to a zip code (Figure 1B). VMT measurements were conducted by the Houston-Galveston Area Council and have been previously validated. To acquire information on percentages of workers of zip code areas in Harris County that commute to work by car, truck, or van, we used a publicly available data source, the “American Fact Finder” of the United States Census Bureau. This database includes information from the 2009–2013 American Community Survey (inclusive of both documented and non-documented residents) and offers estimates on the percentage of workers who commute to work by car, truck, or van for each zip code within Harris County.
FIGURE 1. Geographical distribuation of VMT, early PTB, PTB, and commuter loop thoroughfares.
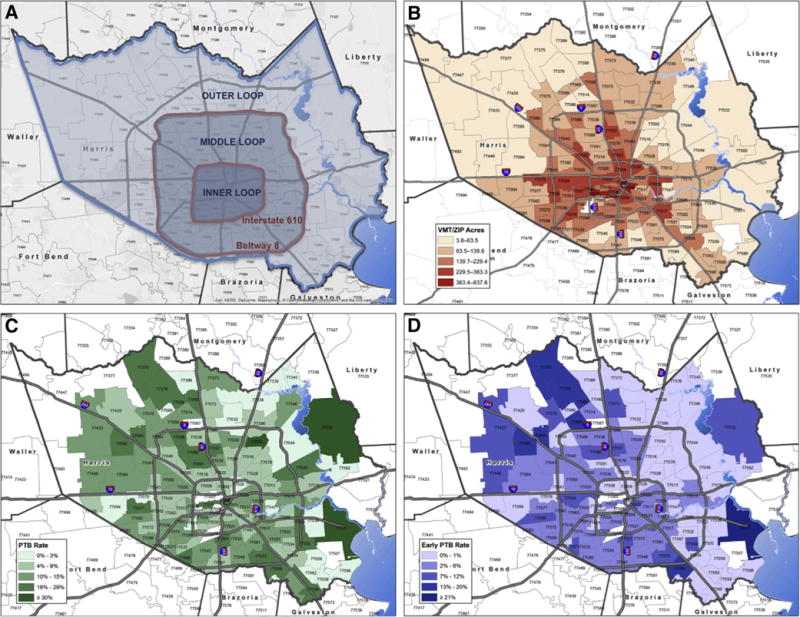
A, Map shows commuter loop thoroughfares of Harris County; B, map reveals VMT; C, PTB rates; and D, early PTB rates on zip code level within Harris County, assembled by ArcGIS 10.3 Desktop Advance.
VMT, vehicle miles traveled; PTB, preterm birth.
Besides the City of Houston, Harris County comprises smaller incorporated townships and cities, such as West University, Bellaire, and Pasadena, and has 230 listed zip codes. Of those, only 132 represent areas of residency, whereas the residual zip codes are company zip codes or post office boxes. In daily life, inhabitants of certain zip codes would cross zip code area borders to conduct their grocery shopping, dining, health-care appointments, educational and recreational activities, and commuting to work.21,25 Because zip code areas of Harris County vary substantially in size, we applied the established “buffer” technique with the aim of establishing comparable residential areas, defined as “neighborhoods.” This validated described approach is commonly used with the aim of calculating various densities (ie, supermarkets, traffic, hospitals) within reach of residence.22,23,26 These neighborhoods consist of the sum of a central zip code and every adjacent zip code it is surrounded by. The described buffer approach has been conducted manually for every single zip code within Harris County, by means of up-to-date zip code maps. This enabled us to estimate traffic exposure within neighborhoods of Harris County.
With the objective of illustrating regional commuter loop thoroughfares, Harris County is subdivided into recognized inner (central-urban) and outer (urban and suburban) areas, reflecting proximity to the city center of Houston. This approach results in three loops, divided by two major highways (Interstate 610 and Beltway 8): inner loop (central-urban core), middle loop (urban), and outer loop (suburban) (Figure 1 A). These reflect both geographical and common colloquial boundaries, whereby residents are described as living “in the loop.”
“Traffic density” is defined as VMT per acre values of discrete residential areas of Harris County. Throughout the article the term “ambient traffic exposure” is used to reflect the total traffic exposure of individuals living in Harris County, which includes commute distance within the city as well as residence. Therefore the term “ambient traffic exposure” takes into account the condition that an individual can be exposed to several of areas of different traffic densities. Collected information on VMT and percentage of inhabitants traveling to work was allocated to our patients by first trimester residential zip code as a surrogate of total exposure for the duration of the pregnancy.
Statistical analysis
All clinical and demographic data for pregnancies enrolled into our study were obtained from PeriBank. Data processing and statistical analyses of the data was conducted with SPSS (version 22, New York, IBM). Characterization of clinical, demographic and environmental variables was performed with the use of descriptive statistics. Values are given as frequencies or median (interquartile range). We used the Kolmogorov-Smirnov test to examine the distribution of our variables. Because all continuous variables were non-normally distributed, we applied non-parametric statistical tests for bivariate analyses. Crude odds ratios for preterm occurrence in conjunction with environmental variables were calculated. The variables used (ie, VMT) were compared between quartiles (highest vs lowest quartile) and between below versus above median. To identify potentially confounding variables, candidates (as identified on univariate or bivariate analysis) were tested in a multivariate logistic regression model, using forward selection. The following factors were identified as confounders: prior PTB, maternal tobacco use, race/ethnicity, gravidity, and maternal age. For calculating adjusted odds ratios, we subsequently corrected for the confounding variables. For denotation of significance, P < .05 was accepted and values are shown as median (interquartile range, IQR) or as count (percentage), respectively.
Results
Study population
This cohort study on clinical, environmental, and residential data included 9004 subjects (gravidae) from August 2011 through December 2014. Table 1 displays demographic data of our study cohort, stratified by preterm categories. Our study population exhibited a median age of 29.34 years (IQR, 24.36–33.96) and is primarily of white Hispanic origin (69.5%), followed by white, non-Hispanic patients (16.1%), African Americans (10.7%), Asians (3.4%), Hawaiian/Pacific Islanders (0.2%), and Native Americans (0.1%). The majority of our subjects had no high school degree (58.1%), earned less than $34,999 per year (95.2%), and had a median gravidity of 3 (range, 2–4) while being, on average, overweight in the first trimester (median, 27.31 kg/m2 [23.7–31.62]). Similar to other national estimates,14–17,24–27 10.1% of all births were preterm, with 6.8% of those were late PTB, and 3.3% were early PTB. Table 2 summarizes additional clinical information on our patients. Concordant with national estimates, 9.4% of the overall study population had hypertensive disease(s), including preeclampsia (8.6%), with rarity of eclampsia and HELLP (hemolysis, elevated liver enzymes and low platelet count – syndrome) (0.1% or less). The majority of subjects delivered vaginally [spontaneous vaginal (72.1%), operative vaginal (1.3%)], with a significant minority of cesarean (26.5%) and rarity of cesarean with hysterectomy (0.2%). Consistent with ours being a primary delivery hospital for our county population, subjects were rarely transported (fewer than 2 per month in total for all indications) with an indication of impending PTB, and the median number of prenatal visits among all subjects was 9 (median IQR, 4–12). As anticipated, although the number of prenatal visits differed by virtue of gestational age attained, there was no significant difference in number of prenatal visits by traffic loop designation or maternal transport status. We found the following differences between preterm and term categories in univariate analysis: maternal age (P < .001), 1st trimester BMI (P <.001), and ethnicity (P =.006), and these were controlled for in multivariate models.
TABLE 1.
Demographics
| Total | Preterm | Early preterm | Late preterm | Term | Preterm vs term | Early preterm vs term | Late preterm vs term | Early preterm vs late preterm | |
|---|---|---|---|---|---|---|---|---|---|
| Median (IQR) or % | Significance of differencea | ||||||||
| Number (n) | 9004 | 916 | 301 | 615 | 8088 | ||||
| Maternal age (years) | 29.3 (24.4–33.9) | 30.4 (24.6–35.5) | 31.4 (25.8–35.7) | 29.9 (24.2–35.2) | 29.3 (24.3–33.8) | P < .001 | P < .001 | P = .077 | P = .068 |
| Gravidity | 3 (2–4) | 3 (2–4) | 3 (2–5) | 3 (2–4) | 3 (2–4) | P = .063 | P = .02 | P = .792 | P = .048 |
| BMI (1st trimester) | 27.3 (23.7–31.6) | 28.1 (24.7–32.8) | 28.5 (25.0–32.8) | 28.3 (24.6–32.9) | 27.3 (23.6–31.5) | P < .001 | P = .017 | P = .001 | P = .922 |
| Ethnicity (%) | |||||||||
| Hispanic | 69.5% | 68.0% | 64.0% | 70.1% | 69.8% | P = .006 | P = .001 | P = .828 | P = .007 |
| Non-Hispanic | 30.5% | 32.0% | 36.0% | 29.9% | 30.2% | ||||
| African American (%, n) | 10.7% (n = 954) | 11.0% (n = 100) | 10% (n = 30) | 11.4% (n = 70) | 10.6% (n = 854) | P = .773 | P = .715 | P = .550 | P = .514 |
| Education (%) | |||||||||
| Less than high school | 58.1% | 59.8% | 53.5% | 62.6% | 57.9% | P = .214 | P = .702 | P = .078 | P = .129 |
| High school/GED | 27.5% | 25.7% | 31.5% | 23.0% | 27.7% | ||||
| Some college | 6.6% | 8.0% | 7.0% | 8.4% | 6.4% | ||||
| College degree | 5.8% | 4.7% | 5.0% | 4.6% | 5.9% | ||||
| Masters degree | 1.3% | 1.1% | 2.0% | 0.7% | 1.3% | ||||
| PhD or professional degree | 0.8% | 0.8% | 1.0% | 0.7% | 0.8% | ||||
| Income per year | |||||||||
| <$34,999 | 95.2% | 95.3% | 93.6% | 96.2% | 95.2% | P = .664 | P = .645 | P = .487 | P = .330 |
| $35,000–74,999 | 3.1% | 3.3% | 4.1% | 3.0% | 3.1% | ||||
| ≥$75,000 | 1.7% | 1.4% | 2.3% | 0.9% | 1.8% | ||||
Demographic characteristics of the study population are stratified by preterm birth categories.
BMI, body mass index.
Significance of difference was derived by χ2 or Kruskal-Wallis/Mann-Whitney U test as appropriate.
TABLE 2.
Clinical characteristics
| Clinical characteristics | Total | Preterm | Early preterm | Late preterm | No preterm | Preterm vs no preterm | Early preterm vs no preterm | Late preterm vs no preterm | Early preterm vs late preterm |
|---|---|---|---|---|---|---|---|---|---|
| Median (IQR) or % | χ2 or Kruskal-Wallis/Mann-Whitney U test | ||||||||
| Number (n) | 9004 | 916 | 301 | 615 | 8088 | 9004 | 8389 | 8703 | 916 |
| Chorioamnionitis (%) | 0.2% | 0.2% | 0.3% | 0.2% | 0.2% | P = .837 | P = .567 | P = .898 | P = .605 |
| IUGR | 0.7% | 1.6% | 0.7% | 2.1% | 0.6% | P < .001 | P = .898 | P < .001 | P = .104 |
| Hypertensive disease | 9.4% | 10.9% | 9.7% | 11.5% | 9.3% | P < .001 | P < .001 | P < .001 | P = .007 |
| Preeclampsia | 8.6% | 27.9% | 34.8% | 24.5% | 6.4% | ||||
| Eclampsia | 0.1% | 0.1% | 0.3% | 0.5% | 0.1% | ||||
| HELLP syndrome | 0.1% | 0.7% | 1.0% | 0% | 0% | ||||
| Prenatal visits | 9 (4–12) | 6 (0–10) | 4 (0–8) | 8 (2–10) | 10 (5–12) | P < .001 | P < .001 | P < .001 | P< .001 |
| Prior PTB | 0.4% | 1.0% | 2.6% | 0.2% | 0.3% | P = .004 | P < .001 | P = .724 | P = .003 |
| Birthweight, g (range, g) | 3300 (2975–3620) | 2437.5 (1943.8–2828.5) | 1665 (1230–2070) | 2670 (2370–2960) | 3355 (3070–3655) | P < .001 | P < .001 | P < .001 | P< .001 |
| Weight gain category | |||||||||
| Insufficient | 28.4% | 32.8% | 38.9% | 30.0% | 28.0% | P = .006 | P = .001 | P = .660 | P = .017 |
| Goal | 25.0% | 23.3% | 23.8% | 23.2% | 25.1% | ||||
| Excessive | 46.6% | 43.9% | 37.3% | 46.8% | 46.9% | ||||
| PROM | 0.4% | 1.4% | 1.3% | 1.5% | 0.2% | P < .001 | P < .001 | P < .001 | P = .872 |
| Tobacco use | 0.9% | 1.4% | 3.0% | 0.7% | 0.8% | P = .058 | P < .001 | P = .686 | P = .006 |
| Delivery route | |||||||||
| Vaginal | 72.1% | 70.2% | 67.8% | 71.3% | 72.3% | P = .410 | P = .306 | P = .424 | P = .668 |
| Operative vaginal | 1.3% | 1.0% | 1.3% | 0.8% | 1.3% | ||||
| Cesarean | 26.5% | 28.5% | 30.6% | 27.5% | 26.3% | ||||
| Cesarean hysterectomy | 0.2% | 0.3% | 0.3% | 0.3% | 0.1% | ||||
Major clinical characteristics are shown (ie, preeclampsia, tobacco use, birthweight).
IUGR, intrauterine growth restriction; HELLP, hemolysis, elevated liver enzymes and low platelets syndrome PTB, preterm birth; PROM, premature rupture of membranes.
VMT measures and percentage of inhabitants traveling to work
Table 3 demonstrates the VMT per acre distribution within neighborhoods and zip code areas of Harris County, as well as percentages of inhabitants traveling to work. Additionally, Table 3 provides information on the amount of patients (in percentage) living in the three different loops of Harris County. Less than 5% relocated during their pregnancy, as determined by patient-provided zip code data for both work and residence by each trimester. Traffic density, measured in VMT per acre, is highest in the inner loop of Harris County, which embraces the city center (downtown Houston and the Texas Medical Center, which independently employs approximately 150,000 individuals26,27). The middle loop has less traffic density and the same is true for the outer loop, meaning that VMT decreases significantly when traveling from the city center toward suburban areas of Harris County (245.02 vs 186.64 vs 122.16 VMT per acre; P < .001). A contrary trend can be observed in the percentage of inhabitants traveling to work by car, van or truck. Significantly more inhabitants travel to work in the outer (P < .001) and middle loops (P < .001) when compared with the inner loop. There is a single mass transit service (Metro Line), which connects down-town Houston to the Texas Medical Center but does not service the middle or outer loop nor residential communities. In addition, the metropolitan bus service largely connects middle and inner loop communities (http://www.ridemetro.org/Pages/SchedulesBusRail.aspx).
TABLE 3.
Traffic environmental exposures
| Total | Preterm | No preterm | Early preterm | Late preterm | |
|---|---|---|---|---|---|
| Median (IQR) or % | |||||
| Traffic environmental variables | |||||
| VMT per acre | |||||
| Individual zip codes | 177.67 (105.16–222.72) | 168.96 (99.8–211.93)a | 178.62 (105.16–222.72) | 162.35 (95.36–211.93)a | 172.20 (99.9–222.15)a |
| Neighborhoods | 184.54 (138.41–235.64) | 181.17 (133.33–235.64) | 184.93 (138.94–235.64) | 174.16 (131.75–235.64)a | 184.61 (134.55–235.64) |
| % Traveling to work | |||||
| Individual zip codes | 87.27% (85.14–90.14%) | 87.35% (85.14–91.51%) | 87.26% (85.14–90.14%) | 87.68% (85.21–91.51%) | 87.19% (85.14–91.29%) |
| Neighborhoods | 87.96% (86.05–89.82%) | 88.16% (86.84–90.02%)a | 87.94% (86.05–89.49%) | 88.37% (86.85–90.20%)a | 88.07% (86.11–90.02%) |
| Loops | |||||
| Outer loop | 22.2% | 23.4% | 22.1% | 28.6%a | 20.8% |
| Middle loop | 62.6% | 63.3% | 62.5% | 59.8%a | 65.0% |
| Inner loop | 15.2% | 13.3% | 15.4% | 11.6%a | 14.1% |
Overview of environmental traffic exposure (VMT, % traveling to work, loops) in different preterm birth categories are shown. PTB, preterm birth; VMT, vehicle miles traveled.
Significant differences vs no PTB, based on Mann-Whitney U test or χ2 test.
Association between ambient vehicular exposure/VMT and PTB
When comparing lowest with highest VMT quartiles of PTB pregnancies with control pregnancies, women who have been living in a neighborhood with high VMTexposure exhibit a lower odds ratio (OR) for delivering preterm [OR, 0.82 (0.68–0.98); adjusted OR (aOR), 0.81 (0.68–0.97)] (Table 4). The OR for PTB when living in neighborhoods above the median VMT exposure, compared with below the median VMT exposure shows the same tendency but is not significant [OR, 0.92 (0.8–1.05); aOR, 0.92 (0.80–1.06)]. Odds ratios for delivering early preterm when living in a neighborhood above the median VMT exposure to below the median exhibit a decreased risk of early PTB [OR, 0.78 (0.62–0.98); aOR, 0.78 (0.62–0.99)]. The same trend is seen when looking at the OR for living in a neighborhood in the highest VMT exposure quartile, without being significant [OR, 0.75 (0.55–1.0); aOR, 0.76 (0.56–1.03)]. The risk of PTB was significantly increased in neighborhoods with an above-median percentage of people traveling to work [OR, 1.18 (1.03–1.35); aOR, 1.17 (1.02–1.34)]. The same was true for the risk for delivering early preterm [OR, 1.48 (1.17–1.86); aOR, 1.51 (1.19–1.91)].
TABLE 4.
Associations between traffic exposure and PTB
| Odds ratio | ||||||||
|---|---|---|---|---|---|---|---|---|
| Preterm v no preterm | Early preterm vs no preterm | |||||||
| Unadjusted OR (95% CI) | Adjusted OR (95% Cl)a | Unadjusted OR (95% CI) | Adjusted OR (95% Cl)a | |||||
| >Median vs <median | Highest quartile vs lowest quartile | >Median vs <median | Highest quartile vs lowest quartile | >Median vs <median | Highest quartile vs lowest quartile | >Median vs <median | Highest quartile vs lowest quartile | |
| Traffic environmental variables | ||||||||
| VMT per acre | ||||||||
| Neighborhoods | 0.92(0.8–1.05) | 0.82 (0.68–0.98) | 0.92 (0.80–1.06) | 0.81 (0.68–0.97) | 0.78 (0.62–0.98) | 0.75 (0.55–1.0) | 0.78 (0.62–0.99) | 0.76(0.56–1.03) |
| % Traveling to work | ||||||||
| Neighborhoods | 1.18(1.03–1.35) | 1.45 (0.95–1.39) | 1.17(1.02–1.34) | 1.15(0.95–1.4) | 1.48(1.17–1.86) | 1.22 (0.89–1.68) | 1.51 (1.19–1.91) | 1.27(0.92–1.76) |
| Loops | ||||||||
| Outer loop | REF | REF | REF | REF | ||||
| Middle loop | 0.958(0.81–1.13) | 0.98(0.82–1.16) | 0.74 (0.57–0.96) | 0.79(0.60–1.03) | ||||
| Inner loop | 0.82 (0.60–1.03) | 0.85 (0.67–1.08) | 0.58 (0.39–0.87) | 0.59 (0.39–0.89) | ||||
Odds ratios (OR) depict how living in a neighborhood or within a certain loop within Harris County is associated with a higher probability of delivering preterm. For the calculation of ORs based on commuter loop thoroughfares, the outer loop was used as a reference category (REF).
Results of adjusted odds ratios (aOR) were corrected for maternal age, gravidity, race/ethnicity, tobacco use, and history of PTB.
Distance to centroid and PTB
We found that differences in odds ratios for early PTB were also existent between the three regional commuter loop thoroughfares. Prevalence of early/total PTB was 4.3%/10.7%, 3.2%/10.3%, and 2.5%/8.9% in the outer, middle, and inner loops, respectively. Table 4 illustrates that the OR and aOR for delivering early preterm among gravidae residing in the inner loop [OR, 0.58 (0.39–0.87); aOR, 0.59 (0.39–0.89)] and middle loop [OR, 0.74 (0.57–0.96); aOR, 0.79 (0.60–1.03)] when compared with residency in the outer loop, a “suburban” area. As indicated, these findings persisted after correcting for race/ethnicity, mother’s age, history of PTB, tobacco smoking, and gravidity.
Comment
In the current study, we found that residency in neighborhoods with high traffic density, measured in VMT per acre, does not increase the risk for PTB. However, odds ratios for early PTB were shown to be significantly increased in suburban areas, where a higher percentage of inhabitants travel to work by car, van, or truck but where traffic density was lowest. The odds ratio for PTB was significantly lowest among gravidae residing in neighborhoods with high traffic density and where fewer inhabitants travel longer distances to work.
Previous studies have primarily focused on the potential impact of exposure to specific air pollutants on the rate of PTB. Overall, these studies found that exposure to local air pollution during pregnancy trended toward a higher risk for delivering preterm.14,15,17,28–30 Consistent with a potential causal relationship, a reduction in exposure to air pollution caused by increased use of public transport resulted in fewer cases of PTB.27,31 The reduced odds for PTB in neighborhoods with high traffic density (inner loop) that we found in our study is of noted interest, given the finding of these prior studies. Our observations are consistent insomuch as time spent in traffic during peak commuter hours, and not residence per se, has been found to determine the individual exposure to traffic-related air pollution.28,32 In the Houston metropolitan region, significantly higher percentages of inhabitants who live in suburban areas (outer loop) travel to work, and traffic density increases toward the inner urban region, where the majority of the study population worked. Because of well-described thoroughfares and absence of suburban-to-urban mass transit options, our data are reliable and consistent with the long-standing observation that the suburban population exhibits a higher mobility and therefore is exposed to more time in commute traffic and its potential consequences, significantly so when compared with gravidae in the city center, with shorter commuting distances. Our findings demonstrating increased odds for delivering early preterm in the suburban (outer loop) and urban areas (middle loop) of Harris County support other investigators’ observations in similar settings.31,33
Since suppositions between VMT and health outcomes are generally assumed to result from exposure to air pollutants, longer and cumulative time spent in traffic probably represents a higher concentration of exposures.32,34,35 Gehring et al33,36 demonstrated that birthweight was affected by exposure as measured by “noise.” Other recent studies have concluded that noise exposure during pregnancy may be an additional stressor rendering psychological and physiological stress and resulting in cumulative adverse pregnancy outcomes.34,35,37 Although our study cannot distinguish between the impact of noise per se and concentration of exposure, our finding that VMT as a function of distance traveled provided the greatest risk of PTB and early PTB suggests a causal relationship as a function of dose response.
Despite our large sample size, our study has limitations. First, our geospatial resolution is limited to zip code data. This is in accordance with our IRB-approved protocol and is done to protect subject identification. Hence, we were not able to calculate distances to major highways from exact patient addresses as prior studies have conducted36 and cannot rule out differences between patients living within the same zip code. Also, individual subjects were not surveyed for their mode of transportation and estimated time spent in traffic (ie, day versus night shift work, auto versus bus commute, or use of carpool lanes reducing time spent in traffic, daily errands due to distance to city center) and for their job types (ie, prolonged sitting or standing). Furthermore, the studied patient population primarily consisted of white Hispanic women, who had an average lower income and education level and therefore belonged to a largely underserved social stratum. Although our findings might not be generally applicable to other counties and its populations, they are applicable to the greater majority of subjects who have a PTB. Moreover, given the long-standing associations between health disparities and environmental justice, this may be regarded similarly as a strength.37
In addition to these potential weaknesses, it remains a formal possibility that our findings are biased by virtue of preterm subject referral to the delivery hospital. In other words, those residing in the outer loops might be more likely to be referred for PTB to our large tertiary center and thus would represent an ascertainment bias. However, we attempted to control for this in several manners. First, the utilization of the Harris Health System clinics was equivalent, and numbers of prenatal care visits did not vary significantly among subjects by virtue of zip code nor loop assignment. Second, subjects with PTB would be more likely to present to their most proximal hospital, which would have biased the rate of PTB in the opposite direction from what was observed. Third, VMT withstood as an independent measure and adjusted analysis controlling for confounders supported our observations. Fourth, our findings were specific for PTB and did extend to other indications for subject transport. Fifth, fewer than two maternal transports per month for any indication occurred at our institution over the study interval.
In summary, we used a validated approach with rigorous design in a unique populous amenable to our means of interrogation with the aim of identifying a potential association of regional commuter loop thoroughfares with PTB. Our findings demonstrate that residence in connection with exposure to different traffic measures may result in higher or lower odds for PTB, with the weighted risk toward commuter distance across high VMT exposures. Whereas further research is required for a deeper understanding of the interactions between ambient traffic exposure and pregnancy outcome, the present data may allow us and other investigators focus such directed analysis in future studies. Moreover, it lends to an increasing body of evidence suggesting that risk of PTB is not merely a reflection of maternal history, genetic, or comorbidities but rather reflects environmental exposures. Given the potential for modification of environmental factors, future investigations identifying underlying molecular mechanisms rendering risk of PTB will be of additional importance and probably high significance.
Acknowledgments
The authors thank the PeriBank data coordinators and staff and acknowledge the support of our funding agencies.
Supported by the DFG (German Research Foundation, SA 2795/2-1) to M.K.K. and by the NIH (grant No. R01NR014792 to K.M.A) and the March of Dimes Prematurity Research Initiative (K.M.A.).
Footnotes
The authors report no conflict of interest.
Presented as abstract #F-086 at the 62nd Annual Meeting of the Society for Reproductive Investigation; March 25 to 28, 2015, San Francisco, California.
References
- 1.Chang HH, Larson J, Blencowe H, Spong CY, Howson CP, Cairns-Smith S, et al. Preventing preterm births: analysis of trends and potentialreductions with interventions in 39 countries with very highhuman development index. Lancet. 2013;381:223–34. doi: 10.1016/S0140-6736(12)61856-X. [DOI] [PMC free article] [PubMed] [Google Scholar]
- 2.Blencowe H, Cousens S, Oestergaard MZ, Chou D, Moller A-B, Narwal R, et al. National, regional, and worldwide estimates of preterm birth rates in the year 2010 with time trends since 1990 for selected countries: a systematic analysis and implications. Lancet. 2012;379:2162–72. doi: 10.1016/S0140-6736(12)60820-4. [DOI] [PubMed] [Google Scholar]
- 3.Goldenberg RL, Culhane JF, Iams JD, Romero R. Epidemiology and causes of preterm birth. Lancet. 2008;371:75–84. doi: 10.1016/S0140-6736(08)60074-4. [DOI] [PMC free article] [PubMed] [Google Scholar]
- 4.Profit J, Lee D, Zupancic JA, Papile L, Gutierrez C, Goldie SJ, et al. Clinical benefits, costs, and cost-effectiveness of neonatal intensive care in Mexico. PLoS Med. 2010;7:e1000379. doi: 10.1371/journal.pmed.1000379. [DOI] [PMC free article] [PubMed] [Google Scholar]
- 5.Saigal S, Doyle LW. An overview of mortality and sequelae of preterm birth from infancy to adulthood. Lancet. 2008;371:261–9. doi: 10.1016/S0140-6736(08)60136-1. [DOI] [PubMed] [Google Scholar]
- 6.Heaman M, Kingston D, Chalmers B, Sauve R, Lee L, Young D. Risk factors for preterm birth and small-for-gestational-age births among Canadian women. Paediatr Perinat Epidemiol. 2012;27:54–61. doi: 10.1111/ppe.12016. [DOI] [PubMed] [Google Scholar]
- 7.Johnson TJ, Patel AL, Jegier BJ, Engstrom JL, Meier PP. Cost of morbidities in very low birth weight infants. J Pediatr. 2013;162:243–9.e1. doi: 10.1016/j.jpeds.2012.07.013. [DOI] [PMC free article] [PubMed] [Google Scholar]
- 8.Ion R, Bernal AL. Smoking and preterm birth. Reprod Sci. 2014;22:918–926. doi: 10.1177/1933719114556486. [DOI] [PubMed] [Google Scholar]
- 9.Dodd JM, Jones L, Flenady V, Cincotta R, Crowther CA. Prenatal administration of progesterone for preventing preterm birth in women considered to be at risk of preterm birth. Cochrane Database Syst Rev. 2013;(7):CD004947. doi: 10.1002/14651858.CD004947.pub3. [DOI] [PMC free article] [PubMed] [Google Scholar]
- 10.Khatibi A, Brantsaeter AL, Sengpiel V, Kacerovsky M, Magnus P, Morken NH, et al. SMFM Papers. Am J Obstet Gynecol. 2012;207:212.e1–7. doi: 10.1016/j.ajog.2012.06.002. [DOI] [PubMed] [Google Scholar]
- 11.Saurel-Cubizolles MJ. Employment, working conditions, and preterm birth: results from the Europop case-control survey. J Epidemiol Community Health. 2004;58:395–401. doi: 10.1136/jech.2003.008029. [DOI] [PMC free article] [PubMed] [Google Scholar]
- 12.Farkash E, Weintraub AY, Sergienko R, Wiznitzer A, Zlotnik A, Sheiner E. Eur J Obstet Gynecol Reprod Biol. 2012;162:24–7. doi: 10.1016/j.ejogrb.2012.01.024. [DOI] [PubMed] [Google Scholar]
- 13.Owen J, Hankins G, Iams JD, Berghella V, Sheffield JS, Perez-Delboy A, et al. Multicenter randomized trial of cerclage for preterm birth prevention in high-risk women with shortened midtrimester cervical length. Am J Obstet Gynecol. 2009;201:375.e1–8. doi: 10.1016/j.ajog.2009.08.015. [DOI] [PMC free article] [PubMed] [Google Scholar]
- 14.Wu J, Ren C, Delfino RJ, Chung J, Wilhelm M, Ritz B. Association between local traffic-generated air pollution and preeclampsia and preterm delivery in the south coast air basin of California. Environ Health Perspect. 2009;117:1773–9. doi: 10.1289/ehp.0800334. [DOI] [PMC free article] [PubMed] [Google Scholar]
- 15.Ritz B, Wilhelm M, Hoggatt KJ, Ghosh JKC. Ambient Air Pollution and Preterm Birth in the Environment and Pregnancy Outcomes Study at the University of California, Los Angeles. Am J Epidemiol. 2007;166:1045–52. doi: 10.1093/aje/kwm181. [DOI] [PubMed] [Google Scholar]
- 16.Nieuwenhuijsen MJ, Dadvand P, Grellier J, Martinez D, Vrijheid M. Environmental risk factors of pregnancy outcomes: a summary of recent meta-analyses of epidemiological studies. Environ Health. 2013;12:1–10. doi: 10.1186/1476-069X-12-6. [DOI] [PMC free article] [PubMed] [Google Scholar]
- 17.Gehring U, Wijga AH, Fischer P, de Jongste JC, Kerkhof M, Koppelman GH, et al. Traffic-related air pollution, preterm birth and term birth weight in the PIAMA birth cohort study. Environ Res. 2011;111:125–35. doi: 10.1016/j.envres.2010.10.004. [DOI] [PubMed] [Google Scholar]
- 18.Fleischer NL, Merialdi M, van Donkelaar A, Vadillo-Ortega F, Martin RV, Betran AP, et al. Outdoor air pollution, preterm birth, and low birth weight: analysis of the world health organization global survey on maternal and perinatal health. Environ Health Perspect. 2014;122:425–30. doi: 10.1289/ehp.1306837. [DOI] [PMC free article] [PubMed] [Google Scholar]
- 19.Shah PS, Balkhair T. Knowledge Synthesis Group on Determinants of Preterm/LBW Births. Air pollution and birth outcomes: a systematic review. Environ Int. 2011;37:498–516. doi: 10.1016/j.envint.2010.10.009. [DOI] [PubMed] [Google Scholar]
- 20.Reynolds P, Behren Von J, Gunier RB, Goldberg DE, Hertz A. Residential exposure to traffic in California and childhood cancer. Epidemiology. 2004;15:6–12. doi: 10.1097/01.ede.0000101749.28283.de. [DOI] [PubMed] [Google Scholar]
- 21.Perchoux C, Chaix B, Cummins S, Kestens Y. Conceptualization and measurement of environmental exposure in epidemiology: accounting for activity space related to daily mobility. Health Place. 2013;21:86–93. doi: 10.1016/j.healthplace.2013.01.005. [DOI] [PubMed] [Google Scholar]
- 22.Frank LD, Saelens BE, Powell KE, Chapman JE. Stepping towards causation: do built environments or neighborhood and travel preferences explain physical activity, driving, and obesity? Social Sci Med. 2007;65:1898–914. doi: 10.1016/j.socscimed.2007.05.053. [DOI] [PubMed] [Google Scholar]
- 23.Charreire H, Casey R, Salze P, Simon C, Chaix B, Banos A, et al. Measuring the food environment using geographical information systems: a methodological review. Public Health Nutr. 2010;13:1773–85. doi: 10.1017/S1368980010000753. [DOI] [PubMed] [Google Scholar]
- 24.Kahr MK, Suter MA, Ballas J, Ramin SM, Monga M, Lee W, et al. Geospatial analysis of food environment demonstrates associations with gestational diabetes. Am J Obstet Gynecol. 2016;214:110.e1–9. doi: 10.1016/j.ajog.2015.08.048. [DOI] [PMC free article] [PubMed] [Google Scholar]
- 25.Shapiro-Mendoza CK, Lackritz EM. Epidemiology of late and moderate preterm birth. Semin Fetal Neonat Med. 2012;17:120–5. doi: 10.1016/j.siny.2012.01.007. [DOI] [PMC free article] [PubMed] [Google Scholar]
- 26.Downtown H, editor. downtownhouston.org [Internet] [cited 2015 Jul 6]. Available from: http://downtownhouston.org/retail/demographics-reports/
- 27.Rojas-Rueda D, de Nazelle A, Teixidó O, Nieuwenhuijsen MJ. Health impact assessment of increasing public transport and cycling use in Barcelona: A morbidity and burden of disease approach. Prev Med. 2013;57:573–579. doi: 10.1016/j.ypmed.2013.07.021. [DOI] [PubMed] [Google Scholar]
- 28.Wu J, Jiang C, Jaimes G, Bartell S, Dang A, Baker D, et al. Travel patterns during pregnancy: comparison between global positioning system (GPS) tracking and questionnaire data. Environ Health. 2013;12:1–1. doi: 10.1186/1476-069X-12-86. [DOI] [PMC free article] [PubMed] [Google Scholar]
- 29.Padula AM, Mortimer KM, Tager IB, Hammond SK, Lurmann FW, Yang W, et al. Exposure to Traffic-related Air Pollution During Pregnancy and Term Low Birth Weight: Estimation of Causal Associations in a Semiparametric Model. Ann Epidemiol. 2014;24:888–95.e4. doi: 10.1093/aje/kws148. [DOI] [PMC free article] [PubMed] [Google Scholar]
- 30.Kloog I, Melly SJ, Ridgway WL, Coull BA, Schwartz J. Using new satellite based exposure methods to study the association between pregnancy pm 2.5 exposure, premature birth and birth weight in Massachusetts. Environ Health. 2012;11:1–8. doi: 10.1186/1476-069X-11-40. [DOI] [PMC free article] [PubMed] [Google Scholar]
- 31.Kent ST, McClure LA, Zaitchik Ben F, Gohlke JM. Area-level risk factors for adverse birth outcomes: trends in urban and rural settings. BMC Pregnan Childbirth. 2013;13:1–8. doi: 10.1186/1471-2393-13-129. [DOI] [PMC free article] [PubMed] [Google Scholar]
- 32.Stutzer A, Frey BS. Stress that doesn’t pay: the commuting paradox. Scand J Econ. 2008;110:339–66. [Google Scholar]
- 33.Gehring U, Tamburic L, Sbihi H, Davies HW, Brauer M. Impact of noise and air pollution on pregnancy outcomes. Epidemiology. 2014;25:351–8. doi: 10.1097/EDE.0000000000000073. [DOI] [PubMed] [Google Scholar]
- 34.Ristovska G, Laszlo H, Hansell A. Reproductive outcomes associated with noise exposure: a systematic review of the literature. International Journal of Environmental Research and Public Health. 2014;11:7931–52. doi: 10.3390/ijerph110807931. [DOI] [PMC free article] [PubMed] [Google Scholar]
- 35.Staneva A, Bogossian F, Pritchard M, Wittkowski A. Women and birth. Australian College of Midwives; 2015. The effects of maternal depression, anxiety, and perceived stress during pregnancy on preterm birth: a systematic review; pp. 1–15. [DOI] [PubMed] [Google Scholar]
- 36.Yorifuji T, Naruse H, Kashima S, Murakoshi T, Doi H. Science of the total environment. C. Vol. 508. Brisbane, Australia: 2015. pp. 188–92. [DOI] [PubMed] [Google Scholar]
- 37.Clark LP, Millet DB, Marshall JD. National Patterns in environmental injustice and inequality: outdoor NO2 air pollution in the United States. PLoS One. 2014;9:e94431. doi: 10.1371/journal.pone.0094431. [DOI] [PMC free article] [PubMed] [Google Scholar]