Summary
Nuclear resonance vibrational spectroscopy (NRVS) has been used by physicists for many years. However, it is still a relatively new technique for bioinorganic users. This technique yields a vibrational spectrum for a specific element, which can be easily interpreted. Furthermore, isotopic labeling allows for site-specific experiments. In this chapter we discuss how to access specific beamlines, what kind of equipment is used in NRVS and how the sample should be prepared and the data collected and analyzed.
Keywords: nuclear resonance vibrational spectroscopy, NRVS, metalloproteins, Mössbauer
1. Introduction
Nuclear resonance vibrational spectroscopy (NRVS) has been used by physicists for nearly two decades (1), but it is still a relatively new technique for bioinorganic users. Why is NRVS of interest to chemists and biologists? Among other things, it is an exciting tool because:
NRVS yields a vibrational spectrum for a specific element,
the resulting vibrational spectrum is easily interpreted or calculated,
the isotopic sensitivity allows site-specific labeling experiments,
low frequency acoustic and optical modes can be measured down to 8 cm−1,
Raman and infra-red silent modes can be observed, and
Anisotropy of motion can be determined accurately.
Before going further, we present an example to show what all the excitement is about (Fig. 1 left panel). In this case, we have a small molecule where IR and Raman had difficulty identifying an Fe=O stretch. By recording the spectrum with natural abundance O and then 18O, it was simple to identify the band at 831 cm−1 as the stretching mode of an Fe=O double bond. For biochemical users, the beauty of NRVS spectrum is not only that it will provide such vibrational frequencies, similar to an IR or Raman spectrum, but also that it only senses those normal modes in which the probe nucleus (usually 57Fe) is moving. Although 57Fe is by far the dominant isotope used for NRVS, there more than a dozen other elements are currently feasible (Fig. 1 right panel). In this chapter, we describe procedures for scheduling a NRVS experiment, preparing samples, conducting the measurement, processing the data, and interpreting the results.
Figure 1.
Left: a generic NRVS spectrum. Right: the current NRVS periodic table.
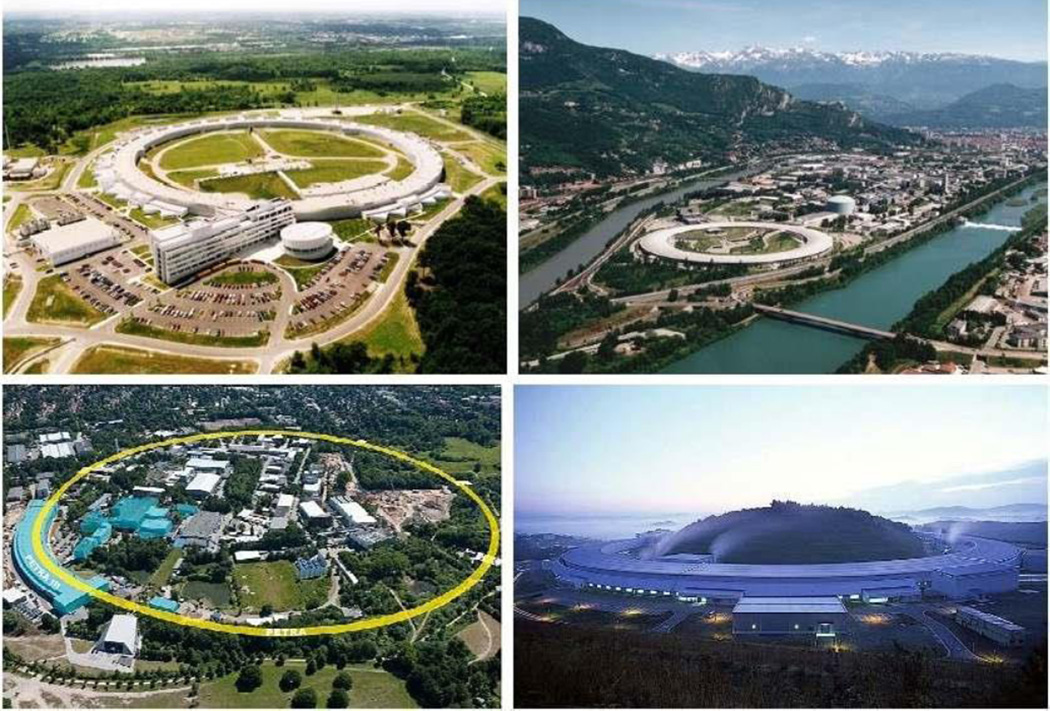
Once you have decided that NRVS will be helpful, you will need access to a beamline where such experiments can be done. Compared to X-ray diffraction or EXAFS, the choice of facilities is relatively narrow: APS (http://www.aps.anl.gov), ESRF (http://www.esrf.eu), SPring-8 (http://www.spring8.or.jp/en/), and PETRA-III (http://petra3.desy.de) (Fig. 2; see Note 1).
Figure 2.
Synchrotron radiation labs with NRVS Facilities. Top left: APS, top right: ESRF, bottom left: PETRA-III, bottom right: SPring-8.
2. Materials
2.1. Sources and Monochromators
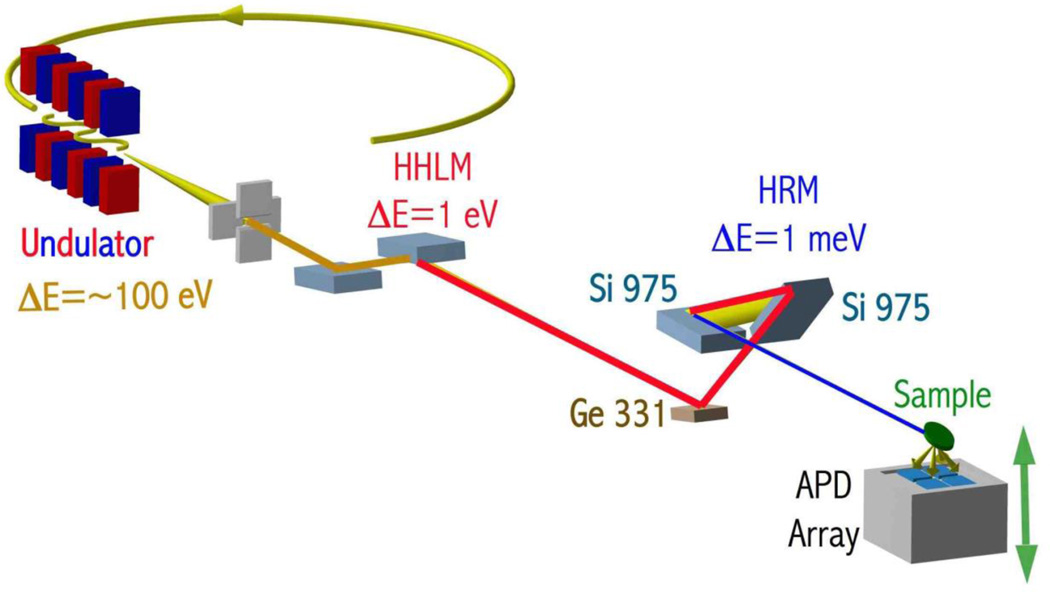
Regardless of which facility you choose, the experimental apparatus is pretty much the same. As illustrated in Fig. 3, the initial source of X-rays is an undulator in the storage ring, which produces intense X-rays with a spectral bandwidth of ~100 eV. Heat is removed and the bandwidth is reduced to ~1 eV by a high heat load monochromator (HHLM). Since the range of a typical NRVS experiment is typically ~0.1 eV, once optimized, there is usually no need to adjust the undulator or even the HHLM.
Figure 3.
A schematic overview of the NRVS beamline at Spring-8 BL09XU.
With the more manageable beam from the HHLM, a ~1 meV resolution beam is then produced by the high-resolution monochromator (HRM). These devices achieve a bandwidth about 1/1000 that of typical EXAFS monochromators. A high diffraction angle, asymmetric reflections, and combination of different single crystal reflections are used to achieve the high energy resolution and a wide acceptance angle in these monochromators. However, there is a tradeoff between resolution and intensity that has to be considered in the NRVS experiments, because both factors are usually important. Higher resolution cuts the flux due to the narrower energy bandwidth and the lower reflectivity of the more asymmetric reflection.
A representative compromise between flux and resolution is the three bounce type HRM adopted at SPring-8 Beamline 09XU (Fig. 3). Two Si 975 reflections with asymmetry factors b of 1/10.8 and 18.0, are followed by a Ge 331 reflection with b of 1/2.0. Here the asymmetry factor is defined as b= sin (θin) / sin (θout), where θin and θout are incident and outgoing angles from the crystal surface respectively. (The Ge reflection is used to set the output beam almost horizontal.) The energy of the output beam is determined by the angle between the two Si (975) crystals, which is controlled by a piezoelectric linear stage.
2.2. Detectors and Electronics
One of the breakthroughs that permitted the development of the NRVS technique was the introduction of avalanche photodiode (APD) detectors with nanosecond response times. These devices are used to detect nuclear fluorescence and X-ray fluorescence (following internal conversion) from the sample. One can use timing electronics to distinguish these ‘signal’ photons (which arise from a nuclear absorption event) from the much larger number of ‘background’ photons that arise from X-ray scattering and conventional sample fluorescence. This is possible because ‘signal’ photons arrive with a delay corresponding to the half-life of the nuclear excited state (about 100 ns for 57Fe), while the ‘background’ photons are essentially prompt and only appear during the ~70 ps length of the synchrotron radiation pulse (Fig. 4 left panel).
Figure 4.
Left: typical time structure of ‘signal’ events. Right: electronics for time-gated NRVS detection. The delayed signal from CFD2 corresponds to nuclear events.
The electronics used to distinguish nuclear events from electronic scattering and X-ray fluorescence is also shown in Fig. 4 (right panel). The important devices are the ‘bunch clock’, which tells the experimenter the initial t=0 time point when the synchrotron pulse arrives, and a constant fraction discriminator (CFD) that is a very fast analyzer of photon arrivals. A veto interval X, where X is about 10–20 ns, is set around t=0, to allow the APD to recover from the enormous background pulse. Then, events that occur after t+X and before the next synchrotron pulse are accepted by the system and recorded by a counter.
Apart from the timing window, one can also set a CFD lower threshold to discriminate against electronic noise and an upper level to reject cosmic ray events. With these conditions set, a good beamline APD system can achieve dark count rates on the order of 5 × 10⁻³ s−1, a limit set in part by residual particles traveling in bunches that should be empty. This background level is an important factor in setting a lower limit to sample concentrations that can be studied. The electronic windows will usually be set by a beamline scientist (see Note 2).
3. Methods
3.1. Isotope Enrichment
Natural abundance Fe contains 2.14% 57Fe. The procedures for enriching inorganic samples with 57Fe (or other NRVS isotopes) will be as varied as the synthetic methods that are used (see Note 3). Enrichment of biological samples can also follow several routes, depending on the level of control over the site of interest. The most basic way to enrich a sample is to enrich the growth medium for the organism that is producing the sample. For the most common isotope, 57Fe, one can dissolve elemental Fe in aqua regia and add to an Fe-free growth medium. Alternatively, one can purchase or prepare soluble 57Fe enriched salts, such as 57FeCl3 or 57FeSO4 (see Note 4).
3.2 Sample Cells
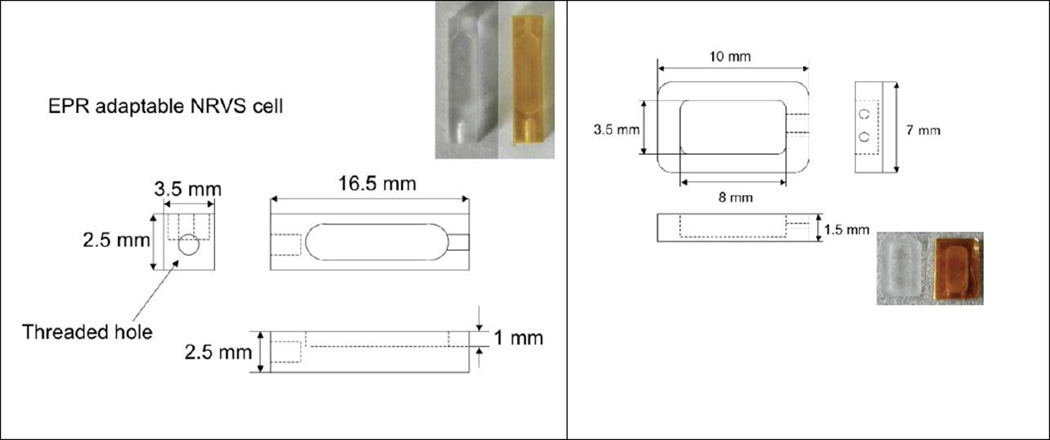
The sample path length for an NRVS experiment will depend on the energy of the nuclear resonance being used and the matrix surrounding the isotope of interest. For water, the 1/e path length at the 57Fe resonance at 14.4 keV is almost 6 mm, so ideally one would like a ~1 cm sample to use most of the incoming photons. On the other hand, for the Fe Kα photons at 6.5 keV, the 1/e path length is barely more than 0.5 mm, so not much radiation from more than 1 mm below the surface will escape. Therefore, sample cells for 57Fe metalloproteins are typically 10 mm in length, 3 mm in width and 1 mm in depth, as shown in Fig. 5.
Figure 5.
Typical sample cells. Left: frozen solution cell. Right: model compound powder cell. The inserted photos are real NRVS sample holders.
There is sometimes a benefit in using the same sample cell for NRVS and another spectroscopies, such as EXAFS, EPR, or Mössbauer. The cell for protein solutions, illustrated in Fig. 5 (left panel), is adaptable to a 5 mm in diameter EPR cavity, as well as other spectroscopies. An alternative sample cell in Fig. 5 (right panel) has a large surface area for easier loading and sealing of powder samples.
3.3 Sample Preparation, Shipping, and Mounting Procedures
For protein samples, the NRVS cell shown above in Fig. 5 (left panel) will first be sealed with a window made of Kapton tape. A solution sample is then injected through the entry hole using a Hamilton syringe, and the hole is then sealed with a bit of grease. Such a loaded sample will be frozen with liquid nitrogen (LN2), and shipped to the beamline with dry LN2 shipper.
Powder samples can be loaded into the cell in Fig. 5 (right panel) with a spatula. Especially when working in a glove-box, an anti-static device is helpful to avoid static built-up that can make powders fly. After the cell is full, it is sealed with a piece of Kapton tape. Depending on their sensitivity, such prepared samples can be either double-sealed and shipped at room temperature or frozen and shipped with a dry shipper.
Most biochemical samples are run at low temperatures, mounted on a cold-finger in the beamline cryostat. The samples are either attached using screws or using a cryogenic adhesive. In the latter procedure, the samples are briefly warmed up above the effective melting point of the cryogenic adhesive, which is ~175K for low temperature grease and 147K for 1-proanol) (2). Once cooled below those temperatures, the samples are held firmly in place, usually with better thermal contact than provided by mechanical screws or clamps.
3.4. NRVS Data Collection
3.4.1. Temperature Control
For most biological NRVS experiments, it will be best to run the sample at low temperatures. This will protect the samples against radiation damage, and it will also provide a cleaner NRVS measurement with sharper features. All of the beamlines provide a cryostat for these purposes (see Note 5).
3.4.2. Photolysis
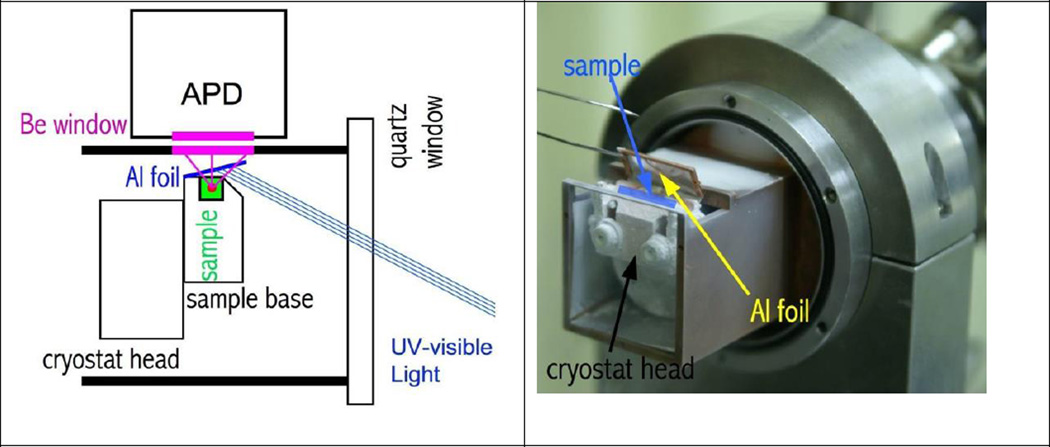
In situ photolysis combined with NRVS can be a powerful tool. Early on, beautiful work was done on myoglobin-CO photolyzed at the beamline (3). For such in-situ photolysis experiments, samples can be illuminated from outside of the experimental chamber. In one design (Fig. 6) an aluminized Mylar film is placed above the sample to reflect the light directly onto the sample surface and also to protect the APD detector.
Figure 6.
Left: schematic illustration of a photolysis NRVS experiment. The x-ray beam is perpendicular to the page surface. Right: a photo showing the photolysis setup (around the sample) at SPring-8 BL09XU.
3.4.3. Monochromator Calibration and Stability
The precision and accuracy of the NRVS energy scale cannot be taken for granted. By precision we mean the scan-to-scan reproducibility of the spectral features, such as the elastic peak position, which is used as the energy zero for the vibrational spectrum. By accuracy we mean the true energies of NRVS peaks as opposed to what the computer is reporting. While the precision of most beamlines is often exquisite, accurate vibrational energies usually require a post data-collection correction factor.
The energy of the X-rays from the monochromators depends on the angles of the crystals and their atomic d-spacings, hence the precision of a spectrum depends on the reproducibility of these factors. The angular position of the monochromator crystals is usually monitored by ‘encoders’ that provide ±2.5.10−6 degrees or 45 nanoradian control and the beam position is also controlled to better than a microradian, so in a modern beamline the diffraction angle is not a source of error.
However, the remaining factor, the atomic d-spacing, is directly sensitive to the temperature of the crystals. For Si, the coefficient of thermal expansion at room temperature is 2.56 × 10⁻⁶ K−1. The consequences are that a temperature drift of 0.03K will cause an energy shift of 9 cm−1, which corresponds to the resolution of most beamlines. Something as innocuous as entering the monochromator hutch could change the crystal temperature by 0.1°, and this might require hours to re-equilibrate. So, as far as a protocol goes,
Check the zero of the energy scale by including a fine scan over the elastic peak in each scan and monitoring its reproducibility,
do not enter the monochromator hutch unless absolutely necessary, and
plan ahead so monochromator hutch entry coincides with sample change or other downtime.
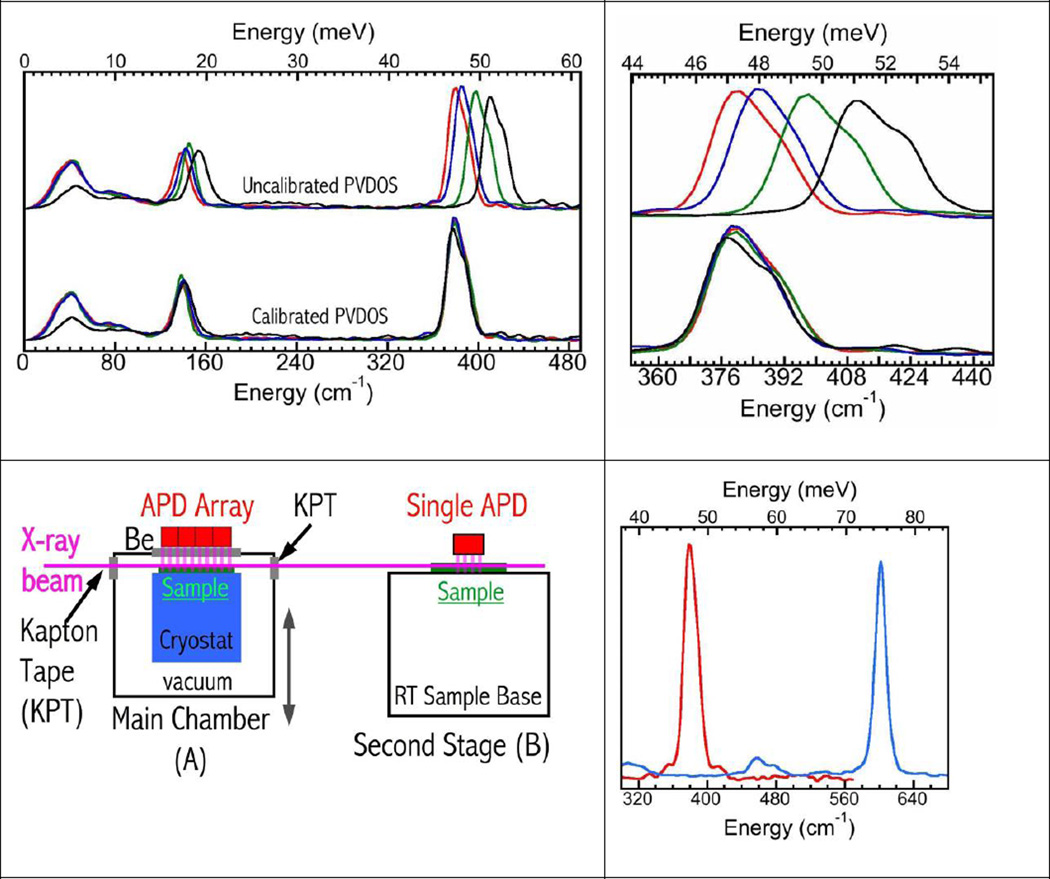
Even with a reproducible elastic peak position, the energy scale for the NRVS spectrum cannot be taken for granted. As an example, in Fig. 7 (top two panels, top curves), we show the spectra for the same (NEt4)(FeCl4) sample run at different beamlines. The Fe-Cl stretch peak varies by ~4 meV, less than one-millionth the incident energy of 14.4 keV. However, ~4 meV is also ~32 cm-1, nearly a 10% error on the vibrational energy scale. By knowing from IR spectroscopy that the correct peak is at 380 cm−1, a linear correction factor of about 0.920 to 1.005 brings all of the spectra into very good alignment (Fig. 7 top two panels, bottom curves). So, as far as a protocol goes,
do not assume the calibration is constant or correct,
bring a sample with a known set of vibrational frequencies and run this intermittently, and
if possible, employ simultaneous calibration with an inline standard.
Figure 7.
Top left: NRVS spectra for (NEt4)(FeCl4) before (upper) and after (lower) recalibration. Data are respectively from APS (––), ESRF (––), Spring-8 (––) and PETRA-III (––). Top right: close-up of Fe-Cl stretching region before (upper) and after (lower) recalibration. Bottom left: schematic of dual sample operation for online calibration. Bottom right: overlap of spectra for (NEt4)(FeCl4) (––) and (NH4)2MgFe(CN)6 (––) calibration standards.
The simultaneous calibration approach is illustrated in Fig. 7’s bottom left panel. It employs the same tactics as the 3-ion-chamber geometry used for simultaneous EXAFS calibrations. In this approach, a secondary standard sample and an APD detector are placed downstream of the experiment chamber. An ideal secondary standard will have a strong and sharp peak, even at room temperature. A nice standard for 57Fe work is (NH4)2MgFe(CN)6, which exhibits peaks out to 602 cm−1 (Fig. 7, bottom right panel) and does not require a cryostat.
3.4.4. Scan Parameters and Detecting Weak Features
Unlike FT-IR or dispersive Raman spectroscopy, where the entire spectrum is recorded at the same time, NRVS data is collected one point at a time. Therefore, as in an EXAFS experiment, one has to decide a scan range, step size, and weighting scheme appropriate for the sample of interest. Also like EXAFS, experience has shown that it is best to average a dozen individual scans that take on the order of one hour each, rather than attempting a single 12-hour scan.
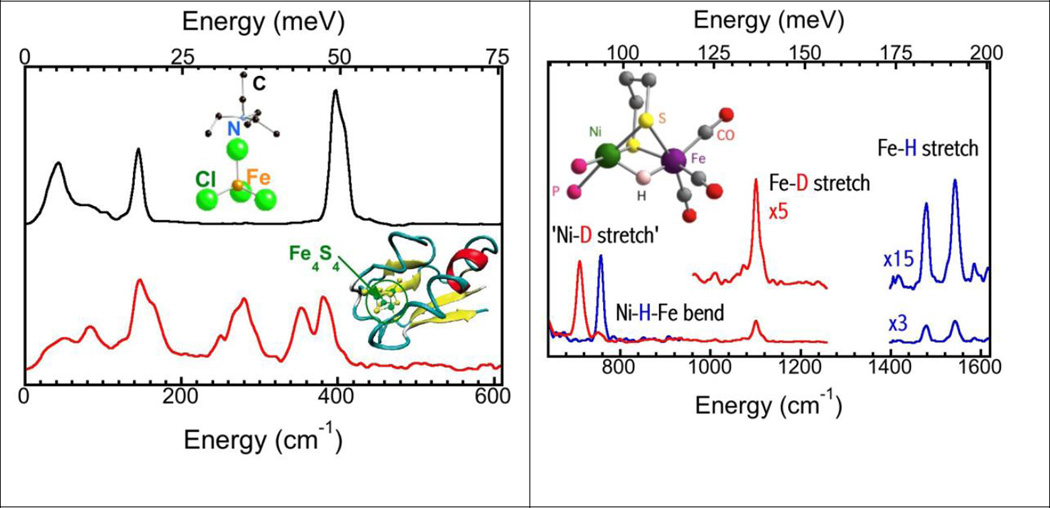
A typical scan will start in the anti-Stokes region, pass through the elastic line, and then continue to the highest energy for which vibrational modes can be seen (Fig. 8, left panel). The step size is dictated by the beamline resolution, as with other spectroscopy you typically want at least 3–4 points per linewidth interval, hence a step size of ~0.25–0.35 eV. Although it might seem wasteful, you need a good anti-Stokes region for confirmation of the sample temperature, and you need the elastic line to check the scan-to-scan energy reproducibility. For many model compounds and simple proteins, equal counting times are appropriate, and if the overall scan range is ~100 meV, then a reasonable scan uses about 5 seconds per point.
Figure 8.
Left: typical equal weight NRVS scans [–– for (NEt4)(FeCl4) and –– for P. furiosis 4Fe-4S protein]. Right: NRVS spectrum for a NiFe(H/D) model complex that used a scan heavily weight in the Fe-H region.
In some cases, the NRVS experiment is designed to detect very weak features in the overall spectrum. Examples are the search for Fe-CO bands in a protein where only 1 out of 12 Fe binds CO (1) or intrinsically weak bands such as Fe-H stretching modes (Fig. 8, right panel). In this case a weighted or even discontinuous scan approach is appropriate. Even in these cases, it is important to record and have adequate statistics in the elastic and low energy region.
3.4.5. Limits of Feasibility
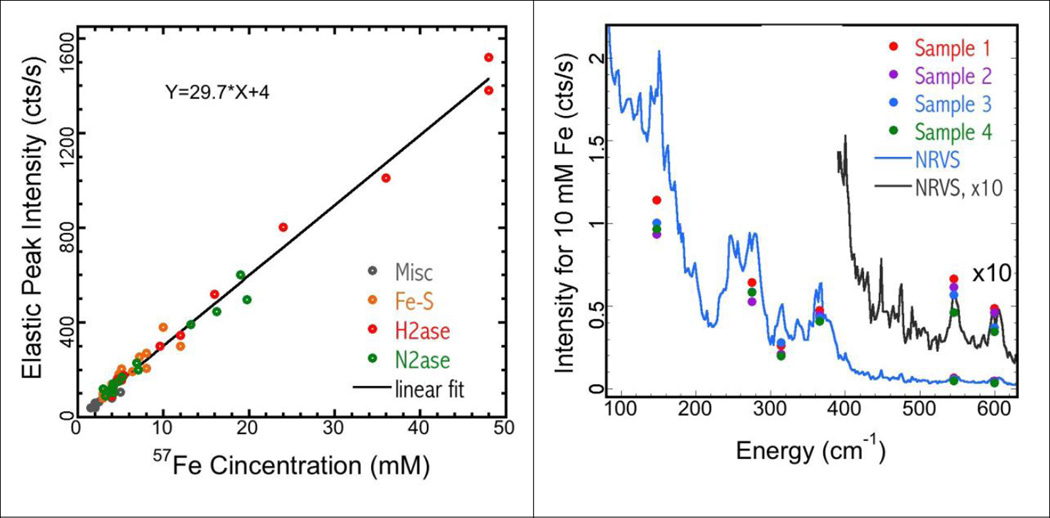
The first question that comes up in most conversations about biochemical NRVS is – what concentration do you need? Of course, a spectroscopist will answer – as high as possible. Here we try to be more quantitative about what is currently feasible. Thus, in Fig. 9 (left panel), we show data from Spring-8 for typical count rates on the elastic peak as a function of 57Fe concentration in protein samples — the slope corresponds to about 30 counts per second per mM 57Fe concentration (see Note 6).
Although the elastic peak might yield 300 cps for a 10 mM 57Fe sample, the count rates for particular vibrational modes in an NRVS spectrum are much lower (Fig. 9, right panel), in part because the inelastic intensity is spread over hundreds of meV. Depending on the symmetry of the Fe sites, the same 10mM sample might only yield a few counts per second (or less) on a vibrational peak. Since with photon statistics the signal-to-noise goes as the , then assuming that a S/N of 10 is desired, one only needs to count 100 photons for adequate statistics. At 1 cps that corresponds to 100 s per data point, or about 12 hours (including overhead) for a 400 point spectrum.
Figure 9.
Left: the relationship between the elastic peak intensity (cts/s) and the 57Fe concentration measured at SPring-8 BL09XU. Right: the NiFe H2ase NRVS spectrum, being scaled to an assumed 10 mM Fe concentration, and showing the Fe-S (blue) and Fe-CO (x10, black) vibrational features. The symbols are the intensity distribution for the corresponding peaks in four measurements (on four different NiR samples).
If this calculation could be extrapolated to 1 mM Fe, a 1mM sample would take 5 days – a long time but not impossible. Unfortunately, there is additional noise from the electronics that contributes a background rate on the order of 0.01 cps.
3.5. NRVS Data Processing
There are several software packages available for NRVS data processing, including PHOENIX (5) and DOS (6).
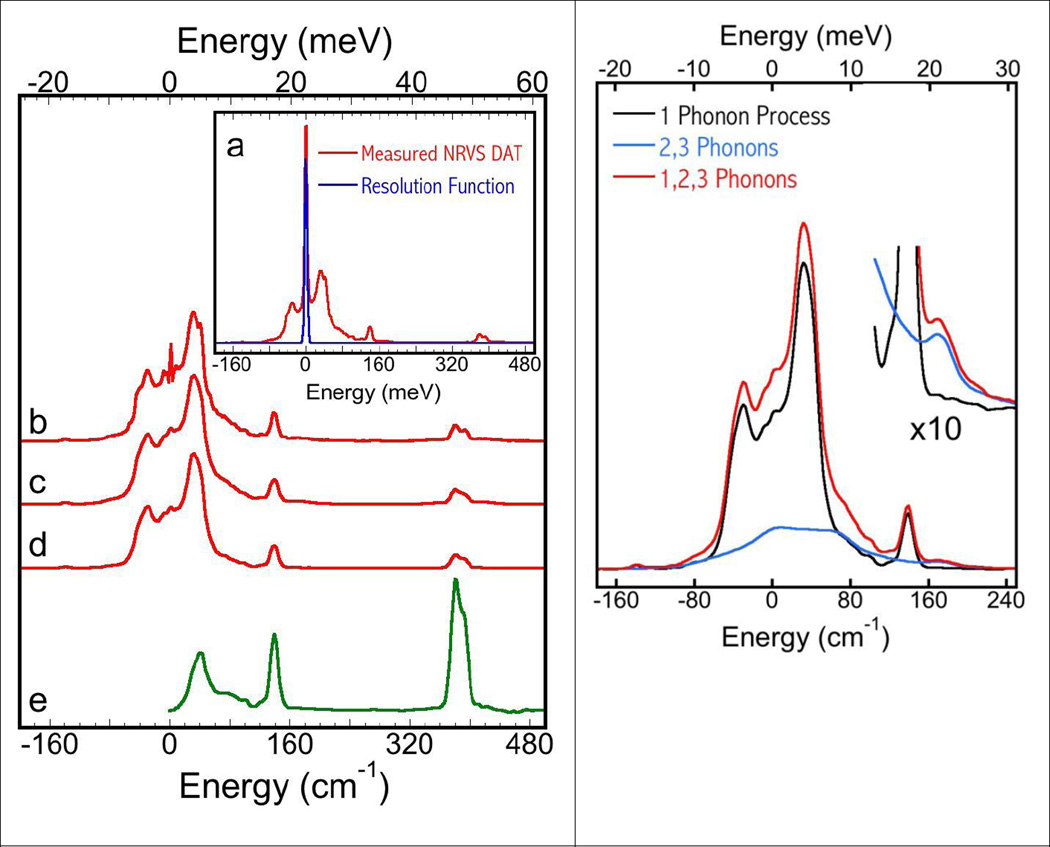
In general, spectral analysis was performed following the published procedure using the PHOENIX software package, (5,7) where the observed raw NRVS spectra were: calibrated to the nuclear resonant peak position (E0); normalized to I0; summed all the raw spectra; and converted to the 57Fe partial vibrational density of states (PVDOS or DOS for abbreviation). The last step (raw NRVS → PVDOS) actually includes the following steps (Fig 10, left panel):(5) 1) deconvolute the summed raw spectrum to obtain a theoretical spectrum without linewidth (a→b); 2) removal of the resonant peak and covert the spectrum into a transition probability (b→c); 3) derive the single photon transition probabilities (c→d); and 4) convert to PVDOS (d→e).
Figure 10.
Left: flow chart for NRVS analysis (a→e), using (NEt4)(FeCl4) as an example. Right: the one-phonon vs. multi-phonon spectra to show the artifact if multi-phonon effect is not removed.
In the right panel of Fig. 10, it is obvious that multi-phonon effects exist in the NRVS spectra. For example, the artifact peak at 21.5 meV might be accidentally considered as a vibrational mode if multi-phonon effect is not removed during a NRVS analysis.
3.6. Interpretation
Interpreting the NRVS, once you have it, can be as simple as pointing to a peak, or as complex as a spin DFT calculation. But that is beyond the scope of this chapter.
In summary, synchrotron radiation rings, undulators and NRVS beamlines continue to improve. As storage rings continue to improve and new beamlines become available, there are likely another 1–2 orders of magnitude improvement in store. The biochemical applications of this technique are only just beginning.
Table 1.
World-wide summary of NRVS-capable beamlines.
| Facility / Beamline | E (GeV) |
Emittance (nm-rad) |
Period (mm) |
# of periods |
Isotopes Covered |
|---|---|---|---|---|---|
| ESRF / ID-18 | 6 | 4 | 20/32 | 57Fe, 151Eu, 149Sm, 119Sn, 161Dy, 121Sb, 125Te, 129Xe | |
| APS / 3-ID | 7 | ~3.1 | 27 | 88 | 57Fe, 151Eu, 83Kr, 119Sn, 161Dy, |
| SPring-8 / XU-9 | 8 | ~3.4 | 32 | 140 | 57Fe, 151Eu, 149Sm, 119Sn, 40K |
| SPring-8/XLU-19 | 8 | ~3.4 | 32 | 781 | 57Fe |
| PETRA-III / P01 | 6 | 1 | 32 | 314 | 57Fe |
Acknowledgments
This work was funded by NIH grants GM-65440, EB-001962, and the DOE Office of Biological and Environmental Research. NRVS spectra were measured at APS Beamline 03ID, ESRF Beamline ID18, PETRA Beamline P01, and SPring-8 Beamlines 09XU, and BL19LXU. We also thank all our colleagues and collaborators for their assistances.
Footnotes
Depending on the lab, proposals are accepted one, two, or three times a year. As with other SR experiments, it is best to contact a beamline scientist first to see if your proposal is a good match for the beamline.
Still, it is important for the biochemical user is to know that such pulse processing exists, and that it is critical to the success of the experiment. If there is an unacceptably large background count rate, the window settings are one item to look at.
Although highly discouraged by beamline scientists, in some cases unenriched samples have to be run, like naturally isolated molecules, or meteorites. Of course, the experiment will take 50 times longer.
Examples of isotope vendors are: Isoflex (http://www.isoflex.com), Cambridge Isotope Labs (http://www.isotope.com), Advanced Materials Technologies (http://www.isotope-amt.com), and National Isotope Development Center (http://www.isotopes.gov/).
The general rule is that the lower the temperature, the better the data. So, when using a LHe flow cryostat, higher flow rates are encouraged. However, given the current price and shortages of liquid He, you can expect a shift towards use of closed-cycle cryo-coolers. In addition, as discussed above, sample loading medium and method are also critical to real sample temperatures (2).
This correlation would not hold for model compounds, because in such cases the signal from the elastic peak saturates and is no longer linear with concentration.
References
- 1.Sturhahn W, et al. Phonon Density of States Measured by Inelastic Nuclear Resonant Scattering. Physical Review Letters. 1995;74:832–3835. doi: 10.1103/PhysRevLett.74.3832. [DOI] [PubMed] [Google Scholar]
- 2.Wang H, et al. Real sample temperature: a critical issue in the experiments of nuclear resonant vibrational spectroscopy on biological samples. Journal of Synchrotron Radiation. 2012;19:257–263. doi: 10.1107/S0909049512001380. [DOI] [PMC free article] [PubMed] [Google Scholar]
- 3.Sage JT, et al. Long-Range Reactive Dynamics in Myoglobin. Physical Review Letters. 2001;86:4966–4969. doi: 10.1103/PhysRevLett.86.4966. [DOI] [PubMed] [Google Scholar]
- 4.Kamali S, et al. Observation of the Fe-CN and Fe-CO Vibrations in the Active Site of [NiFe] Hydrogenase by Nuclear Resonance Vibrational Spectroscopy. Angewandte Chemie-International Edition. 2013;52:724–728. doi: 10.1002/anie.201204616. [DOI] [PMC free article] [PubMed] [Google Scholar]
- 5.Sturhahn W. CONUSS and PHOENIX: evaluation of nuclear resonant scattering data. Hyperfine Interactions. 2000;125:149–172. [Google Scholar]
- 6.Kohn VG, Chumakov AI. DOS: Evaluation of phonon density of states from nuclear resonant inelastic absorption. Hyperfine Interactions. 2000;125:205–221. [Google Scholar]
- 7.Smith MC, et al. Normal Mode Analysis of [FeCl4]− and [Fe2S2Cl4]2− via Vibrational Mössbauer, Resonance Raman, and FT-IR Spectroscopy. Inorganic Chemistry. 2005;44:5562–5570. doi: 10.1021/ic0482584. [DOI] [PubMed] [Google Scholar]


