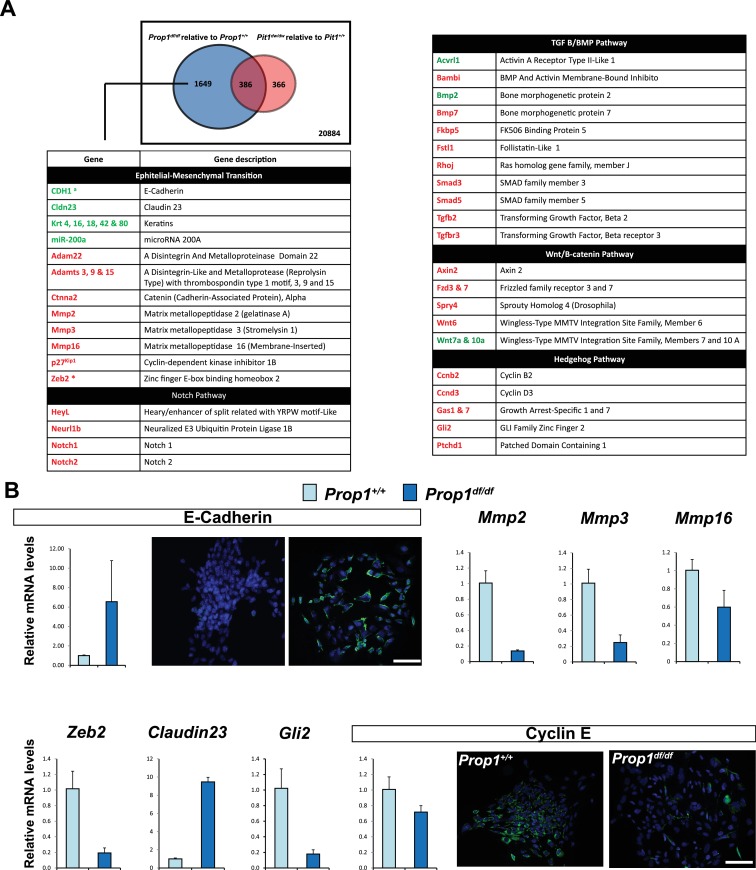
Figure 5. Differential gene expression in Prop1df/df and Pou1f1dw/dw pituitary stem-cell-derived colonies at P13.
(A) A Venn diagram illustrates the total number of genes with significantly different expression in Prop1 mutants relative to their wild-type littermates (blue circle) and Pou1f1 mutants relative to their wild-type counterparts (red circle). The table shows examples of genes up regulated (green) or down regulated (red) (p value ≤ 0.05, |log2FCΙ ≥ 1) uniquely in the Prop1 mutant colonies relative to Pou1f1 mutants. (B) RT-qPCR validation of RNA-Seq data. GAPDH was used as an internal control (N = 4) OWA and * indicates p<0.05 relative to control. Immunostaining for CDH1 shows an increased in protein expression on colonies from Prop1df/df pituitaries compare to control. CYCLIN E immunostaining reveals that Prop1+/+ colonies express this protein but is absent on Prop1df/df colonies. Cell nuclei were stained with DAPI (blue). Scale bar 100 µm. Plots denote the mean ± SEM. qPCRs were done using at least three technical replicates.

