

Abstract
The behavior of intracochlear distortion products (iDPs) was inferred by interacting a probe tone (f3) with the iDP of interest to produce a “secondary” distortion product otoacoustic emission termed DPOAE2ry. Measures of the DPOAE2ry were then used to deduce the properties of the iDP. This approach was used in alert rabbits and anesthetized gerbils to compare ear-canal 2f1-f2 and 2f2-f1 DPOAE f2/f1 ratio functions, level/phase (L/P) maps, and interference-response areas (IRAs) to their simultaneously collected DPOAE2ry counterparts. These same measures were also collected in a human volunteer to demonstrate similarities with their laboratory animal counterparts and their potential applicability to humans. Results showed that DPOAEs and inferred iDPs evidenced distinct behaviors and properties. That is, DPOAE ratio functions elicited by low-level primaries peaked around an f2/f1 = 1.21 or 1.25, depending on species, while the corresponding inferred iDP ratio functions peaked at f2/f1 ratios of ~1. Additionally, L/P maps showed rapid phase variation with DPOAE frequency (fdp) for the narrow-ratio 2f1-f2 and all 2f2-f1 DPOAEs, while the corresponding DPOAE2ry measures evidenced relatively constant phases. Common features of narrow-ratio DPOAE IRAs, such as large enhancements for interference tones (ITs) presented above f2, were not present in DPOAE2ry IRAs. Finally, based on prior experiments in gerbils, the behavior of the iDP directly measured in intracochlear pressure was compared to the iDP inferred from the DPOAE2ry and found to be similar. Together, these findings are consistent with the notion that under certain conditions, ear-canal DPOAEs provide poor representations of iDPs and thus support a “beamforming” hypothesis. According to this concept, distributed emission components directed toward the ear canal from the f2 and basal to f2 regions can be of differing phases and thus cancel, while these same components directed toward fdp add in phase.
Keywords: rabbit, gerbil, human, DPOAEs, intracochlear pressure
INTRODUCTION
The characteristics of distortion product otoacoustic emissions (DPOAEs), i.e., distortion products (DPs) measured in the ear canal, have been thoroughly described in the literature (e.g., Probst et al. 1991; Avan et al. 2013). In contrast, considerably less is known concerning the properties of intracochlear DPs (iDPs) at the DP frequency place (fdp) on the basilar membrane (BM). This observation raises the general question as to whether the behaviors of DPOAEs reflect the properties of their corresponding iDPs? The limited data available from direct comparisons of DPOAEs to iDPs suggest that there are significant differences between DPOAEs recorded in the ear canal and their intracochlear counterparts. For example, as the f2/f1 ratio is decreased, the 2f1-f2 DPOAE from the ear canal often increases to a maximum at an “optimal” f2/f1 ratio of 1.2–1.25 and then dramatically decreases at narrower f2/f1 ratios (Harris et al. 1989; Johnson et al. 2006). This results in the well-described inverted U-shaped f2/f1 ratio function for DPOAEs (e.g., Harris et al. 1989), which is often not observed in similar functions obtained for iDPs measured directly on the BM (e.g., Cooper and Rhode 1997; Rhode and Cooper 1997; Robles et al. 1997) when the iDP is located at the characteristic frequency (CF) of the measurement site. That is, the 2f1-f2 DP on the BM continues to increase in level as the f2/f1 ratio decreases toward 1.0. This is also true when f2, the presumed site of DP generation, is placed at the CF of the BM preparation (Rhode 2007). In summary, it is important to understand what accounts for this difference in the behavior of iDPs measured on the BM and DPOAEs measured in the ear canal.
One approach toward solving the above issue utilizes a method described earlier by Whitehead et al. (1993) that consists of a noninvasive assay of the behavior of iDPs that can then be compared to that of ear-canal DPOAEs collected simultaneously. To accomplish this goal, the 2f1-f2 or 2f2-f1 DPOAE was interacted with a third tone (f3) to produce a secondary DPOAE (i.e., DPOAE2ry), which in turn was used to infer the level and phase of the DP at its characteristic place on the BM. One caveat to this approach is that it has never been validated by direct simultaneous measures of BM displacements at the DPOAE place (i.e., fdp) on the BM. However, in an earlier attempt to understand the psychophysical and physiological aspects of combination tones (CTs), this method was used psychophysically by interacting a third f3 tone with an audible CT at the 2f1-f2 frequency to produce a secondary CT at 2f3-(2f1-f2) (Goldstein et al. 1978). Using acoustic-cancellation techniques, Goldstein et al. (1978) demonstrated that the secondary CT was eliminated when the primary CT was cancelled by an external tone. These investigators concluded that their “findings support the view that CTs exist in the cochlea as spatially distinct, stimulus-like excitations”, i.e., like pure tones on the BM. Whitehead et al. (unpublished observations) also used an external tone to cancel the 2f1-f2 iDP at its frequency place on the BM and thus eliminate the DPOAE2ry to reach a similar conclusion that iDPs on the BM behaved like single-tone stimuli. Consequently, interacting a probe tone with any DPOAE of interest to produce a DPOAE2ry appears to be a reasonable means to infer the behavior of iDPs. Similar to the Goldstein et al. (1978) findings, canceling the 2f1-f2 iDP to eliminate the DPOAE2ry did not cancel the 2f1-f2 DPOAE measured in the ear canal, which is consistent with the notion that DPs traveling toward the ear canal can behave differently from those that propagate apically on the BM to the fdp place.
More recently, Shera and Guinan (2007) made extensive use of this noninvasive strategy to perform Allen-Fahey experiments. Their report described in detail the method and logic behind this noninvasive procedure to assay the behavior of iDPs. In the course of their study, Shera and Guinan (2007) also observed the inverted U-shaped f2/f1 ratio function in which DPOAE magnitude decreased as the f2/f1 ratio approached 1.0, while the inferred iDP did not. Based upon several cochlear-modeling results, Shera, Guinan, and colleagues proposed that as the f2/f1 ratio decreased, a type of “beamforming” occurs which imparts a “directionality to the waves radiated by the DP source” (Shera 2003; Shera and Guinan 2007, 2008; Shera et al. 2007). Thus, the beamforming model proposes that at narrow f2/f1 ratios, the DP wavelets directed toward the fdp place are in phase and add within the cochlea, while those directed toward the ear canal are out of phase and are largely in cancellation. This type of phase behavior dependent upon the f2/f1 ratio provides a reasonable explanation for the observed differences between iDP and DPOAE features.
Other perplexing DPOAE phenomena are also amenable to analysis by the noninvasive DPOAE2ry technique such as suppression/enhancement of DPOAEs by the presentation of a third or interference tone (IT) above the f2 primary described by Martin et al. (1999). One of the more salient features of these phenomena was a strong enhancement produced by the IT for 2f1-f2 DPOAEs generated by narrow primary-tone ratios and 2f2-f1 DPOAEs at all ratios. Initially, it was proposed (Martin et al. 1999, 2003) that DPOAE components were generated basal to the f2 place, which were either adding in or out of phase to components generated nearer to the f2 place. Presentation of the IT removed these basal components to produce the observed suppression/enhancement effects. An alternative hypothesis proposed by Fahey et al. (2000) was that the IT produced emissions via a complex “catalyst” mechanism that either added in phase or out of phase with the measured DPOAE to achieve similar suppression/enhancement effects. It could be argued that if the catalyst mechanism was operating, the DP presumably created by this route would not only affect the DPOAE measured in the ear canal but also travel to the fdp place on the BM to interact with the iDP.
Whether or not suppression/enhancement from ITs basal to the f2 place occurs for the iDP counterparts of DPOAEs is uncertain. However, the present results strongly suggest that these effects do not occur for iDPs, which is consistent with the notion that “basal to the f2 place” suppression/enhancement phenomena occur because of the distributed nature of DPOAE generation. That is, at optimal f2/f1 ratios, DPOAE wavelets directed toward the ear canal are in phase and the IT suppresses some of these components resulting in an overall suppression of the DPOAE. However, at narrow f2/f1 ratios, distributed DPOAE wavelets directed toward the ear canal are largely in cancellation, thus suppressing some of these components and allowing the others to travel to the ear canal without being canceled, consequently resulting in an overall enhancement of the DPOAE.
In spite of the complexity of the procedures in the present study, very robust data were obtained in most cases for the DPOAE2ry. Overall, the results described below revealed substantial differences between DPOAEs measured in the ear canal and iDPs simultaneously inferred by this noninvasive assay.
METHODS
Animal Subjects
Two young female pigmented rabbits and one albino rabbit weighing 3–4 kg served as subjects for the rabbit studies. Prior to experimental manipulations, the rabbits were determined to have normal DPOAEs in both ears as compared to the laboratory’s database. All rabbit DPOAE testing was performed in awake rabbits in a sound-attenuated chamber, while the rabbits were confined in a standard Plexiglas rabbit holder to which they had been previously habituated.
Four young adult gerbils (50–70 g) anesthetized with 2.5–3 % isoflurane were used for the DPOAE measurements and were tested in the same sound-attenuated chamber. In gerbils, a tiny hole was made in the pars flacida of the tympanic membrane to prevent the buildup of middle-ear pressure. This procedure had little effect on DPOAEs and none at all for frequencies >3 kHz where the majority of the gerbil data were obtained. Gerbil data used for intracochlear-pressure measurements came from various past studies by one of the authors (WD). For these prior measures, gerbils were deeply anesthetized with an initial dose (60 mg/kg) of sodium pentobarbital, along with supplemental doses (10 mg/kg) administered for the maintenance of deep anesthesia. All animal protocols were approved by the Institutional Animal Care and Use Committee (IACUC) of the VA Loma Linda Healthcare System. For the prior intracochlear-pressure measurements, gerbil protocols were approved by the co-author’s (WD) previous IACUC at Columbia University.
Human Subject
One young female subject with normal hearing participated in similar experiments to explore the feasibility of performing the noninvasive DPOAE2ry procedure in humans. Testing was performed in a standard audiological test chamber. Informed consent was obtained and all DPOAE protocols were approved by the Institutional Review Board (IRB) of the VA Loma Linda Healthcare System.
DPOAE Instrumentation
The equipment and protocols used to measure DP-grams, DPOAE level/phase (L/P) maps, and DPOAE interference response areas (IRAs) have been described in detail previously (Martin et al. 1999, 2003, 2009, 2010, 2011). Briefly, a two-channel digital signal processing (DSP) board in a PC-based platform along with custom software generated the two primary tones, i.e., f1 and f2, and simultaneously measured the level of the ear-canal sound pressure. For f2/f1 ratio functions and L/P maps, the probe tone (f3) required to generate the DPOAE2ry and a fourth tone (f4) necessary for eliciting IRAs were digitally synthesized and mixed on the f1 and f2 channels, respectively. It is important to emphasize that in all cases, including the acquisition of f2/f1 ratio functions, L/P maps, and IRAs, the DPOAE and DPOAE2ry were measured simultaneously from the same ear-canal spectrum.
Each stimulus presentation was ramped on and off with a cosine function for 4.54 ms, with a delay of 5.67 ms after the ramp before A/D sampling of the microphone signal began. The computer time used to generate, digitize, and analyze each stimulus presentation was of significant concern, especially for the longer L/P-map and IRA-test protocols consisting of large numbers of data points. While the A/D conversion rate was generally kept at 44.1 kHz, the number of data points per sample and number of samples averaged together were varied to achieve different goals for each of the species tested. For rabbits that were tested while awake and were well habituated to the data-collection process, the amount of time each test took was of less concern than noise rejection, which could only be conducted after each sample was acquired. Thus, for rabbits, the number of points per sample was generally kept at 4096, while the number of samples averaged in the time domain for each data point was varied.
Gerbils were tested while anesthetized, so noisy measurements were not generally a problem, and more points per sample with no averaging were used to reduce the time required for each test. The one experienced human subject was very quiet, so again, more points per sample with less averaging were used for the longer tests to reduce the overall test time. Points per sample ranged from 4096 to 32,768, which resulted in a range of individual stimulus lengths from 110 to 754 ms, and the number of time averages varying from 1 to 32. Control experiments utilizing these different parameters uncovered little difference in the DPOAE properties measured but significant improvements in either test time, signal-to-noise ratio, or noise rejection. For the DPOAE and DPOAE2ry f2/f1 ratio functions collected at DP = 18 kHz in Figure 5, the sample rate was set to 176.4 kHz to facilitate measurements at this higher frequency.
FIG. 5.
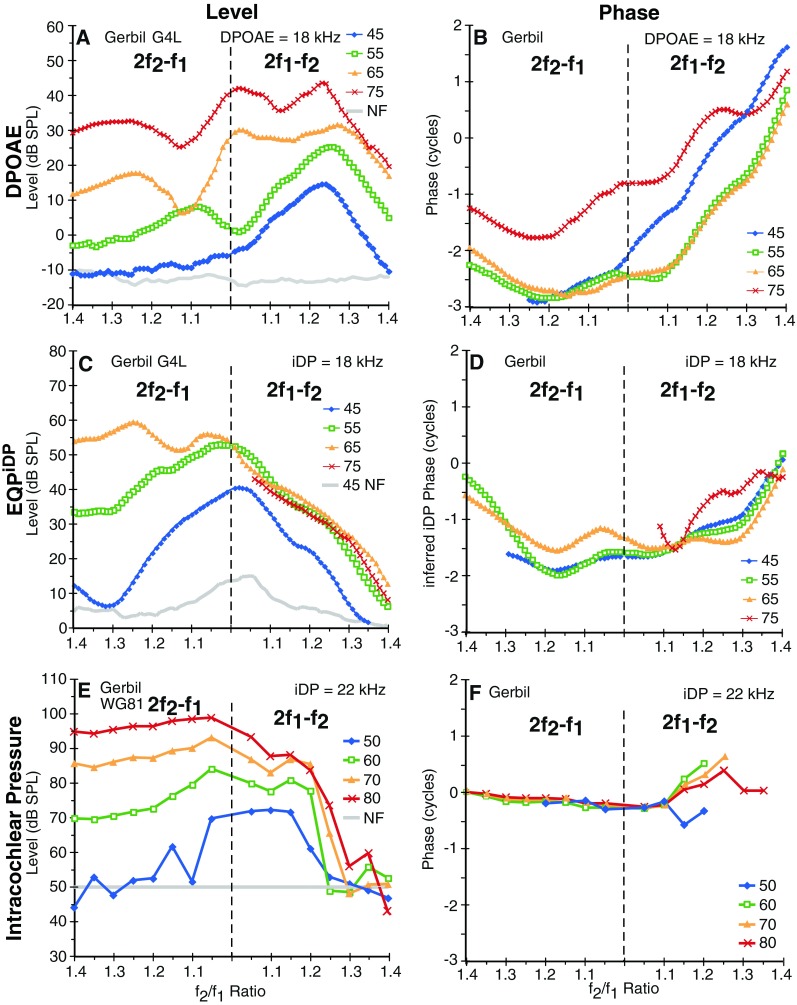
Simultaneously collected high-frequency gerbil ear-canal DPOAEs and EQPiDP f2/f1 ratio functions at a range of primary levels in A–D are compared with similar functions collected directly from intracochlear-pressure sensors near the BM in a different gerbil (E, F). While the ear-canal DPOAE functions generally peaked at optimal f2/f1 ratios around 1.25 in A, and were accompanied by rapid phase changes depicted in B, the EQPiDP level functions in C peaked at narrow ratios for lower-level primaries and plateaued in response to higher-level primary tones for the 2f2-f1 while being accompanied by relatively more constant phases in D. The highest 75-dB SPL level EQPiDP (red line) could not be determined for 2f1-f2 at f2/f1 ratios <1.05 and for 2f2-f1, since the corresponding DPOAE2ry measures were suppressed to the NF for this higher primary-tone level condition. The direct intracochlear-pressure measurements in E and F look more similar to the inferred iDP functions in C and D than to the ear-canal DPOAE functions in A and B.
Noninvasive Measurement Technique
The noninvasive technique designed to infer the behavior of iDPs used a fixed-level f3-probe tone interacting with the iDP of interest to generate another emission termed the DPOAE2ry. The behavior of the DPOAE2ry was then used to infer the properties of the iDP. It should be noted that the terminology used to describe these studies can be confusing, because in terms of frequency, the DPOAE and iDP are at the same frequency, but the iDP is presumably present on the BM. We use DPOAE and DPOAE2ry to refer to DPs measured in the ear canal and iDP for the intracochlear counterpart of the DPOAE. In the present study, the f3-probe tone was placed at a DP/f3 ratio of 1.25 (or 1.21 in the case of the human subject) to evoke a DPOAE2ry at 2f3-(2f1-f2) or 2f3-(2f2-f1).
Figure 1A illustrates the arrangement of the primary tones (f1, gray, and f2, black) and f3 (green) and their relationship to the 2f1-f2 iDP (blue) and iDP2ry (red). For DPOAE f2/f1 ratio functions, the primary tones were changed in frequency to alter the f2/f1 ratio as represented by the gray (f1) and black (f2) arrowheads in Figure 1A, while the 2f1-f2 iDP or 2f2-f1 iDP (not shown), f3, and iDP2ry remained fixed in frequency. The “telescope man” shown at the bottom of Figure 1A represents the intracochlear-pressure sensor, while the DPOAE (blue text) and DPOAE2ry (red text) at the left of the illustration are the emissions measured in the ear canal.
FIG. 1.

Diagram showing the relationship of the various stimuli (not to scale) employed in the noninvasive method and procedures designed to determine the ear-canal pressure of an external tone (EQPiDP) that yielded a DPOAE2ry equivalent to that generated by the iDP. A The primary tones (f1 and f2, black and gray waveforms, respectively) generate DP components that simultaneously propagate in the forward direction to create an iDP (blue waveform) on the BM and in the reverse direction to the ear canal to appear as the DPOAE of interest (blue text at far left). A third tone f3 (green waveform) interacts with the iDP to generate both a secondary forward propagating iDP (iDP2ry, red waveform) and reverse propagating components measurable in the ear canal as DPOAE2ry (red text at far left). The behavior of the DPOAE2ry is then used to infer the properties of the iDP. The telescope man at the bottom of A represents the intracochlear-pressure sensor used to directly measure the behavior of the iDP. B The relationships of the various stimuli and DPs plotted at their frequencies on a logarithmic-frequency axis for both a standard 1.25 and narrow 1.05 f2/f1 ratio condition that comprised some of the comparisons made in this study for both the 2f1-f2 and 2f2-f1 DPOAEs. Note that for f2/f1 ratio functions, only the primary tones are adjusted in frequency on these plots. C, D The suppression correction and “lookup” procedures, respectively, used to determine the final value of EQPiDP, which can be compared to the measured iDP pressure in A. See text for complete details of this and other illustrations.
Figure 1B shows the frequency spacing of the various tones and DPOAEs on logarithmic frequency axes for a standard ratio of f2/f1 = 1.25 and a narrow ratio of 1.05 for both 2f2-f1 (left) and 2f1-f2 (right) emissions. The four panels of Figure 1B are arranged to line up with the DPOAE f2/f1 ratio functions shown in Figure 2. For the 2f1-f2 DPOAE at an f2/f1 of 1.25 (far right panel), the various DPOAEs and tones were well separated. However, at an f2/f1 ratio of 1.05 (two middle panels), the primary tones were much closer to the 2f1-f2 or 2f2-f1 DPOAE. For the 2f2-f1 DPOAE at an f2/f1 ratio of 1.25 (far left panel), f3 (green bar) was actually between the two primaries and very near the f2 place. Note again that in all cases, the f3, DPOAE, and DPOAE2ry remained fixed in frequency. Finally, it can be seen that at narrow f2/f1 ratios (middle panels), the primary tones were very close to the iDP place in the cochlea (same frequency as the DPOAE in blue), so that depending on their level, they could be expected to influence the iDP place and suppress the generation of DPOAE2ry.
FIG. 2.

Plots of f2/f1 ratio functions for a rabbit (A), gerbil (B), and a human (C) obtained for DPOAE frequencies and primary-tone levels indicated in the upper right portion of each plot. All magnitude plots (A–C) show the DPOAE (blue line), DPOAE2ry (red line), DPOAE2ry corrected for suppression (gray line), and the EQPiDP (thin black line). For all species, the DPOAE peaked at f2/f1 ratios of ~1.2–1.25 and systematically decreased in level as the narrowest ratio condition was approached. In contrast, DPOAE2ry, its level corrected for suppression, and the EQPiDP continued to increase or did not show significant decreases at narrow f2/f1 ratios, thus implying significant differences between ear-canal DPOAEs and inferred iDPs. The plot in D shows the phase behavior for the ear-canal DPOAE (blue lines) as compared to that of the phase estimated for the iDP (thin black lines). While the phase of the ear-canal DPOAE for all three species varied rapidly with the f2/f1 ratio, the phase of the inferred iDP was more constant, especially for the animal subjects. Note that the phase values for the gerbil and human have been shifted down by two and four cycles, respectively, to facilitate comparisons between species on the same plot.
DPOAE and DPOAE2ry f2/f1 Ratio Functions
DPOAE and DPOAE2ry ratio functions for the 2f1-f2 and 2f2-f1 DPOAEs were measured with L1 = L2 primary-tone levels from 35–75-dB sound pressure level (SPL) in 5-dB steps for rabbits and gerbils, and with L1 = L2 primary-tone levels from 45–75-dB SPL in 10-dB steps, and at L1/L2 = 65/55 dB SPL for the human subject, while the f2/f1 ratio was varied from 1.01 to 1.5 in 0.01 interval steps. It should be noted that when collecting the f2/f1 ratio functions, sweeping past a ratio of 1.0 reversed the sense of the f1 and f2 primaries, so that the 2f2-f1 became the emission being measured. During the collection of these DPOAEs, a 50 dB SPL f3 was placed at an iDP/f3 ratio of 1.25 to evoke the DPOAE2ry, while for the human subject, a 65 or 70 dB SPL f3 was placed at an iDP/f3 ratio of 1.21 to evoke the DPOAE2ry (see the legends of Figs. 2 and FIG. 5 for complete details).
DPOAE and DPOAE2ry L/P Maps
DPOAE and DPOAE2ry L/P maps consisted of a collection of DPOAE and DPOAE2ry f2/f1 ratio functions as described above that were obtained at ratio steps of 0.025 and DP frequency steps of ~43 Hz from 0.5 to 6.0 kHz. These functions were assembled into an array of 5160 points from which DPOAE level was then directly plotted using commercial software (Microsoft, Excel for the Macintosh, v.11), while phase was corrected for primary-tone phase variation, and unwrapped by “looking” in two directions (ratio and frequency) using custom-developed spreadsheet routines before plotting. Final plots were constructed using technical-computing software (MathWorks, MATLAB, v. R2012B). The resulting DPOAE L/P maps were highly similar to those measured in humans (Martin et al. 2009) in which DPOAE magnitude and phase were plotted as a function of the f2/f1 ratio and DPOAE frequency. These maps were obtained in rabbits and gerbils for equilevel primary tones at L1 = L2 = 45, 55, or 65 dB SPL or in the human subject at L1/L2 = 65/55 dB SPL and L1 = L2 = 75 dB SPL (see legend of Fig. FIG. 3 for further details).
FIG. 3.
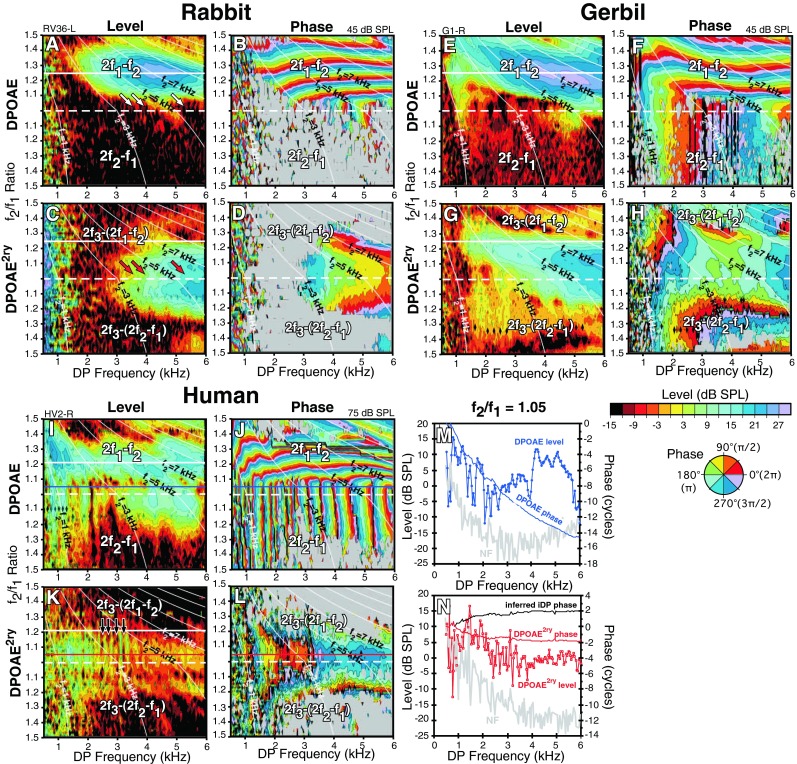
Simultaneously collected level and phase maps (L/P maps) of DPOAE and DPOAE2ry as a function of DP frequency and f2/f1 ratio for a rabbit (A–D), gerbil (E–H), and human (I–L) obtained at the primary-tone levels indicated at the upper right corner of each plot. Plots in M and N depict horizontal slices for 2f1-f2 at f2/f1 ratio = 1.05 through the human DPOAE and DPOAE2ry L/P maps demarcated by blue and red horizontal lines in I–L. The previous data in Figure 2 can be visualized as vertical slices through such L/P maps. In general, the maps show that the same properties revealed by the f2/f1 ratio functions depicted in Figure 2 are repeatable across large-frequency expanses. In addition, the maps and slices show that while DPOAE phase can vary rapidly with DP frequency, at constant narrow f2/f1 ratios, the corresponding DPOAE2ry phase was more constant along this trajectory as well.
DPOAE and DPOAE2ry IRAs
IRAs were obtained in rabbits and gerbils at an f2/f1 ratio of 1.05 for equilevel primary tones, with L1 = L2 = 45 and 55 dB SPL and at an f2/f1 ratio of 1.25 for L1 = L2 = 60 or 65 dB SPL. For the human subject, an IRA was collected at an f2/f1 ratio of 1.05 for equilevel primary tones with L1 = L2 = 75 dB SPL. In all cases, the IT (f4) was swept from 0.5 to 18.4 kHz at 20 steps/octave (oct), while it was systematically decreased in 2-dB steps, in descending order from 85 to 35 dB SPL at each frequency. In addition, the phase of the IT was rotated by 90° for each of four time averages, at each unique stimulus condition, to cancel the majority of DPOAE components produced by the introduction of f4 (Martin et al. 1999). To produce the simultaneously measured DPOAE2ry IRAs, a probe tone (f3) was placed at an iDP/f3 ratio of 1.25 for rabbits and gerbils and at 1.21 for the human subject. For IRAs, the primary-tone frequencies, the f3-probe frequency, and the resulting DPOAE and DPOAE2ry remained fixed, while the IT was swept through the frequency/level space (see legend of Fig. FIG. 4 for further details).
FIG. 4.
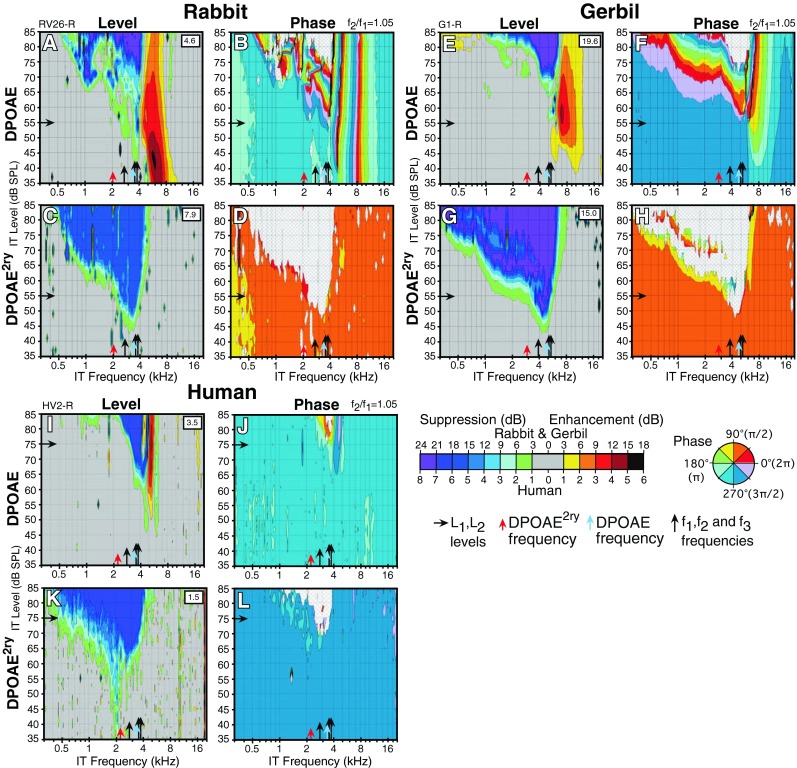
Simultaneously collected interference-response areas (IRAs) showing level and phase variations for a fixed 2f1-f2 at f2/f1 = 1.05 DPOAE and corresponding DPOAE2ry in response to an IT presented at all the levels and frequencies indicated on the axes for a rabbit (A–D), gerbil (E–H), and human (I–L). The control level in dB SPL of the ear-canal DPOAE or DPOAE2ry without the IT is indicated within the white square in the upper right-hand corner of each level plot. In general, DPOAEs at these narrow f2/f1 ratios showed level enhancements accompanied by phase changes in response to ITs above f2, while their DPOAE2ry counterparts showed no such changes. Overall, these findings support the notion that there can be substantial differences between the behavior of the DPOAE as compared to that of a simultaneously measured DPOAE2ry.
Data were collected in a matrix of frequency/level combinations, in which the amount of suppression was calculated relative to the control DPOAE level in the absence of the IT. The IRA data are displayed as contour plots (Microsoft, Excel for the Macintosh, v.11), in which successive contours represent increasing iso-suppression or iso-enhancement, in 3-dB steps for rabbit and gerbil and in 1-dB steps for the human subject. Similar algorithms were used to obtain contour plots of DPOAE-phase changes in the presence of the IT. Final plots were constructed using the technical-computing software noted above (MathWorks, MATLAB, v. R2012B).
Intracochlear-Pressure Measurements
Intracochlear-pressure measurements were made in deeply anesthetized gerbils. Details of these procedures have been described extensively elsewhere (Olson 1999; Dong and Olson 2005, 2008). Briefly, for these measurements, a micropressure sensor of ~125 μm in diameter was advanced into scala tympani of the basal turn through a small hand-drilled hole in the cochlear wall. The sensor was advanced to within about 10 μm of the BM in a region with CFs in the 18–22 kHz range. The sensitivity of the sensors was flat to within a few decibels up to at least 40 kHz. Since the micropressure sensor was fixed in location, f2/f1 ratio functions were obtained by adjusting the iDP frequency to the CF of the sensor location and sweeping the f1 and f2 tones. Responses of single tones in intracochlear pressure were compressive in healthy, sensitive preparations (see Fig. 2; Dong and Olson 2013) but became linear in abnormal cochleae. This behavior is indicative of a “local” response and was highly similar to that described for responses measured from microbeads placed directly on the BM (Robles and Ruggero 2001). To elaborate, there is a background pressure applied to the cochlear partition by the driving force of the stapes, known as the compression pressure (CP) that is approximately instantaneous and spatially invariant. This pressure would be detected when measuring near the oval window remote from the BM. The CP appears to be relatively unimportant for cochlear micromechanics, because it causes little BM vibration (Robles and Ruggero 2001) and neural excitation at only very high sound levels (Huang and Olson 2011). Intracochlear pressure in scala tympani (PST), measured by the pressure sensor, reflects the summed pressures of the CP and the traveling wave (TW) pressure at each location. Depending on the measurement site, either the TW or CP can dominate. In the present circumstance, when the micropressure sensor was positioned close to the BM (about 10 μm), PST was dominated by the pressure of the TW as fluid particles moved in concert with the BM (Olson 1998).
Assessing Effects of f3
It was possible that the presence of the f3-probe tone used to produce the DPOAE2ry by interaction with the iDP may have had significant effects on the DPOAE f2/f1 ratio functions via suppression between it and the primary tones. To test for this confounding possibility, f2/f1 ratio functions were collected with and without the f3 tone being present for all three species using the parameters detailed above. The outcome of these experiments revealed that the f3-probe tone had essentially no effects on DPOAE f2/f1 ratio function levels or phases, for primary-tone levels ranging from 35 to 75-dB SPL for f2/f1 ratios less than ~1.25. However, for f2/f1 ratios > 1.25, DPOAEs elicited by lower-level primary tones were sometimes, for some unknown reason, increased by up to 10 dB. If there were suppressive effects among the two primary tones and the f3 probe, these effects were not sufficient to alter the ear-canal DPOAE for f2/f1 ratios less than or equal to ~1.25, the primary region of interest in these experiments.
Estimating Effects of Suppression on DPOAE2ry
Higher-level primary tones can exert significant suppressive effects on the generation of the DPOAE2ry (e.g., Shera and Guinan 2007). This effect is likely due to the proximity of the primaries to the iDP, especially at narrow f2/f1 ratios (see middle panels of Fig. 1B). After a given experiment was completed, these suppressive effects were estimated and corrected for. This procedure is illustrated in Figure 1C and described below and was similar to that described by Shera and Guinan (2007). Specifically, an external tone at the iDP frequency and at a level 15 dB less than the f1 primary-tone level used in the measurements was presented together with the f3 used in the measurements. This level was chosen because at an f2/f1 ratio of 1.25 in the animals and 1.21 in humans, where presumably suppression by the primaries is minimal, an external tone 15 dB less than the primary levels created an emission at the DPOAE2ry frequency with a level that was roughly equivalent to that produced by the 2f1-f2 iDP. The ratio experiment was then repeated using only the one primary closest to the iDP, i.e., f1 for the 2f1-f2 or f2 for the 2f2-f1. This arrangement amounted to replacing the iDP (same frequency as the DPOAE indicated by solid blue circles in Fig. 1B) by a tone scaled to the primary-tone level to create a simulated DPOAE2ry. The level of the simulated DPOAE2ry was then measured as the closest primary traversed the same frequencies required to acquire the original ratio functions, while the variation in the simulated DPOAE2ry (open red squares in Fig. 1C) was recorded. Changes in the level of this simulated DPOAE2ry from the unsuppressed control level (horizontal gray dashed line in Fig. 1C) were used to correct the level of the actual measured DPOAE2ry, for suppression at each point on the f2/f1 ratio function. In other words, if the simulated DPOAE2ry was reduced by 3 dB at one point on the ratio function, then the measured DPOAE2ry made by the interaction of f3 with the iDP at this point on the ratio function was corrected for suppression by adding 3 dB.
Inferring Level and Phase of iDP
Although the iDP level and phase could obviously not be measured directly using the noninvasive technique, the goal was to develop a method to estimate these quantities. These estimates were based upon the assumption that a DP is generated in the region of the interaction of the two primary tones on the BM and then travels to the fdp place. At this point, the DP is for all practicable purposes indistinguishable from a pure tone introduced externally and adjusted in level and phase to match the internally generated iDP. Because the iDP interacts with the f3 probe to produce the DPOAE2ry, the logic was that if an external tone was introduced at fdp and its level adjusted to produce an equivalent DPOAE2ry, then the external tone would be roughly equivalent in level to the iDP on the BM, excluding corrections for middle-ear gain. For example, in the gerbil, one would need to add roughly 25–30 dB to infer the actual level of the iDP measured in intracochlear pressure near the BM at that place (Dong and Olson 2006). In actuality, this procedure yields the equivalent ear-canal pressure, hereafter termed EQPiDP that produces a DPOAE2ry equivalent to that generated by the iDP.
Figure 1D illustrates the final procedure for arriving at the value of EQPiDP. With the primary tones turned off, the level of the f3-probe tone was kept constant at the levels noted above for each species (green bar in Fig. 1B), and a tone was placed at the iDP frequency (same frequency as the DPOAE solid blue circle in Fig. 1B) and incremented in 1- or 2-dB steps from −10 to 75 dB SPL to generate a simulated DPOAE2ry growth function (red squares in Fig. 1D) with f3. The linear portion of this growth function was fit with a linear least squares regression line (thin black line). The level of the measured DPOAE2ry corrected for suppression at each f2/f1 ratio was matched to the level of the simulated DPOAE2ry on the ordinate (origin of gray arrow in Fig. 1D), which was then used to “look up” the level of a tone (EQPiDP black arrow) on the abscissa that yielded a DPOAE2ry equivalent to that generated by the iDP. This value was assumed to generally approximate the actual level of the iDP on the BM but was not corrected for middle-ear gain. To infer the actual level of the iDP on the BM, one would need to correct the EQPiDP by the middle-ear transfer function for each species.
The inferred phase of the iDP was based upon the following assumptions. The measured phase of DPOAE2ry can be characterized by the formula . From this expression, the unknown phase of the iDP can be calculated by the formula . When referenced to the measured phases of the primary tones at the microphone probe in the ear canal, the final corrected phase of the iDP was computed by the following expression: . This operation resulted in the estimated phase of the iDP being the additive inverse or negative of the DPOAE2ry phase.
RESULTS
DPOAE and DPOAE2ry f2/f1 Ratio Functions
Figure 2A–C shows f2/f1 ratio functions obtained for a representative rabbit (A), gerbil (B), and human (C). The raw data for ear-canal DPOAEs (blue lines) are compared to their counterpart DPOAE2ry measures (red lines). In all cases, the 2f1-f2 DPOAE peaked at an optimal ratio that was approximately 1.25 for the rabbit and gerbil and 1.21 for the human subject. Then, for all species, this function significantly decreased as the f2/f1 ratio approached 1.0. In contrast, as the f2/f1 ratio decreased, the DPOAE2ry continued to either grow or reach a plateau around 1.0. When the DPOAE2ry was corrected for suppression effects (gray squares), this increase at narrow f2/f1 ratios was even more pronounced, especially for the rabbit (Fig. 2A). Thus, for all three species, the DPOAE showed a decrease in level at narrow ratios, while the DPOAE2ry continued to increase in magnitude or plateau, thus suggesting that the iDP on the BM behaved differently than the simultaneously measured emission in the ear canal.
The uppermost curves (thin black lines) in Figure 2A–C represent the EQPiDP, that is, the equivalent ear-canal pressure of a tone required to yield a DPOAE2ry equivalent to that generated by the iDP based upon the procedures described above in the “Methods” section. Even without correcting for middle-ear gain, the inferred intracochlear iDP maximum was 35–45 dB SPL, which was substantially larger than the maximum measured in the ear canal as a DPOAE. It is interesting to note that the EQPiDP level for the human subject (Fig. 2C) was even larger still as compared to the measured levels of the DPOAE and DPOAE2ry.
Finally, it should be noted that at higher primary-tone levels above about 60–65 dB SPL (not shown), the DPOAE ratio function in the gerbil and rabbit did not show a significant decrease in level at narrow ratios, presumably because at these levels, DPOAE generation was more widely distributed. Additionally, at these higher primary-tone levels, the DPOAE2ry decreased at narrow ratios and could assume a similar inverted U-shaped function likely due to suppression of the DPOAE2ry generators by the more intense primary tones.
The final panel in Figure 2D plots the relative phase of the ear-canal DPOAE (blue lines) compared to the inferred phase of the iDP (thin black lines) for all three species. The phase values for gerbil and human have been shifted down by two and four cycles, respectively, to facilitate comparisons on the same plot. Based on the equation presented above in the “Methods” section, the iDP phase is assumed to be the additive inverse, i.e., the negative of the phase of DPOAE2ry; thus, the shape of the phase curves are the same but simply inverted. That is, the DPOAE2ry curves (not shown) bow upward in the middle, while the inferred iDP phase curves depicted in Figure 2D bow down. As is typical, the ear-canal DPOAE showed a steep phase slope for 2f1-f2 at f2/f1 ratios >1.1, and a relatively flat phase slope for 2f1-f2 at f2/f1 ratios <1.1, and at all ratios for the 2f2-f1 DPOAE. In contrast, the inferred phase of the iDP was very flat for the rabbit and gerbil and more bowl-shaped for the human subject.
These relationships can also be appreciated if a series of vertical slices are examined through the DPOAE2ry-phase plots shown for the human subject in Figure FIG. 3J, L. Here, the phase of the 2f1-f2 DPOAE changed rapidly across the horizontal phase bands as shown in Figure FIG. 3J, but the bands became vertical at narrow ratios and retained this property for the 2f2-f1 DPOAE shown in the lower portion of the plot. By comparison, the phase of DPOAE2ry shown in Figure FIG. 3L was relatively flat (constant color) along a similar trajectory.
DPOAE and DPOAE2ry L/P Maps
Figure FIG. 3 illustrates representative DPOAE and DPOAE2ry L/P maps for the same three species as shown in Figure 2. These L/P maps are simply a collection of f2/f1 ratio plots measured as a function of DP frequency and transformed into contour plots representing the level and phase changes, respectively. From these plots, it is clear that the basic features of the f2/f1 ratio functions hold across a large expanse of DPOAE and DPOAE2ry frequency space. For example, in the rabbit (Fig. FIG. 3A), the DPOAE was mostly at noise floor (NF) levels for narrow f2/f1 ratio stimuli (slanted white arrows above dashed horizontal line), while the DPOAE2ry was large for these same conditions (red arrows in Fig. FIG. 3C). Similar observations were noted for the gerbil DPOAE as shown in Figure FIG. 3E as compared to the DPOAE2ry depicted in Figure FIG. 3G. In the L/P maps shown for the human subject in Figure FIG. 3I, K, the large DPOAE2ry at narrow f2/f1 ratios was not as apparent, likely because of the previously noted generally smaller DPOAEs in humans and because the L/P maps were not corrected for suppression effects. That is, the 75 dB SPL primaries that were required to obtain robust L/P maps in the human subject likely suppressed DPOAE2ry generation. In addition, the human DPOAE2ry uniquely shows evidence of interference from the much larger human DPOAE-reflection components likely produced in the DPOAE2ry-generation process as evidenced by periodic vertical notching (straight-down black arrows around the solid white line in Fig. FIG. 3K).
For all species, 2f1-f2 DPOAEs at f2/f1 ratios >1.1, phase was horizontal and relatively constant or flat for a given f2/f1 ratio vs DPOAE frequency, except for the more apical regions (upper left-hand corners of the phase plots) as depicted in Figure FIG. 3F for a gerbil and Figure FIG. 3J for the human. For the DPOAE2ry, the phase for a given f2/f1 ratio as a function of DP frequency was relatively flat for all f2/f1 ratio settings and even at narrow ratios (i.e., <1.1), whereas when the DPOAE was above the NF on this lower part of the map, phase was typically steep for ear-canal DPOAEs. Here, such a finding is more clearly illustrated in Figure FIG. 3M, N (lower right), which shows horizontal slices through the human maps at a constant 2f1-f2 at f2/f1 ratio of 1.05 (solid blue lines in Fig. FIG. 3I, J and solid red lines in Fig. FIG. 3K, L). In Figure FIG. 3M, DPOAE phase was steep (blue line), but in contrast, the phase of the DPOAE2ry as indicated in Figure FIG. 3N (red line) was relatively flat. Based on the equation described in the “Methods” section, the inferred phase of the iDP was estimated as the negative of the phase of the DPOAE2ry, which remained relatively flat and is represented by the black curve in Figure FIG. 3N.
DPOAE and DPOAE2ry IRAs
Figure FIG. 4 illustrates narrow f2/f1 ratio (1.05) IRAs for a rabbit, gerbil, and human, where an f4 or IT was swept in level and frequency, while the f1, f2, f3, DPOAE, and DPOAE2ry were held constant at the frequencies and levels indicated by black arrows on the abscissa and ordinate, respectively. In these IRA plots, the amount of suppression/enhancement is depicted as color contours. Since changes in DPOAE and DPOAE2ry levels were measured simultaneously in response to the IT, the IRA plots provide a means for inferring differences in the suppression/enhancement patterns of the ear-canal DPOAE and the inferred iDP on the BM. When the IT was presented above f2, it often produced a region of strong enhancement (yellow to orange colors) for the ear-canal DPOAE (Fig. FIG. 4A, E, I) accompanied by significant phase changes (Fig. FIG. 4B, F, J) as is typical for all three species at narrow f2/f1 ratios. This phenomenon was especially apparent for the rabbit as shown in Figure FIG. 4A, B and gerbil in Figure FIG. 4E, F and to a lesser extent for the human (Fig. FIG. 4I, J). In contrast, IRAs measured simultaneously for DPOAE2ry (Fig. FIG. 4C, G, K) evidenced no signs of enhancement or suppression of emissions in the region where the corresponding ear-canal DPOAE was strongly enhanced, thus indicating that there are apparently significant differences in the behavior of the inferred iDP compared to that of the DPOAE2ry in response to ITs presented above f2. Although robust phase measures were obtained over most of the IRAs, when the DPOAE or DPOAE2ry was suppressed to NF levels indicated by a gray hatch pattern on the phase plots, phase could not be measured over the IT frequencies and levels that corresponded to these regions.
DISCUSSION
DPOAEs vs iDPs
As noted above, a large literature exists describing DPOAEs measured in the ear canal, but relatively little information is available about their counterpart iDPs that exist simultaneously within the cochlea. A common view is that iDPs are primarily generated in the overlap region of the f1 and f2 primary tones, i.e., near the peak of the f2-TW. Under this condition, the iDPs then concurrently propagate as TWs to the fdp place on the BM and as reverse TWs to appear as DPOAEs in the ear canal (e.g., Shera and Guinan 1999). However, the mechanism for reverse propagation is still being intensely debated (e.g., Ren 2004; Shera et al. 2006; Dong and Olson 2008; He and Ren 2013). The substantial differences in the response of iDPs and DPOAEs to the same acoustic stimulations are not generally appreciated nor are the underlying mechanisms fully understood.
The most common experimental condition under which these differences become apparent is the behavior of DPOAEs vs iDPs when the frequency separation between the primaries as indicated by the f2/f1 ratio is decreased from a typical optimal value of 1.2–1.25 toward 1.0. In this instance, DPOAE magnitude peaks at the wider ratio settings but dramatically decreases in level at narrow f2/f1 ratio values. Although originally thought to be representative of a type of cochlear filter (e.g., Allen and Fahey 1993), recently, it has been shown that this inverted U-shaped function likely occurs because of cancellation of distributed DPOAE wavelets of differing phases at narrow f2/f1 ratios (e.g., de Boer et al. 2005; Fahey et al. 2006). In contrast, the directly measured BM data previously mentioned suggest that the iDP continues to increase in level at these same narrow ratios, thus suggesting that the wavelets traveling apically toward the iDP place on the BM are of similar phase and do not cancel each other.
These general differences between DPOAEs and iDPs were supported by the present noninvasive approach in which a secondary DPOAE2ry was used to infer the behavior of the iDP. Accordingly, the DPOAE2ry and the EQPiDP continued to increase in level as the f2/f1 ratio decreased, while the simultaneously measured ear-canal DPOAE decreased toward NF levels (see Fig. 2). This phenomenon was observed across three different species and over a wide frequency range in the L/P maps of Figure FIG. 3.
The overall phase behavior of ear-canal DPOAEs vs inferred iDPs was also strikingly different. These different phase behaviors are much easier to appreciate when viewed on the L/P maps (Fig. FIG. 3). In these maps, the right-hand panels for each species represent the unwrapped phase values of the DPOAE or DPOAE2ry as referenced to the primary-tone phases in the ear canal. While the ear-canal DPOAE phase often varied rapidly as evidenced by the horizontal and/or vertical banding (Fig. FIG. 3B, F, J) and the steep phase slope depicted in Figure FIG. 3M (blue line), DPOAE2ry phase was relatively constant as shown in Figure FIG. 3D, H, L, N (red line). Since the inferred iDP phase should be the negative of the DPOAE2ry phase depicted here, the iDP phase should also be relatively constant across the maps, with the direction of phase change reversed (red vs black line in Fig. FIG. 3N).
The two different ear-canal DPOAE phase behaviors of horizontal banding for 2f1-f2 at wider f2/f1 ratios and the vertical banding when above the NF at narrow f2/f1 ratios, and for all 2f2-f1 DPOAEs, have often been interpreted as being indicative of distortion- and reflection-generator mechanisms, respectively (Knight and Kemp 2000, 2001). However Martin et al. (2010, 2011) could not extract a reflection component from maps collected with higher primary-tone levels exhibiting robust vertical banding using ITs near the DP in either rabbits or rats. Gerbils seem to be similar to these previously studied laboratory animal species; in that, reflection components from fdp place are very small or absent (unpublished observations). Although a large reflection component could be extracted from human maps (Martin et al. 2009, 2011), most of the vertical-phase banding on the map remained. However, an IT presented 1/3 oct above the f2 place largely removed these emissions and the associated vertical-phase banding in all species.
These two different ear-canal DPOAE-phase patterns on L/P maps may be, at least in part, explained by the concept that DP generation is actually a distributed process. That is, if DP “wavelets” are generated over a significant region of the overlap of the primary-tone TWs, then the overall phase reflects the summation of these wavelets and is dominated by the behavior of the largest DP components that propagate back out to the ear canal. For 2f1-f2 at wider optimal ratios, the dominant components are in the region of the maximal overlap of the f1 and f2 TWs, i.e., near the f2 place on the BM. As the f2/f1 ratio is decreased toward 1.0, the characteristic DP place on the BM moves closer to the maximum overlap, and the region 1/3 to ½ oct basal to the DP place, over which the iDP is amplified up to its place on the BM, begins to interact with DP wavelets from the overlap region. Indeed, for the 2f2-f1, the DP place is actually inside the overlap region basal to the maximum at the f2 place. In this situation, the only distributed components that propagate back to the ear canal are constrained to some critical distance above the DP place, and thus, the DPOAE begins to scale with DP frequency instead of with that of the f2. This interaction causes the phase to be constant for a given DP frequency on the map and presents as vertical banding. This concept is also helpful in explaining the large body of varied evidence in both animals and humans, indicating that 2f2-f1 DPOAE components at wide f2/f1 ratios are limited to more basal regions than their 2f1-f2 counterparts that are generated by the same set of primary tones (Martin et al. 1998). It is interesting to note that group delays calculated along equal f2 lines on the L/P maps that are noted as thin white diagonal lines in Figure FIG. 3A–L closely agree with actual time-domain onset latencies, thus indicating that 2f1-f2 DPOAEs have longer latencies than their 2f2-f1 counterparts (Whitehead et al. 1996; Martin et al. 1998; Stagner et al. 2007).
Inferring iDP phase is presented here as a deceptively simple process of mirroring DPOAE2ry phase, but in reality, the situation is far more complex. iDP phase should be the result of a summation of components forward propagating from the generation region, and it is far from a given that DPOAE2ry will accurately reflect this phase. In fact, DPOAE2ry phase is subject to the same convoluted distributed DPOAE generation, constriction and propagation processes that were just discussed above. In this context, it is quite astonishing that DPOAE2ry phase was so relatively constant on the L/P maps. Perhaps, this result can be explained by the attempt made to make the DPOAE2ry generation as straightforward as possible. That is, the ratio between the iDP (the DPOAE2ry “f2”) and f3 (the DPOAE2ry “f1”) was always kept constant at the optimal setting for each species (i.e., at 1.25 for rabbits and gerbils or 1.21 for the human subject). At the optimal f2/f1 ratio setting, DPOAE phase is relatively constant across DP frequency, except for at the “nonscaling” cochlear apex, for f2 frequencies <~3 kHz (Fig. FIG. 3F, J). Indeed, the somewhat steeper slope for the DPOAE2ry and the inferred iDP for DP frequencies <~2 kHz in Figure FIG. 3N was likely due to the effects that this nonscaling region had on DPOAE2ry generation and may have had nothing to do with the actual phase variation of the iDP. Similarly, the “bowl”-shaped f2/f1 functions for iDP phase depicted in Figure 2D are somewhat suspect as well. What seems certain is that the phase of iDP on the BM must vary far less than the corresponding DPOAE phase out in the ear canal, a result that is consistent with the few direct measurements of iDP phase on the BM or near the BM in intracochlear pressure (Dong and Olson 2005).
The underlying cochlear mechanics that can explain such differences in the ear-canal DPOAE vs iDP behaviors are not well understood. However, Shera and Guinan (2007) also utilized this noninvasive method in conjunction with f2/f1 ratio functions in an attempt to better understand why Allen-Fahey experiments fail to detect the cochlear amplifier. Based on their results, they went on to develop a transmission line model where rapid phase changes imparted to DP wavelets at narrow f2/f1 ratios resulted in a type of beamforming, where DP wavelets directed into the cochlea added in phase, while wavelets directed toward the ear canal canceled. This cancellation in the ear-canal direction produces the familiar inverted U-shaped DPOAE f2/f1 ratio function, while the in-phase additions in the apical direction explain the observation that iDPs continue to increase in level under identical circumstances.
The notion that DPOAE components can be either in addition or cancellation was previously suggested as an explanation (Martin et al. 1999, 2003) for the suppression/enhancement in ear-canal DPOAEs produced by ITs placed within a range of frequencies above f2. These early suggestions were reinforced by the findings of recent studies demonstrating that DPOAE components generated basal to f2 can obscure cochlear damage (Martin et al. 2010) or show strong evidence for cancellation at narrow f2/f1 ratios when observed in the time domain (Martin et al. 2013).
The present IRA findings measured simultaneously for DPOAE and DPOAE2ry emissions strongly support the notion that at narrow f2/f1 ratios, ear-canal DPOAEs are in cancellation, and this cancellation can be upset by presenting an IT above f2. Thus, the IT produced DPOAE enhancements (see Fig. FIG. 4), which were associated with large-phase changes in the related DPOAE. However, no evidence of a change in the corresponding DPOAE2ry was observed, which purportedly reflects the behavior of the iDP on the BM. It would be expected that distributed DP components generated basal to the f2 place would propagate both apically and basally. Therefore, suppression of these components ought to show up in the DPOAE2ry as well as the DPOAE. For some unknown reasons, these components either do not seem to travel to their frequency place on the BM, or if they do, they are very small in comparison to the much larger components from the peak overlap region and leave no evidence of their existence. It was possible that such small changes remained undetected due to the 1-dB (human) or 3-dB (rabbit and gerbil) resolution of our contour plots. However, when we looked for changes as small as 0.1 dB, there was no suppression or enhancement in the DPOAE2ry collected simultaneously, while the DPOAE showed large (12 dB or more) enhancements.
If the IT produced an emission to cause the observed DPOAE enhancement as hypothesized by Fahey et al. (2000), then this component similarly should travel to the fdp place to produce a measurable change in the iDP that would be reflected by the DPOAE2ry. Again, any evidence for this type of action was never observed in the present study, which otherwise is consistent with the notion that at narrow f2/f1 ratios, ear-canal DPOAEs are largely in cancellation. Overall, these outcomes likely depend upon the distributed nature of DPOAE components, which can explain a variety of DPOAE observations [see discussion in Martin et al. (2010)], such as the paradoxical enhancements of DPOAEs sometimes seen after damaging noise exposures, the complex onsets for DPOAEs in the time domain at narrow f2/f1 ratios, the aforementioned apparent difference between 2f1-f2 and 2f2-f1 DPOAE generation regions, the failure of DPOAEs elicited by mid- to high-level primaries to detect restricted cochlear damage, and the improved performance of these same DPOAEs when collected in the presence of an IT 1/3 oct above the f2 frequency.
Finally, it is well known that humans generally have much smaller DPOAEs for a given set of primary-tone levels than most common laboratory species including the gerbils and rabbits tested here. The reasons for this difference among mammals have never been fully elucidated but may involve differences in middle-ear transfer functions both into and out of the cochlea and possibly interference from the much larger emission-reflection components commonly observed for human DPOAEs. The data presented here indicate that inside the cochlea at the DP place on the BM, inferred human iDPs are much larger than their ear-canal DPOAE counterparts and implicate the processes responsible for the reverse propagation of the emission out of the cochlea as one potential cause for the relatively smaller human DPOAEs. Another possible explanation for the relatively smaller human DPOAEs is increased phase cancellation among reverse DP wavelets due to the relatively steeper intracochlear phase gradients (longer delays and shorter wavelengths) in humans. As a result, the beamforming in humans may be stronger and more directional. Figure 2D provides evidence of these steeper phase gradients in the current data that would support this hypothesis.
Validity of Noninvasive Technique
It appears that the noninvasive method supports observations of significant differences between DPOAEs and iDPs that can be gleaned from several BM studies published in the literature. At least three studies (Cooper and Rhode 1997; Rhode and Cooper 1997; Robles et al. 1997) examined the effects of the f2/f1 ratio on the 2f1-f2 iDP with the iDP centered at the CF of the BM preparation. In these instances, the iDP generally increased in level as the f2/f1 ratio decreased, which was similar to observations for the noninvasive measures of the 2f1-f2 iDPs in Figure 2. Some of the clearest examples analogous to the present methods can be seen in Figures 6 and 7 of Robles et al. (1997). Similar f2/f1 ratio functions were also obtained by Rhode (2007), even when the CF of the BM site was at f2, i.e., near the iDP site of generation. However, the noninvasive technique presently suffers from the fact that its accuracy and sensitivity have never been verified by simultaneous measures of the intracochlear iDP and the corresponding ear-canal DPOAE. In an attempt to approximate this scenario, Figure FIG. 5 compares ear-canal DPOAE (Fig. FIG. 5A) and EQPiDP (Fig. FIG. 5C) f2/f1 ratio functions obtained at 18 kHz for a range of primary-tone levels using the noninvasive method in a gerbil to prior determinations of a different gerbil’s iDP f2/f1 ratio function measured in intracochlear pressure at 22 kHz (Fig. FIG. 5E), with the latter having been obtained by one of the authors (WD). Here, it is clear in Figure FIG. 5A that at lower stimulus levels, i.e., at 45- (blue line) and 55-dB SPL (green line), the ear-canal DPOAE exhibited the typical inverted U-shaped f2/f1 ratio function. However, at higher levels of the primaries, i.e., at 65 and 75 dB SPL (solid orange and red lines in Fig. FIG. 5A, respectively), as mentioned previously, the DPOAE presumably comes from a broader cochlear region and no longer shows the inverted U-shaped function. For the noninvasive iDP method illustrated in Figure FIG. 5C, the EQPiDP continued to grow in magnitude as the primary tones were brought closer together. This behavior compares very favorably with similar measures of the iDP using the intracochlear-pressure magnitudes illustrated in Figure FIG. 5E. In addition, for 2f1-f2, the growth of the iDP with increasing primary level saturated as indicated by the overlapping curves for the higher primary levels in both the noninvasive and intracochlear-pressure measures of Figure FIG. 5C, E (right-hand sections of plots), respectively, while in this instance, the corresponding DPOAE measures shown in Figure FIG. 5A did not. While DPOAE measures often saturate at higher primary-tone levels, the saturation and growth rate of the noninvasively inferred iDP were often quite different from the ear-canal DPOAE and might more accurately and specifically reflect the BM nonlinearity. As described previously, the corresponding DPOAE phases were steep, as shown in Figure FIG. 5B, while the phases of the estimated iDP of Figure FIG. 5D were relatively flat and more similar to those of the iDP measured in intracochlear pressure (see Fig. FIG. 5F).
Overall, it appears that the noninvasive method presented here agrees reasonably well with direct measures of the iDP using intracochlear-pressure sensors. When corrected for suppression and transformed to EQPiDP, the magnitude was 20–30 dB larger than that measured conventionally in the ear canal. This sizable magnitude was supported by measures of intracochlear pressure where the iDP ranged from about 60 to 95 dB SPL for similar primary-tone levels. This was, on average, ~30 dB larger yet than the noninvasively inferred EQPiDP levels as shown in Figure FIG. 5E. The typical gerbil middle-ear transmission gain is approximately 25 to 30 dB (Dong and Olson 2006) and can account for this difference.
Advantages and Disadvantages of Noninvasive Approach
The most obvious benefit of the present technique is that it provides a means of noninvasively inferring the activity of DPs present as mechanical excitations on the BM. Although iDPs can be directly observed by laser vibrometry (e.g., Robles et al. 1997) or measures of intracochlear-fluid pressure (e.g., Dong and Olson 2005), such invasive techniques suffer from some important limitations. For example, the intrusive surgical methods needed to record these measures can only be performed in species in which physical access to the BM is possible. Moreover, the surgical approaches required are typically restricted to the basal, high-frequency cochlear region, and rarely can access the low-frequency apical areas except in the chinchilla (e.g., Cooper and Rhode 1997). Thus, because of the surgical complexity of direct intracochlear techniques, physiologically sensitive preparations are difficult to achieve. In contrast, the noninvasive method utilized here can be used to infer iDP activity that is tuned essentially to any CF region in most laboratory species and, as demonstrated here, can be performed in humans as well. In addition, the noninvasive method can be conducted at very low sound-pressure levels for long time periods and does not suffer from the eventual loss in sensitivity due to surgical trauma.
As compared to ear-canal DPOAEs, DPOAE2ry measures can be used at narrow f2/f1 ratios, while the DPOAEs in response to lower primary-tone levels at these ratios are typically in cancellation and not measurable. However, in spite of some significant advantages, the noninvasive approach is not without drawbacks. An important limitation is that, at least, three and sometimes four tones are involved in producing a number of complex nonlinear interactions and a rich mixture of iDPs, which can potentially confound the iDP of interest. Nevertheless, the DPOAE and DPOAE2ry L/P maps and IRAs provide compelling demonstrations that these multiple interactions do not make interpretation of the resulting data impossible. In fact, the data are very consistent, considering the complexities involved.
Additionally, it is necessary to consider suppression by the primary tones when computing the actual levels of the iDP. Moreover, the L1 vs L2 function of the interaction of the iDP with f3 also needs to be recognized, since such interactions can critically affect the level of the DPOAE2ry as has been shown for DPOAEs measured in the ear canal, and presumably applies to the generation of the DPOAE2ry as well (e.g., Whitehead et al. 1995). Based on our experience, we selected a level of f3 that would minimize these L1 vs L2 effects. Finally, the secondary DPOAE2ry arises from a distributed region around the interaction of the f3 with the iDP and is, thus, less precise than direct BM measurements or extracellular recordings from cochlear nerve fibers.
Overall, the noninvasive technique will require future validation and calibration by direct comparisons with iDPs on the BM and simultaneous measures of the corresponding DPOAE2ry. Assuming that the noninvasive technique can be validated and calibrated by such experiments, a type of iDP-gram could be developed that was recently shown to be very sensitive to a punctate noise-induced lesion in the rabbit (Stagner et al. 2014) as compared to the standard ear-canal-recorded DP-gram. In addition, the growth and saturation of the iDP with increasing primary-tone levels measured by this technique may yield a more accurate estimate of the BM nonlinearity or compression than is currently provided by growth functions for ear-canal DPOAEs. Finally, it has been possible (unpublished findings) to measure an iDP-gram in a human with a high-frequency hearing loss, where the iDP-gram closely matched the frequency pattern determined by a detailed Bekesy audiogram measured over the same dysfunctional region, thus supporting the potential clinical utility of such inferred intracochlear measures.
Acknowledgments
This work was supported in part by the US National Institutes of Health (National Institute on Deafness and Other Communication Disorders DC000613) and the US Department of Veterans Affairs (VA) (VA/Rehabilitative Research and Development C449R, C6212L). The authors thank Alisa Hetrick for the technical assistance. We also want to thank three anonymous reviewers for their thoughtful comments that undoubtedly improved the manuscript.
Abbreviations
- A/D
Analog-to-digital
- BM
Basilar membrane
- CF
Characteristic frequency
- CP
Compression pressure
- CT
Combination tone
- DP
Distortion product
- DP-gram
DPOAE level as a function of f2 primary-tone frequencies
- DPOAE
Ear-canal distortion product otoacoustic emission
- DPOAE2ry
A secondary DPOAE produced by interacting a DPOAE at 2f1-f2 or 2f2-f1 with a third tone (f3)
- DSP
Digital signal processor
- EQPiDP
Equivalent ear-canal pressure that produces a DPOAE2ry
- f1 and f2
Lower and upper frequency primary tones, respectively
- f2/f1
Ratio describing the frequency separation of f1 and f2
- fdp
Distortion product frequency
- iDP
Intracochlear distortion product
- iDP2ry
A secondary intracochlear DP produced by interacting f3 with a DP
- IACUC
Institutional Animal Care and Use Committee
- IRA
Interference-response area
- IRB
Institutional Review Board
- IT
Interference tone
- L/P map
level/phase map
- L1 and L2
Levels of f1 and f2, respectively
- μm
Micrometer or micron
- NF
Noise floor
- oct
Octave
- OHC
Outer hair cell
- PST
Intracochlear pressure in scala tympani
- PC
Personal computer
- SPL
Sound pressure level
- TW
Traveling wave
- VA
Veterans Affairs
Compliance with ethical standards
Conflict of Interest
The authors declare that they have no conflicts of interest.
Contributor Information
Glen K. Martin, Phone: 909-825-7084, Email: glen.martin2@va.gov
Barden B. Stagner, Email: barden.stagner@va.gov
Wei Dong, Email: wei.dong@va.gov.
Brenda L. Lonsbury-Martin, Email: blonsbury-martin@llu.edu
Referrences
- Allen JB, Fahey PF. A second cochlear-frequency map that correlates distortion product and neural tuning measurements. J Acoust Soc Am. 1993;94:809–816. doi: 10.1121/1.408182. [DOI] [PubMed] [Google Scholar]
- Avan P, Buki B, Petit C. Auditory distortions: origins and functions. Physiol Rev. 2013;93:1563–1619. doi: 10.1152/physrev.00029.2012. [DOI] [PubMed] [Google Scholar]
- Cooper NP, Rhode WS. Mechanical responses to two-tone distortion products in the apical and basal turns of the mammalian cochlea. J Neurophysiol. 1997;78:261–270. doi: 10.1152/jn.1997.78.1.261. [DOI] [PubMed] [Google Scholar]
- de Boer E, Nuttall AL, Hu N, Zou Y, Zheng J. The Allen-Fahey experiment extended. J Acoust Soc Am. 2005;117:1260–1266. doi: 10.1121/1.1856229. [DOI] [PubMed] [Google Scholar]
- Dong W, Olson ES. Two-tone distortion in intracochlear pressure. J Acoust Soc Am. 2005;117:2999–3015. doi: 10.1121/1.1880812. [DOI] [PMC free article] [PubMed] [Google Scholar]
- Dong W, Olson ES. Middle ear forward and reverse transmission in gerbil. J Neurophysiol. 2006;95:2951–2961. doi: 10.1152/jn.01214.2005. [DOI] [PubMed] [Google Scholar]
- Dong W, Olson ES. Supporting evidence for reverse cochlear traveling waves. J Acoust Soc Am. 2008;123:222–240. doi: 10.1121/1.2816566. [DOI] [PubMed] [Google Scholar]
- Dong W, Olson ES. Detection of cochlear amplification and its activation. Biophys J. 2013;105:1067–1078. doi: 10.1016/j.bpj.2013.06.049. [DOI] [PMC free article] [PubMed] [Google Scholar]
- Fahey PF, Stagner BB, Lonsbury-Martin BL, Martin GK. Nonlinear interactions that could explain distortion product interference response areas. J Acoust Soc Am. 2000;108:1786–1802. doi: 10.1121/1.1308048. [DOI] [PubMed] [Google Scholar]
- Fahey PF, Stagner BB, Martin GK. Mechanism for bandpass frequency characteristic in distortion product otoacoustic emission generation. J Acoust Soc Am. 2006;119:991–996. doi: 10.1121/1.2146088. [DOI] [PubMed] [Google Scholar]
- Goldstein JL, Buchsbaum G, Furst M. Compatibility between psychophysical and physiological measurements of aural combination tones. J Acoust Soc Am. 1978;63:474–485. doi: 10.1121/1.381739. [DOI] [PubMed] [Google Scholar]
- Harris FP, Lonsbury-Martin BL, Stagner BB, Coats AC, Martin GK. Acoustic distortion products in humans: systematic changes in amplitude as a function of f2/f1 ratio. J Acoust Soc Am. 1989;85:220–229. doi: 10.1121/1.397728. [DOI] [PubMed] [Google Scholar]
- He W, Ren T. Basilar membrane vibration is not involved in the reverse propagation of otoacoustic emissions. Sci Rep. 2013;3:1874–1880. doi: 10.1038/srep01874. [DOI] [PMC free article] [PubMed] [Google Scholar]
- Huang S, Olson ES. Auditory nerve excitation via a non-traveling wave mode of basilar membrane motion. J Assoc Res Otolaryngol. 2011;12:559–575. doi: 10.1007/s10162-011-0272-5. [DOI] [PMC free article] [PubMed] [Google Scholar]
- Johnson TA, Neely ST, Garner CA, Gorga MP. Influence of primary-level and primary-frequency ratios on human distortion product otoacoustic emissions. J Acoust Soc Am. 2006;119:418–428. doi: 10.1121/1.2133714. [DOI] [PMC free article] [PubMed] [Google Scholar]
- Knight RD, Kemp DT. Indications of different distortion product otoacoustic emission mechanisms from a detailed f1, f2 area study. J Acoust Soc Am. 2000;107:457–473. doi: 10.1121/1.428351. [DOI] [PubMed] [Google Scholar]
- Knight RD, Kemp DT. Wave and place fixed DPOAE maps of the human ear. J Acoust Soc Am. 2001;109:1513–1525. doi: 10.1121/1.1354197. [DOI] [PubMed] [Google Scholar]
- Martin GK, Jassir D, Stagner BB, Whitehead ML, Lonsbury-Martin BL. Locus of generation for the 2f1-f2 vs 2f2-f1 distortion-product otoacoustic emissions in normal-hearing humans revealed by suppression tuning, onset latencies, and amplitude correlations. J Acoust Soc Am. 1998;103:1957–1971. doi: 10.1121/1.421347. [DOI] [PubMed] [Google Scholar]
- Martin GK, Stagner BB, Jassir D, Telischi FF, Lonsbury-Martin BL. Suppression and enhancement of distortion-product otoacoustic emissions by interference tones above f2: I. basic findings in rabbits. Hear Res. 1999;136:105–123. doi: 10.1016/S0378-5955(99)00119-7. [DOI] [PubMed] [Google Scholar]
- Martin GK, Villasuso EI, Stagner BB, Lonsbury-Martin BL. Suppression and enhancement of distortion-product otoacoustic emissions by an interference tone above f2: II. findings in humans. Hear Res. 2003;177:111–122. doi: 10.1016/S0378-5955(03)00028-5. [DOI] [PubMed] [Google Scholar]
- Martin GK, Stagner BB, Fahey PF, Lonsbury-Martin BL. Steep and shallow phase gradient DPOAEs arising basal to the primary tones. J Acoust Soc Am. 2009;125:EL85–EL92. doi: 10.1121/1.3073734. [DOI] [PMC free article] [PubMed] [Google Scholar]
- Martin GK, Stagner BB, Lonsbury-Martin BL. Evidence for basal distortion-product otoacoustic emission components. J Acoust Soc Am. 2010;127:2955–2972. doi: 10.1121/1.3353121. [DOI] [PMC free article] [PubMed] [Google Scholar]
- Martin GK, Stagner BB, Chung Y-S, Lonsbury-Martin BL. Characterizing distortion-product otoacoustic emission components across four species. J Acoust Soc Am. 2011;129:3090–3103. doi: 10.1121/1.3560123. [DOI] [PMC free article] [PubMed] [Google Scholar]
- Martin GK, Stagner BB, Lonsbury-Martin BL. Time-domain demonstration of distributed distortion product otoacoustic emission components. J Acoust Soc Am. 2013;134:342–355. doi: 10.1121/1.4809676. [DOI] [PMC free article] [PubMed] [Google Scholar]
- Olson ES. Observing middle and inner ear mechanics with novel intracochlear pressure sensors. J Acoust Soc Am. 1998;103:3445–3463. doi: 10.1121/1.423083. [DOI] [PubMed] [Google Scholar]
- Olson ES. Direct measurement of intra-cochlear pressure waves. Nature. 1999;402:526–529. doi: 10.1038/990092. [DOI] [PubMed] [Google Scholar]
- Probst R, Lonsbury-Martin BL, Martin GK. A review of otoacoustic emissions. J Acoust Soc Am. 1991;89:2027–2067. doi: 10.1121/1.400897. [DOI] [PubMed] [Google Scholar]
- Ren T. Reverse propagation of sound in the gerbil cochlea. Nat Neurosci. 2004;7:333–334. doi: 10.1038/nn1216. [DOI] [PubMed] [Google Scholar]
- Rhode WS. Distortion product otoacoustic emissions and basilar membrane vibration in the 6–9 kHz region of sensitive chinchilla cochleae. J Acoust Soc Am. 2007;122:2725–2737. doi: 10.1121/1.2785034. [DOI] [PubMed] [Google Scholar]
- Rhode WS, Cooper NP. Two-tone suppression and distortion production on the basilar membrane in the hook region of cat and guinea pig cochleae. Hear Res. 1997;66:31–45. doi: 10.1016/0378-5955(93)90257-2. [DOI] [PubMed] [Google Scholar]
- Robles L, Ruggero MA. Mechanics of the mammalian cochlea. Physiol Rev. 2001;81:1305–1352. doi: 10.1152/physrev.2001.81.3.1305. [DOI] [PMC free article] [PubMed] [Google Scholar]
- Robles L, Ruggero MA, Rich NC. Two-tone distortion on the basilar membrane of the chinchilla cochlea. J Neurophysiol. 1997;77:2385–2399. doi: 10.1152/jn.1997.77.5.2385. [DOI] [PMC free article] [PubMed] [Google Scholar]
- Shera CA. Wave interference in the generation of reflection- and distortion-source emissions. In: Gummer AW, editor. Biophysics of the cochlea: molecules to models. Singapore: World Sci Pr; 2003. pp. 439–453. [Google Scholar]
- Shera CA, Guinan JJ. Evoked otoacoustic emissions arise by two fundamentally different mechanisms: a taxonomy for mammalian otoacoustic emissions. J Acoust Soc Am. 1999;105:782–798. doi: 10.1121/1.426948. [DOI] [PubMed] [Google Scholar]
- Shera CA, Guinan JJ. Cochlear traveling-wave amplification, suppression, and beamforming probed using noninvasive calibration of intracochlear distortion sources. J Acoust Soc Am. 2007;121:1003–1016. doi: 10.1121/1.2404620. [DOI] [PubMed] [Google Scholar]
- Shera CA, Guinan JJ. Mechanisms of mammalian otoacoustic emission. In: Manley GA, Fay RR, Popper AN, editors. Active processes and otoacoustic emissions. New York: Springer; 2008. pp. 305–342. [Google Scholar]
- Shera CA, Tubis A, Talmadge CL. Four counter-arguments for slow-wave OAEs. In: Nuttall AL, Ren T, Gillespie P, Grosh K, de Boer E, editors. Auditory mechanisms: processes and models. Singapore: World Sci Pr; 2006. pp. 449–457. [Google Scholar]
- Shera CA, Tubis A, Talmadge CL, de Boer E, Fahey PF, Guinan JJ. Allen-Fahey and related experiments support the predominance of cochlear slow-wave otoacoustic emissions. J Acoust Soc Am. 2007;121:1564–1575. doi: 10.1121/1.2405891. [DOI] [PubMed] [Google Scholar]
- Stagner BB, Meinke D, Lonsbury-Martin BL, Martin GK. Group delay contour plots derived from DPOAE level/phase maps in normal hearing and noise-damaged humans. Assn Res Otolaryngol Abstr. 2007;30:177. [Google Scholar]
- Stagner BB, Martin GK, Lonsbury-Martin BL. The intracochlear DP-gram: a noninvasive assay of basilar membrane distortion products in noise-exposed rabbits. Assn Res Otolaryngol Abstr. 2014;37:63. [Google Scholar]
- Whitehead ML, Lonsbury-Martin BL, Martin GK. Measurement of 2f1-f2 excitation at the distortion-frequency place in the cochlea using ear-canal distortion products. Assn Res Otolaryngol Abstr. 1993;16:99. [Google Scholar]
- Whitehead ML, McCoy MJ, Lonsbury-Martin BL, Martin GK. Dependence of distortion-product otoacoustic emissions on primary levels in normal and impaired ears: I. Effects of decreasing L2 below L1. J Acoust Soc Am. 1995;97:2346–2358. doi: 10.1121/1.411959. [DOI] [PubMed] [Google Scholar]
- Whitehead ML, Stagner BB, Martin GK, Lonsbury-Martin BL. Visualization of the onset of distortion-product otoacoustic emissions, and measurement of their latency. J Acoust Soc Am. 1996;100:1663–1679. doi: 10.1121/1.416065. [DOI] [PubMed] [Google Scholar]