

Abstract
Although phosphorus limitation is common in freshwaters and bacteria are known to use dissolved organic phosphorus (DOP), little is known about how efficiently DOP compounds are taken up by individual bacterial taxa. Here, we assessed bacterial uptake of three model DOP substrates in two mountain lakes and examined whether DOP uptake followed concentration-dependent patterns. We determined bulk uptake rates by the bacterioplankton and examined bacterial taxon-specific substrate uptake patterns using microautoradiography combined with catalyzed reporter deposition–fluorescence in situ hybridization. Our results show that in the oligotrophic alpine lake, bacteria took up ATP, glucose-6-phosphate and glycerol-3-phosphate to similar extents (mean 29.7 ± 4.3% Bacteria), whereas in the subalpine mesotrophic lake, ca. 40% of bacteria took up glucose-6-phosphate, but only ∼20% took up ATP or glycerol-3-phosphate. In both lakes, the R-BT cluster of Betaproteobacteria (lineage of genus Limnohabitans) was over-represented in glucose-6-phosphate and glycerol-3-phosphate uptake, whereas AcI Actinobacteria were under-represented in the uptake of those substrates. Alphaproteobacteria and Bacteroidetes contributed to DOP uptake proportionally to their in situ abundance. Our results demonstrate that R-BT Betaproteobacteria are the most active bacteria in DOP acquisition, whereas the abundant AcI Actinobacteria may either lack high affinity DOP uptake systems or have reduced phosphorus requirements.
Keywords: ATP, glucose-6-phosphate, glycerol-3-phosphate, freshwater bacteria, AcI Actinobacteria, R-BT Betaproteobacteria
In phosphorus-limited mountain lakes, the most abundant taxa, the AcI lineage of Actinobacteria and the R-BT cluster of Betaproteobacteria, exhibit strikingly different dissolved organic phosphorus uptake patterns.
INTRODUCTION
In oligotrophic freshwater ecosystems, phosphorus (P) is often the element limiting primary and heterotrophic bacterial production (Carlson 1977; Vadstein 2000). Although inorganic phosphorus (Pi) is considered to be the preferred P source for microbes (Björkman and Karl 1994; Karl 2000), dissolved organic phosphorus (DOP) often represents most of the dissolved phosphorus pool in aquatic ecosystems (Minear 1972; Karl et al.2001). Among the large diversity of DOP compounds, ATP is known to be readily available for the majority of planktonic microorganisms (Holm-Hansen and Booth 1966; Berman 1988; Bentzen, Taylor and Millard 1992). In these studies, bacteria outcompeted phytoplankton in ATP acquisition at low ambient concentrations, and thus it was assumed that they might harbor high affinity transport systems to sequester DOP. However, few studies have considered other DOP substrates, although compounds such as glycerol phosphate and glucose phosphate are known to reduce the Pi demand of microbial communities (Argast and Boos 1980; Berman 1988; Cotner and Wetzel 1992).
Bacteria can adapt rapidly to Pi-deficient conditions because Pi sensors and response proteins act as transcriptional activators of the Pho regulon that codes for several genes involved in the cleavage and incorporation of DOP compounds (Wanner 1993; Luo et al.2009). Two mechanisms are commonly used for DOP incorporation. For instance, phosphoesters such as ATP are cleaved by extracellular hydrolases (e.g. alkaline phosphatases) and the released Pi residues are subsequently taken up into the cell (Jansson, Olsson and Pettersson 1988; Ammerman and Azam 1991). However, other DOP compounds enter the bacterial cell intact via specific transport systems (Brzoska et al.1994; Yang, Wang and Metcalf 2009) and are either hydrolyzed intracellularly or directed to metabolic pathways (Wanner 1993). Bacteria living under P limitation can express genes responsible for different DOP uptake mechanisms (Luo et al.2009; Vila-Costa et al.2012). However, there is an uneven distribution of P-related functional genes among bacteria, which suggests that distinct bacterial groups might rely on specific DOP compounds or rather, that they differ in their ability to utilize DOP (Luo et al.2009; Vila-Costa et al.2012).
Here, we hypothesized that P-limited lake bacteria respond rapidly to the addition of different DOP compounds and determined whether this contribution changes with increasing substrate concentrations. Further, we tested whether individual bacterial groups differ in their ability to utilize these compounds as they potentially exhibit different DOP uptake characteristics. We determined the bulk uptake rates of ATP, glucose-6-phosphate (Glu6P) and glycerol-3-phosphate (Gly3P), offered at three different concentrations, by the bacterial community of a mesotrophic subalpine and an oligotrophic alpine lake. Additionally, we examined the uptake of these three substrates by individual bacterial groups using microautoradiography (MAR) combined with fluorescence in situ hybridization with catalyzed reporter deposition (CARD-FISH).
EXPERIMENTAL PROCEDURES
Study sites and sample collection
Uptake experiments were conducted in two mountain lakes located in the Austrian Alps, namely the oligotrophic alpine lake Gossenköllesee (GKS, 47°13′N, 11°01′E) located at 2417 m a.s.l., and the mesotrophic subalpine lake Piburgersee (PIB, 47°11′N, 10°53′E) located at 913 m a.s.l. GKS is a holomictic dimictic lake with a maximum depth of 9.9 m and a lake area of 1.7 ha. The lake is ice-covered for up to 7 months. PIB is a meromictic dimictic lake with a maximum depth of 24.6 m and an area of 13.4 ha. The ice-cover in PIB typically lasts from early December until April. Further information on lake characteristics and seasonality can be found elsewhere (Tolotti and Thies 2002; Sommaruga and Augustin 2006).
Due to the very large sample number to process and to count for MAR-CARD-FISH (2 lakes × 2 depths × 3 substrates × 3 concentrations × 3 replicates × 6 16S rRNA probes = 648 samples), both lakes were sampled only once during the stratified period (mid-August in GKS and mid-October in PIB). At that time, water temperature was similar between lakes, making enzymatic and bacterial activity more comparable. At each sampling date, water samples from the epilimnion (1 m) and the aerobic hypolimnion (8 m in GKS, 15 m in PIB) were collected from the central area of the lakes using a 5 L Schindler–Patalas sampler. Water samples (1 L) for bulk uptake experiments and MAR-CARD-FISH incubations, as well as for dissolved organic carbon (DOC) were collected in pre-combusted (450°C, 4 h) borosilicate glass bottles. Samples to determine total phosphorus (TP) and total dissolved phosphorus (TDP) concentrations were collected in 1 L polyethylene bottles pre-rinsed with 1 M HCl. Subsamples for DOC and TP/TDP analyses were processed as previously described (Hörtnagl, Pérez and Sommaruga 2010).
Incubations for microautoradiography
To assess DOP utilization patterns by individual bacterial groups, the following radiochemicals were used for microautoradiography (MAR) (specific activity 20 Ci mmol−1; American Radiolabeled Chemicals): [3H]adenosine triphosphate (ATP), [3H]glucose-6-phosphate (Glu6P) and [3H]glycerol-3-phosphate (Gly3P). Due to the impossibility of purchasing all three substrates with 32/33P-label, we used instead 3H-labeled substrates to assure comparability of uptake patterns. For every substrate, three different concentrations were used (0.2, 1 and 5 nM) to check whether their uptake follows a concentration-dependent pattern, as DOP in situ concentrations are known to fluctuate (e.g. year-round bioavailability of ATP; Rofner, Sommaruga and Pérez 2016). All MAR incubations were run in triplicate (20 ml for GKS, 10 ml for PIB) plus a control sample that was killed 15 min before radiotracer inoculation (2% formaldehyde). Samples were incubated at in situ temperature in the dark for 45 min (ATP) or 60 min (Glu6P and Gly3P) and incubations were stopped by adding formaldehyde (2% final concentration). Samples were fixed overnight at 4°C and two subsamples (10 ml for GKS, 5 ml for PIB) were filtered the next day onto 0.22 μm polycarbonate white filters (Millipore GTTP) followed by subsequent rinsing with 5–10 ml of 0.22 μm filtered MQ-water. Filters were stored frozen (–20°C) until further processing.
Bulk uptake rates
The bulk uptake rates of [3H]ATP, [3H]Glu6P and [3H]Gly3P were assessed by measuring the radioactivity retained onto 0.22 polycarbonate white filters (Poretics). Duplicate samples (10 ml for GKS, 5 ml for PIB) plus one formaldehyde-killed control were incubated with the radiolabeled substrates as described in the previous section. Filters were dissolved in 5 ml scintillation cocktail (Ready-Safe, Beckman Coulter) and their radioactivity assessed after 15 h on a Beckman LS 6000IC scintillation counter.
MAR-CARD-FISH procedure
CARD-FISH was done as described in Pernthaler, Pernthaler and Amann (2002) using the modified permeabilization protocol of Sekar et al. (2003). The most common bacterial groups/clades in the study lakes were targeted by the following horseradish peroxidase-labeled rRNA probes (ThermoHybaid): EUB I–III for the domain Bacteria (Daims et al.1999), ALF968 for Alphaproteobacteria (Neef 1997), BET42a for Betaproteobacteria (Manz et al.1992) and its R-BT cluster with R-BT065 (lineage of the genus Limnohabitans) (Šimek et al.2001), CF319a for Bacteroidetes (Manz et al.1996), and AcI-852 for AcI Actinobacteria (Warnecke et al.2005). Filter hybridization and preparation of CARD-FISH slides was done as previously described (Pérez and Sommaruga 2011). In total, 216 individual filter sections were prepared for CARD-FISH and 648 for MAR-FISH.
Microautoradiogaphy was done according to Tabor and Neihof (1982) after transferring cells onto coverslips (Cottrell and Kirchman, 2000, 2003). The coverslips were dipped into a molten autoradiography emulsion (Kodak, type NTB), exposed for 10 d at 4°C and developed afterwards according to the manufacturer's instructions. Enumeration of slides was done according to Pérez and Sommaruga (2011) without subtraction of blank counts because previous results from our experiments have shown that <1% of 4′,6-diamidino-2-phenylindole (DAPI)-stained cells are labeled in the blank.
CARD-FISH filters were counterstained with DAPI (1 μg ml−1) and were also used to assess bacterial abundance. About 400–1300 homogeneously distributed cells per filter were counted manually by epifluorescence microscopy (Zeiss Axiophot 2).
Statistical analyses
A one-way analysis of variance (ANOVA) or a t-test (two sample test) were run on PAST.exe (Ver. 2.17c) to detect significant differences among sample means of bacterial groups taking up the DOP substrates. Sample means were compared between bacterial groups, concentrations, depths, lakes and substrates. When significant differences (P < 0.05) were found, a post hoc test (Tukey) was applied. Normal distribution of data was visually checked with histograms, normal probability plots and the Shapiro–Wilk test. Data were log-transformed, when found to be not normally distributed. A linear regression analysis was done in PAST.exe to detect if the proportions of active cells within individual bacterial groups changed significantly with increasing substrate concentrations.
RESULTS
Study sites
Water temperature was slightly higher in August in GKS than in October in PIB (Table 1). In both lakes, pH values were close to neutral, but nutrient concentrations were generally higher in PIB than in GKS (Table 1). DOC concentrations were slightly higher in the epilimnion of the lakes, whereas TDP and TP concentrations were higher in the hypolimnion. Bacterial abundance was rather similar at both depths in PIB (mean ∼1.38 × 10⁶ cells ml−1), but it was two-fold higher in the hypolimnion of GKS than in the epilimnion (Table 1).
Table 1.
Summary of the physicochemical and biological parameters measured in lakes Gossenköllesee (GKS) and Piburgersee (PIB). Temp: water temperature; TDP: total dissolved phosphorus; TP: total phosphorus; DOC: dissolved organic carbon; BA: bacterial abundance.
| Lake | Date | Depth (m) | Temp (°C) | pH | TDP (nM) | TP (nM) | DOC (μM) | BA (cells ml−1) |
|---|---|---|---|---|---|---|---|---|
| GKS | 16.08.2013 | 1 | 14.3 | 7.15 | 25.83 | 87.17 | 34.63 | 4.78 × 10⁵ |
| 8 | 8.7 | 7.19 | 45.20 | 122.68 | 24.56 | 9.87 × 10⁵ | ||
| PIB | 18.10.2013 | 1 | 11.3 | 7.6 | 67.8 | 190.48 | 185.08 | 1.31 × 10⁶ |
| 15 | 5.2 | 6.96 | 93.63 | 400.34 | 153.78 | 1.45 × 10⁶ |
Lake-specific phylogenetic affiliation of heterotrophic bacteria and their contribution to dissolved organic phosphorus uptake
Probe EUBI-II-III detected ∼80% of DAPI-stained cells in both lakes (Table 2). The actinobacterial lineage AcI was the most abundant group, comprising about 40% of DAPI-stained cells in the epilimnion and ca. 35% of DAPI-stained cells in the hypolimnion of the lakes. Betaproteobacteria was the second most abundant group and showed similar percentages (∼29% of DAPI-stained cells) at both depths in GKS, but not in PIB, where it was more abundant in the hypolimnion. The R-BT cluster comprised about one-third of Betaproteobacteria in GKS and ca. one-fourth in the epilimnion of PIB; however, they represented a small fraction of Betaproteobacteria in the hypolimnion of the latter lake. Alphaproteobacteria showed a similar distribution in both lakes, representing 8–10% of DAPI counts in the epilimnion and 4–5 times less in the hypolimnion. Bacteroidetes represented on average 9.8% and 3.2% of DAPI counts in GKS and PIB, respectively, although in both lakes their relative abundance was higher in the epilimnion as compared with the hypolimnion.
Table 2.
Structure of the bacterial community in lakes Gossenköllesee (GKS) and Piburgersee (PIB). EUBI-II-III (Bacteria), ALF968 (Alphaproteobacteria), BET42a (Betaproteobacteria), R-BT065 (R-BT cluster of Betaproteobacteria), CF319a (Bacteroidetes) and AcI-852 (AcI lineage of Actinobacteria). The mean (n = 9 replicates) relative abundance of probe-specific hybridized cells is given as the percentage of DAPI counts ±SD.
| Lake | Date | Depth (m) | EUBI-II-III | ALF968 | BET42a | R-BT065 | CF319a | AcI-852 |
|---|---|---|---|---|---|---|---|---|
| GKS | 16.08.2013 | 1 | 86.89 ± 1.59 | 8.04 ± 0.18 | 29.08 ± 1.62 | 12.96 ± 2.19 | 11.03 ± 1.27 | 39.32 ± 1.14 |
| 8 | 71.23 ± 3.91 | 1.46 ± 0.71 | 28.03 ± 1.11 | 10.07 ± 1.43 | 8.56 ± 0.82 | 32.54 ± 2.82 | ||
| PIB | 18.10.2013 | 1 | 79.05 ± 4.32 | 10.30 ± 2.18 | 21.21 ± 1.25 | 5.67 ± 1.34 | 4.04 ± 1.09 | 40.30 ± 2.86 |
| 15 | 82.24 ± 4.87 | 2.24 ± 0.84 | 34.58 ± 1.68 | 5.15 ± 1.19 | 2.36 ± 0.20 | 36.83 ± 2.55 |
The examined bacterial groups exhibited substrate-specific uptake patterns that were similar in both lakes (Fig. 1A and B). Betaproteobacteria and its R-BT cluster yielded the highest proportions of cells taking up Glu6P and Gly3P in the lakes, though more cells were labeled positive in GKS than in PIB. For both groups, the proportions of cells positive for ATP uptake represented ca. 20% of hybridized cells. Bacteroidetes and AcI Actinobacteria showed similar Glu6P and Gly3P uptake patterns (Fig. 1) and were often different from those of other bacterial groups (ANOVA, P < 0.01). In general, AcI Actinobacteria was weakly represented in the uptake of any substrate (range: ∼6–22% of hybridized cells) with the exception of Glu6P in PIB (range: ∼19–32% of hybridized cells; Figs 1B and 2F). By contrast, more Bacteroidetes cells were labeled positive for ATP uptake (22–36%) than for Gly3P or Glu6P uptake in the lakes. Around 30–55% of Alphaproteobacteria incorporated ATP and Gly3P (hypolimnion) in GKS and Glu6P in PIB.
Figure 1.

The relative abundance of cells within the bacterial groups (as % hybridized cells) taking up ATP, glucose-6-phosphate and glycerol-3-phosphate at three different concentrations and in both depths of GKS (A) and PIB (B). Boxplots show the 25–75 percentiles and the median. Different letters above the boxplots indicate significant differences in substrate uptake among the bacterial groups (Tukey's pairwise post hoc test; significance level of 0.05), whereas identical letters indicate similar substrate uptake patterns. Betaproteobacteria (Beta) and its R-BT cluster (R-BT), Alphaproteobacteria (Alpha), Bacteroidetes (Bcdt), and AcI Actinobacteria (AcI).
Figure 2.
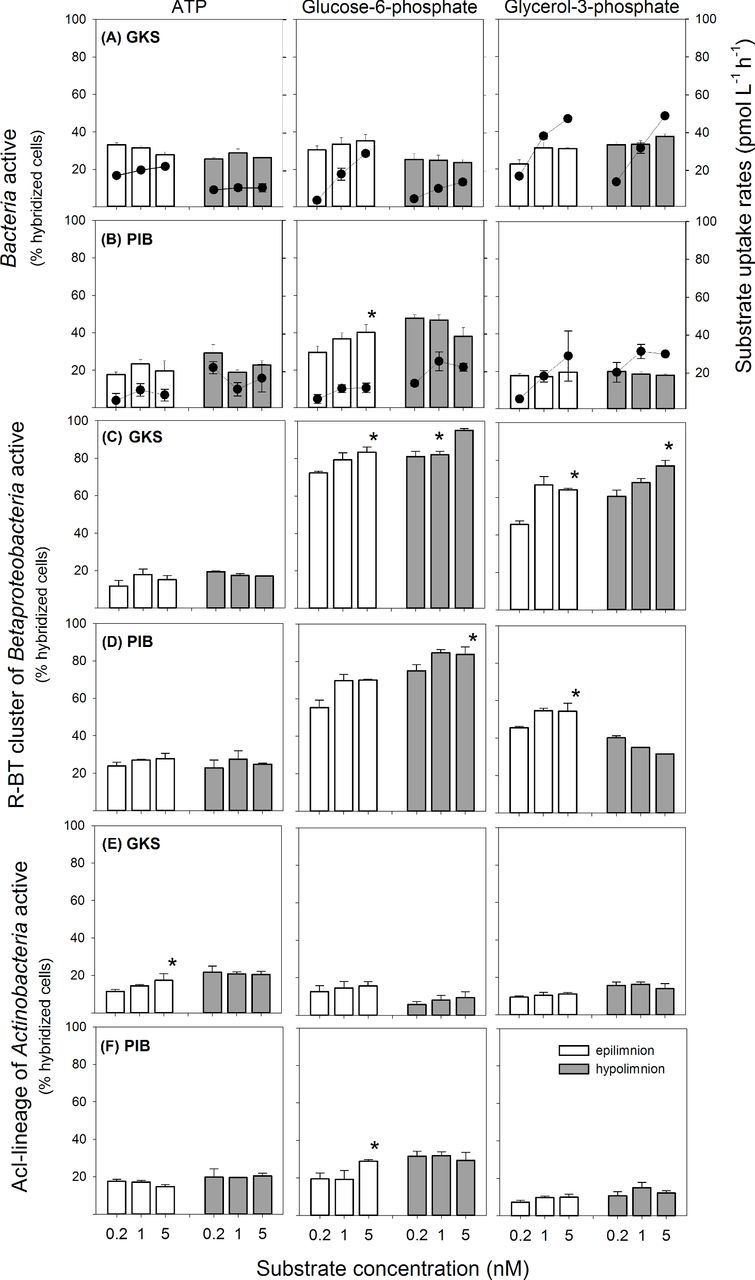
Bar charts representing the percentage of Bacteria, the R-BT cluster of Betaproteobacteria and the AcI lineage of Actinobacteria (as % hybridized cells) taking up ATP, glucose-6-phosphate and glycerol-3-phosphate at the three concentrations added (0.2, 1, 5 nM) in the epilimnion (open bars) and hypolimnion (filled bars) of GKS (A, C, E) and PIB (B, D, F). Values are the mean of triplicate incubations ±1 SD. Asterisks indicate significant changes in active cells due to increasing substrate concentrations. Data points above the bars represent the mean bulk substrate uptake rates determined from duplicate incubations ±1 SD.
Dissolved organic phosphorus uptake in relation to substrate concentration
In GKS, the percentage of bacterial cells taking up the three DOP compounds was very similar (Fig. 2A; average: ATP 28.81 ± 3.03%, Glu6P 28.77 ± 4.94%, Gly3P 31.39 ± 4.87%), whereas in PIB ca. 40% of bacterial cells took up Glu6P and between 18 and 24% of Bacteria took up ATP and Gly3P (Fig. 2B). The Glu6P and Gly3P bulk uptake rates increased greatly at higher substrate concentrations in both lakes (Fig. 2A and B), whereas the relative abundance of bacterial cells taking up these substrates remained rather constant or increased significantly for Glu6P uptake in the epilimnion of PIB (Fig. 2B; R2 = 0.78; P < 0.05). By contrast, ATP bulk uptake rates and the proportions of cells positive for ATP uptake increased slightly or fluctuated without clear pattern with increasing substrate concentration.
The R-BT cluster of Betaproteobacteria was particularly active in Glu6P and Gly3P uptake and higher substrate concentrations yielded often significantly higher percentages of positive cells (Fig. 2C and D; R2 = 0.50–0.88, P < 0.05). This effect was more pronounced in GKS than in PIB. By contrast, higher ATP concentrations did not affect the R-BTs activity and the proportions of ATP-labeled cells remained low (range: GKS 12–19% hybridized cells; PIB 23–28% hybridized cells).
In general, the proportions of actinobacterial cells positive for a DOP compound either slightly increased at higher substrate concentrations or remained constant (Fig. 2E and F). The AcI lineage of Actinobacteria showed similar percentages of cells labeled positive for ATP and Gly3P in both lakes, whereas more cells were labeled positive for Glu6P in PIB than in GKS (range: PIB 19–32% hybridized cells; GKS 6–15% hybridized cells). In GKS, the proportions of actinobacterial cells labeled positive for ATP increased significantly in the epilimnion (R2 = 0.69, P < 0.05), whereas in the epilimnion of PIB this trend was significant for Glu6P uptake (R2 = 0.73, P < 0.05).
Dissolved organic phosphorus uptake in relation to group-specific abundance
The contribution of a bacterial group to the uptake of ATP, Glu6P and Gly3P versus its contribution to bacterial abundance differed depending on the substrate and lake considered (Fig. 3A and B). Alphaproteobacteria usually contributed to the uptake of the three DOP compounds proportionally to their in situ abundance, though they were slightly over-represented in the uptake of ATP in the epilimnion of both lakes. Betaproteobacteria and its R-BT cluster were significantly over-represented in the uptake of Glu6P and Gly3P as compared with their in situ abundance in GKS (ANOVA, P < 0.01), whereas their contribution to ATP incorporation was proportional to their abundance. Similarly in PIB, they were close to the 1:1 line for ATP and Glu6P uptake, but were over-represented for Gly3P (ANOVA, P < 0.05). Bacteroidetes contributed to substrate incorporation in relation to their relative abundance, except in GKS where they were slightly under-represented in the uptake of Glu6P and Gly3P. AcI Actinobacteria were poorly represented in the uptake of Glu6P and Gly3P. This trend was significantly more pronounced in GKS than in PIB (t-test, P < 0.001). Their contribution to ATP uptake was rather close to the 1:1 line in both lakes (Fig. 3).
Figure 3.

The contribution of Betaproteobacteria (dark blue) and its R-BT cluster (light blue), Bacteroidetes (green), Alphaproteobacteria (orange), and AcI Actinobacteria (red) to ATP, glucose-6-phosphate and glycerol-3-phosphate uptake plotted against their contribution to abundance in GKS (A) and PIB (B). The 1:1 line indicates that the contribution of a bacterial group to substrate uptake equals its contribution to bacterial abundance. Circle and triangle indicate the epilimnion and hypolimnion, respectively. Different substrate concentrations are given by symbol size: small, 0.2 nM; medium, 1 nM; large, 5 nM. Values are the mean of triplicate samples.
DISCUSSION
Dissolved organic phosphorus compounds readily utilizable by lake bacteria
The dissolved organic phosphorus (DOP) pool comprises a variety of different chemical compounds. The bioavailable DOP fraction is constituted by nucleotides, phosphoesters (Berman 1988; Björkman and Karl 1994) and phosphonates (Schowanek and Verstraete 1990). Among DOP, nucleotides such as ATP seem to be the most labile molecules as suggested by their rapid turnover times of hours (Bentzen, Taylor and Millard 1992; Løvdal, Tanaka and Thingstad 2007). However, P-limited bacteria may rely on multiple DOP compounds to satisfy their P demand. In fact, in most cases we observed similar proportions of bacterial cells labeled positive for the uptake of the three DOP substrates considered: ATP, Glu6P and Gly3P. However, the specific bulk uptake rates of those DOP compounds differed, as well as their kinetic patterns (Fig. 2A and B). For instance, the uptake rates for Glu6P and Gly3P increased with increasing concentrations without reaching saturation at 5 nM, whereas for ATP they remained rather constant or fluctuated without clear pattern. This suggests that even higher concentrations of Glu6P and Gly3P could be taken up by heterotrophic bacterial communities and that these compounds are readily utilized by heterotrophic bacteria, probably due to the P-deficient conditions in both lakes. However, it has to be noted that in this study P uptake was not tracked directly because the DOP compounds we used were 3H-labeled. Nonetheless, considering previous studies on ATP, Glu6P and Gly3P uptake mechanisms, we could infer the most likely P uptake mechanisms working in both lakes. For instance, the [3H]ATP uptake rates we measured were similar to rates found in other studies (Cotner and Wetzel 1992; Alonso-Sáez and Gasol 2007; Alonso-Sáez, Sánchez and Gasol 2012), but were one order of magnitude lower than [33P]ATP rates measured in the same lakes previously (Rofner, Sommaruga and Pérez 2016, in press). Significantly higher bulk uptake rates of [33P]ATP compared with [3H]ATP were also observed by Duhamel, Björkman and Karl (2012). This large discrepancy in ATP uptake rates can be explained by the fact that three orthophosphate moieties need to be hydrolyzed before the [3H]adenine moiety can be taken up. Thus, the adenine moiety is taken up much slowly than the orthophosphate residues (Heath and Hansen 2004), and thus the ATP uptake rates we report here might underestimate the uptake of orthophosphate. Considering this fact, we expected ATP uptake rates to be lower than Glu6P and Gly3P uptake rates. However, the bulk uptake rates were in a similar range for all three substrates, suggesting that ATP is being utilized rapidly in both lakes.
Previous studies on the mechanisms involved in Glu6P uptake in E. coli showed that, under P-sufficient conditions, this substrate is taken up directly via the UhpT system (antiporter) by exchanging Pi or organophosphates against Glu6P (van Veen 1997). This mechanism, however, would be very inefficient under P-limiting conditions, and thus Hoffer, van Uden and Tommassen (2001) suggested that under P limitation, extracellular alkaline phosphatases would hydrolyze Glu6P and that the orthophosphate moiety would be incorporated separately from the C moiety. Indeed, the study of Hernandez, Hwang and Heath (1996) in a mesotrophic lake showed that the uptake of the orthophosphate moiety is much faster than the uptake of the C moiety, by comparing [32P]Glu6P with [14C]Glu6P uptake rates. Thus, the [3H]Glu6P bulk uptake rates we measured might underestimate the incorporation of organic phosphorous from Glu6P. However, the fact that increasing substrate concentrations resulted in higher Glu6P uptake rates suggests that in the study lakes bacteria profited from both the glucose and the orthophosphate moiety.
Among the three DOP compounds studied, Gly3P yielded the highest bulk uptake rates, particularly in the oligotrophic alpine lake GKS (Fig. 2A and B). Under P-limiting conditions, Gly3P is incorporated as a whole by the ugp system (Schweizer, Argast and Boos 1982; Brzoska et al.1994; Luo et al.2009; Vila-Costa et al.2012), which means that the C and orthophosphate moiety are taken up at the same time. The high uptake rates found in both lakes are likely due to the fact that Gly3P does not need to be hydrolyzed prior to uptake. Furthermore, the ugp transport system, connected to the Pho regulon, is controlled by intracellular Pi levels (Brzoska et al.1994) and the higher Gly3P uptake rates in GKS when compared with PIB may be due to the particular low Pi concentrations found in this lake (Rofner, Sommaruga and Pérez 2016).
Dissolved organic phosphorus uptake by individual bacterial groups
In P-limited aquatic ecosystems, the activity and dynamics of bacteria are undoubtedly affected by their inherent and adaptive ability to acquire P compounds. Several ‘omic’-based and single-cell studies have revealed that distinct gene expression profiles and substrate uptake patterns prevail among different bacterial groups/subgroups/clusters (Alonso-Sáez and Gasol 2007; Luo et al.2009; Longnecker, Lomas and Van Mooy 2010; Sebastián et al.2012; Vila-Costa et al.2012), but knowledge on what bacterial groups dominate the uptake of different DOP compounds is still missing.
In our study, we identified DOP-specific uptake patterns for the main bacterial groups/subgroups inhabiting two mountain lakes (Fig. 1) and found that the most abundant taxa, the AcI Actinobacteria and the Betaproteobacteria, exhibited strikingly different DOP uptake characteristics. Whereas Betaproteobacteria and particularly its R-BT cluster (genus Limnohabitans), were the most active in acquiring Glu6P and Gly3P, AcI Actinobacteria were rather under-represented in the uptake of all DOP compounds considered (Fig. 3). This does not necessarily imply that the AcI Actinobacteria are less competitive in DOP acquisition than the R-BT cluster, but indicates that these subgroups follow distinct strategies to cope with P-limiting conditions. Freshwater bacteria exhibit striking flexibility in their P content (Godwin and Cotner 2015) and in their growth potential (Šimek et al.2006). The growth rate hypothesis (Sterner 1995) postulates that slow growing cells will have a lower P content than rapid growing ones. The weak representation of AcI Actinobacteria in DOP uptake could be due to their moderate growth rates (Šimek et al.2006) and, thus, low P requirements. An alternative explanation is that they replace membrane phospholipids with non-phosphorus lipids (e.g. glycolipids) to reduce their P demand as shown for the marine alphaproteobacterial clade SAR11 (Sebastián et al.2012; Carini et al.2015). Although some lipase and glycosyltransferase genes involved in cell wall biogenesis of AcI representatives are present (Ghylin et al.2014), further studies are needed to elucidate whether AcI Actinobacteria are capable of membrane remodeling. However, their weak representation in Glu6P and Gly3P incorporation might also be linked to a limited number of gene sites coding for DOP uptake, as AcI Actinobacteria are known to have small and streamlined genomes (Ghylin et al.2014). This is supported by information obtained from a P-limited alpine lake in the Pyrenees (Vila-Costa et al.2012), where Actinobacteria contributed little to the transcript pool of P-related functional genes (ugp transport system, alkaline phosphatases, phosphonate uptake). However, we cannot exclude the possibility that AcI Actinobacteria obtain P from other DOP compounds not considered here.
Unlike AcI Actinobacteria, Betaproteobacteria were significantly over-represented in the uptake of Glu6P and Gly3P in the oligotrophic lake (GKS) and occasionally in the mesotrophic PIB (Fig. 3). In both lakes, we generally observed that the proportions of betaproteobacterial cells taking up DOP substrates increased with increasing substrate concentrations. This pattern agrees with the fact that freshwater Betaproteobacteria are rapidly enriched in response to an increase in the organic and inorganic P concentration (Burkert et al.2003; Šimek et al.2005; Hornák et al.2006; Pérez and Sommaruga 2006; Posch et al.2007). Depending on the aquatic system considered, different betaproteobacterial clades were responsible for the enrichment. The fast-growing R-BT cluster (beta I lineage) (Šimek et al.2006), which is ubiquitous in neutral to alkaline lakes (Šimek et al.2010), became very abundant in the meso-eutrophic Římov Reservoir (Hornák et al.2006) and in the alpine lake GKS (Pérez and Sommaruga 2006), whereas the Polynucleobacter necessarius clade (beta II lineage) was rapidly enriched in humic lakes (Burkert et al.2003; Hahn, Pöckl and Wu 2005). In GKS, the R-BT cluster usually dominates within the Betaproteobacteria (Pérez and Sommaruga 2011), whereas in PIB, lineages such as beta II and IV are also present (Salcher et al.2008), but they only reach a high representation in the anoxic hypolimnion.
In both lakes, we found that the proportions of R-BT cells incorporating DOP compounds followed the uptake patterns found at the group level (Betaproteobacteria). As much as 95% and 77% of R-BT cells were labeled positive for Glu6P and Gly3P uptake, respectively (Fig. 2C and D). This shows that the R-BT cluster is particularly important in the cycling of phosphorylated sugars and glycerol compounds. Indeed, when we screened the available information on putative genes involved in DOP uptake for Limnohabitans from the Římov Reservoir (accession number NCBI: SAMN02470021, SAMN02470022), we found several genes related to glycerol-3-phosphate uptake (ugpQ, ugpC) and phosphoester hydrolysis (phosphatases), as well as to Pi starvation (phoH, phoR, phoU) and Pi uptake (pstA, pstC, pstS). Additionally, both genomes showed high frequency of genes involved in phosphonate metabolism, which points to the R-BT cluster playing an important role in the utilization and cycling not only of phosphoesters but also of phosphonates in freshwaters.
Alphaproteobacteria and Bacteroidetes are usually not the most abundant bacterial groups in oligotrophic freshwaters (Pérez, Hörtnagl and Sommaruga 2010; Salcher, Pernthaler and Posch 2010). However, they prevail at specific periods during the year (Cottrell and Kirchman 2000; Eiler et al.2003; Pinhassi and Berman 2003). A metatranscriptomic study found that Alphaproteobacteria and Bacteriodetes from an alpine lake express several transcripts related to DOP uptake (ATP, Glu3P, phosphonate uptake) (Vila-Costa et al.2012) suggesting that they might contribute substantially to DOP cycling.
Bacteroidetes, which are often under-represented in the uptake of low-molecular-weight compounds (Cottrell and Kirchman 2000; Salcher, Posch and Pernthaler 2013), have, nevertheless, been found to harbor high proportions of cells positive for the uptake of P-containing substrates (Alonso-Sáez and Gasol 2007; Longnecker, Lomas and Van Mooy 2010; Sebastián et al.2012; Pérez, Rofner and Sommaruga 2015). Similarly, previous studies revealed that Alphaproteobacteria contribute to ATP uptake proportionally to their abundance (Alonso-Sáez and Gasol 2007; Sebastián et al.2012; Pérez, Rofner and Sommaruga 2015; Rofner, Sommaruga and Pérez 2016) and also that they account for the majority of ugp-transporter genes responsible for Gly3P uptake in marine waters (Luo et al.2009). Our study confirms that Alphaproteobacteria and Bacteroidetes utilize beside ATP, Glu6P and Gly3P, and shows that in P-limited systems, they contribute to DOP uptake proportionally to their in situ abundance (Fig. 3).
CONCLUSIONS
Here, we have characterized the strategies of P-limited freshwater bacteria to acquire DOP compounds. We showed that beside ATP, Gly3P and Glu6P are readily taken up by freshwater bacteria, which proves that they can efficiently use DOP compounds at a wide range of naturally occurring substrate concentrations. Additionally, we found that the most abundant bacterial groups, namely, AcI Actinobacteria and Betaproteobacteria, exhibited strikingly different DOP uptake patterns. The R-BT cluster of Betaproteobacteria was the most active in acquiring Glu6P and Gly3P indicating that they dominate the uptake of low-molecular-weight DOP compounds. By contrast, AcI Actinobacteria were less involved in DOP acquisition, because either they lack efficient DOP uptake systems or they exhibit low P requirements.
Acknowledgments
We thank Josef Franzoi, Gry Larsen and Salvador Morales-Gomez for running the chemical analyses. The work reported is part of the doctoral dissertation of C. R.
FUNDING
This work was supported by the ) to M. T. P. and R. S.].
Conflict of interest. None declared.
REFERENCES
- Alonso-Sáez L, Gasol JM. Seasonal variations in the contributions of different bacterial groups to the uptake of low-molecular-weight compounds in northwestern Mediterranean coastal waters. Appl Environ Microbiol. 2007;73:3528–35. doi: 10.1128/AEM.02627-06. [DOI] [PMC free article] [PubMed] [Google Scholar]
- Alonso-Sáez L, Sánchez O, Gasol JM. Bacterial uptake of low molecular weight organics in the subtropical Atlantic: Are major phylogenetic groups functionally different? Limnol Oceanogr. 2012;57:798–808. [Google Scholar]
- Ammerman JW, Azam F. Bacterial 5′-nucleotidase activity in estuarine and coastal marine waters: Characterization of enzyme activity. Limnol Oceanogr. 1991;36:1427–36. [Google Scholar]
- Argast M, Boos W. Co-regulation in Escherichia coli of a novel transport system for sn-glycerol-3-phosphate and outer membrane protein Ic (e, E) with alkaline phosphatase and phosphate-binding protein. J Bacteriol. 1980;143:142–50. doi: 10.1128/jb.143.1.142-150.1980. [DOI] [PMC free article] [PubMed] [Google Scholar]
- Bentzen E, Taylor WD, Millard ES. The importance of dissolved organic phosphorus to phosphorus uptake by limnetic plankton. Limnol Oceanogr. 1992;37:217–31. [Google Scholar]
- Berman T. Differential uptake of orthophosphate and organic phosphorus substrates by bacteria and algae in Lake Kinneret. J Plankton Res. 1988;10:1239–49. [Google Scholar]
- Björkman K, Karl DM. Bioavailability of inorganic and organic phosphorus compounds to natural assemblages of microorganisms in Hawaiian coastal waters. Mar Ecol Prog Ser. 1994;111:265–73. [Google Scholar]
- Brzoska P, Rimmele M, Brzostek K, et al. The pho regulon-dependent ugp uptake system for glycerol-3-phosphate in Escherichia coli is trans inhibited by Pi. J Bacteriol. 1994;176:15–20. doi: 10.1128/jb.176.1.15-20.1994. [DOI] [PMC free article] [PubMed] [Google Scholar]
- Burkert U, Warnecke F, Babenzien D, et al. Members of a readily enriched β-proteobacterial clade are common in surface waters of a humic lake. Appl Environ Microbiol. 2003;69:6550–59. doi: 10.1128/AEM.69.11.6550-6559.2003. [DOI] [PMC free article] [PubMed] [Google Scholar]
- Carini P, Van Mooy BA, Thrash JC, et al. SAR11 lipid renovation in response to phosphate starvation. Proc Natl Acad Sci U S A. 2015;112:7767–72. doi: 10.1073/pnas.1505034112. [DOI] [PMC free article] [PubMed] [Google Scholar]
- Carlson R. A trophic state index for lakes. Limnol Oceanogr. 1977;22:361–9. [Google Scholar]
- Cotner JB, Wetzel RG. Uptake of dissolved inorganic and organic phosphorus compounds by phytoplankton and bacterioplankton. Limnol Oceanogr. 1992;37:232–43. [Google Scholar]
- Cottrell MT, Kirchman DL. Natural assemblages of marine Proteobacteria and members of the Cytophaga-Flavobacter cluster consuming low- and high-molecular-weight dissolved organic matter. Appl Environ Microbiol. 2000;66:1692–97. doi: 10.1128/aem.66.4.1692-1697.2000. [DOI] [PMC free article] [PubMed] [Google Scholar]
- Cottrell MT, Kirchman DL. Contribution of major bacterial groups to bacterial biomass production (thymidine and leucine incorporation) in the Delaware estuary. Limnol Oceanogr. 2003;48:168–78. [Google Scholar]
- Daims H, Bruhl R, Amann R, et al. The domain-specific probe EUB338 is insufficient for the detection of all Bacteria: development and evaluation of a more comprehensive probe set. Syst Appl Microbiol. 1999;22:434–44. doi: 10.1016/S0723-2020(99)80053-8. [DOI] [PubMed] [Google Scholar]
- Duhamel S, Björkman KM, Karl DM. Light dependence of phosphorus uptake by microorganisms in the subtropical North and South Pacific Ocean. Aquat Microb Ecol. 2012;67:225–38. [Google Scholar]
- Eiler A, Langenheder S, Bertilsson S, et al. Heterotrophic bacterial growth efficiency and community structure at different natural organic carbon concentrations. Appl Environ Microbiol. 2003;69:3701–09. doi: 10.1128/AEM.69.7.3701-3709.2003. [DOI] [PMC free article] [PubMed] [Google Scholar]
- Ghylin TW, Garcia SL, Moya F, et al. Comparative single-cell genomics reveals potential ecological niches for the freshwater acI Actinobacteria lineage. ISME J. 2014;8:1–14. doi: 10.1038/ismej.2014.135. [DOI] [PMC free article] [PubMed] [Google Scholar]
- Godwin CM, Cotner JB. Aquatic heterotrophic bacteria have highly flexible phosphorus content and biomass stoichiometry. ISME J. 2015;9:2324–7. doi: 10.1038/ismej.2015.34. [DOI] [PMC free article] [PubMed] [Google Scholar]
- Hahn MW, Pöckl M, Wu QL. Low intraspecific diversity in a Polynucleobacter subcluster population numerically dominating bacterioplankton of a freshwater pond. Appl Environ Microbiol. 2005;71:4539–47. doi: 10.1128/AEM.71.8.4539-4547.2005. [DOI] [PMC free article] [PubMed] [Google Scholar]
- Heath RT, Hansen DH. Dissolved organic phosphorus compounds as a source of phosphorus and carbon to freshwater plankton communities in East Twin Lake, Portage County. Ohio J Sci. 2004;104:35. [Google Scholar]
- Hernandez I, Hwang SJ, Heath RT. Measurement of phosphomonoesterase activity with a radiolabeled glucose-6-phosphate. Role in the phosphorus requirement of phytoplankton and bacterioplankton in a temperate mesotrophic lake. Arch Hyrobiol. 1996;137:265–80. [Google Scholar]
- Hoffer SM, van Uden N, Tommassen J. Expression of the pho regulon interferes with induction of the uhpT gene in Escherichia coli K-12. Arch Microbiol. 2001;176:370–6. doi: 10.1007/s002030100339. [DOI] [PubMed] [Google Scholar]
- Holm-Hansen O, Booth CR. The measurement of adenosine triphosphate in the ocean and its ecological significance. Limnol Oceanogr. 1966;11:510–9. [Google Scholar]
- Hornák K, Jezbera J, Nedoma J, et al. Effects of resource availability and bacterivory on leucine incorporation in different groups of freshwater bacterioplankton, assessed using microautoradiography. Aquat Microb Ecol. 2006;45:277–89. [Google Scholar]
- Hörtnagl P, Pérez MT, Sommaruga R. Living at the border: A community and single-cell assessment of lake bacterioneuston activity. Limnol Oceanogr. 2010;55:1134–44. doi: 10.4319/lo.2010.55.3.1134. [DOI] [PMC free article] [PubMed] [Google Scholar]
- Jansson M, Olsson H, Pettersson K. Phosphatases; origin, characteristics and function in lakes. Hydrobiologia. 1988;170:157–75. [Google Scholar]
- Karl DM. Phosphorus, the staff of life. Nature. 2000;406:31–33. doi: 10.1038/35017683. [DOI] [PubMed] [Google Scholar]
- Karl DM, Björkman K, Dore JE, et al. Ecological nitrogen-to-phosphorus stoichiometry at station ALOHA. Deep Sea Res Pt II. 2001;48:1529–66. [Google Scholar]
- Longnecker K, Lomas MW, Van Mooy BA. Abundance and diversity of heterotrophic bacterial cells assimilating phosphate in the subtropical North Atlantic Ocean. Environ Microbiol. 2010;12:2773–82. doi: 10.1111/j.1462-2920.2010.02247.x. [DOI] [PubMed] [Google Scholar]
- Løvdal T, Tanaka T, Thingstad TF. Algal–bacterial competition for phosphorus from dissolved DNA, ATP, and orthophosphate in a mesocosm experiment. Limnol Oceanogr. 2007;52:1407–19. [Google Scholar]
- Luo H, Benner R, Long RA, et al. Subcellular localization of marine bacterial alkaline phosphatases. Proc Natl Acad Sci U S A. 2009;106:21219–23. doi: 10.1073/pnas.0907586106. [DOI] [PMC free article] [PubMed] [Google Scholar]
- Manz W, Amann R, Ludwig W, et al. Phylogenetic oligodeoxynucleotide probes for the major subclasses of Proteobacteria: problems and solutions. Syst Appl Microbiol. 1992;15:593–600. [Google Scholar]
- Manz W, Amann R, Ludwig W, et al. Application of a suite of 16s rRNA-specific oligonucleotide probes designed to investigate bacteria of the phylum Cytophaga-Flavobacter-Bacteroides in the natural environment. Microbiology. 1996;142:1097–106. doi: 10.1099/13500872-142-5-1097. [DOI] [PubMed] [Google Scholar]
- Minear RA. Characterization of naturally occurring dissolved organophosphorus compounds. Environ Sci Technol. 1972;6:431–37. [Google Scholar]
- Neef A. Anwendung der in situ Einzelzell-Identifizierung von Bakterien zur Populationsanalyse in komplexen mikrobiellen Biozönosen. Ph.D. Thesis. 1997 Technical University of Munich. [Google Scholar]
- Pérez MT, Hörtnagl P, Sommaruga R. Contrasting ability to take up leucine and thymidine among freshwater bacterial groups: implications for bacterial production measurements. Environ Microbiol. 2010;12:74–82. doi: 10.1111/j.1462-2920.2009.02043.x. [DOI] [PMC free article] [PubMed] [Google Scholar]
- Pérez MT, Rofner C, Sommaruga R. Dissolved organic monomer partitioning among bacterial groups in two oligotrophic lakes. Environl Microbiol Rep. 2015;7:265–72. doi: 10.1111/1758-2229.12240. [DOI] [PMC free article] [PubMed] [Google Scholar]
- Pérez MT, Sommaruga R. Differential effect of algal- and soil-derived dissolved organic matter on alpine lake bacterial community composition and activity. Limnol Oceanogr. 2006;51:2527–37. [Google Scholar]
- Pérez MT, Sommaruga R. Temporal changes in the dominance of major planktonic bacterial groups in an alpine lake: discrepancy with their contribution to bacterial production. Aquat Microb Ecol. 2011;63:161–70. [Google Scholar]
- Pernthaler A, Pernthaler J, Amann R. Fluorescence in situ hybridization and catalyzed reporter deposition for the identification of marine bacteria. Appl Environ Microbiol. 2002;68:3094–101. doi: 10.1128/AEM.68.6.3094-3101.2002. [DOI] [PMC free article] [PubMed] [Google Scholar]
- Pinhassi J, Berman T. Differential growth response of colony-forming α- and γ-Proteobacteria in dilution culture and nutrient addition experiments from Lake Kinneret (Israel), the Eastern Mediterranean Sea, and the Gulf of Eilat. Appl Environ Microbiol. 2003;69:199–211. doi: 10.1128/AEM.69.1.199-211.2003. [DOI] [PMC free article] [PubMed] [Google Scholar]
- Posch T, Mindl B, Hornák K, et al. Biomass reallocation within freshwater bacterioplankton induced by manipulating phosphorus availability and grazing. Aquat Microb Ecol. 2007;49:223–32. [Google Scholar]
- Rofner C, Sommaruga R, Pérez MT. Phosphate and ATP uptake by lake bacteria: Does taxonomical identity matter? Environ Microbiol. 2016 doi: 10.1111/1462-2920.13368. [DOI] [PMC free article] [PubMed] [Google Scholar]
- Salcher MM, Pernthaler J, Posch T. Spatiotemporal distribution and activity patterns of bacteria from three phylogenetic groups in an oligomesotrophic lake. Limnol Oceanogr. 2010;55:846–56. [Google Scholar]
- Salcher MM, Pernthaler J, Zeder M, et al. Spatio-temporal niche separation of planktonic Betaproteobacteria in an oligo-mesotrophic lake. Environ Microbiol. 2008;10:2074–86. doi: 10.1111/j.1462-2920.2008.01628.x. [DOI] [PubMed] [Google Scholar]
- Salcher MM, Posch T, Pernthaler J. In situ substrate preferences of abundant bacterioplankton populations in a prealpine freshwater lake. ISME J. 2013;7:896–907. doi: 10.1038/ismej.2012.162. [DOI] [PMC free article] [PubMed] [Google Scholar]
- Schowanek D, Verstraete W. Posphonate utilization by bacterial cultures and enrichments from environmental samples. Appl Environ Microbiol. 1990;56:895–903. doi: 10.1128/aem.56.4.895-903.1990. [DOI] [PMC free article] [PubMed] [Google Scholar]
- Schweizer H, Argast M, Boos W. Characteristics of a binding protein-dependent transport system for sn-glycerol-3-phosphate in Escherichia coli that is part of the pho regulon. J Bacteriol. 1982;150:1154–63. doi: 10.1128/jb.150.3.1154-1163.1982. [DOI] [PMC free article] [PubMed] [Google Scholar]
- Sebastián M, Pitta P, González JM, et al. Bacterioplankton groups involved in the uptake of phosphate and dissolved organic phosphorus in a mesocosm experiment with P-starved Mediterranean waters. Environ Microbiol. 2012;14:2334–47. doi: 10.1111/j.1462-2920.2012.02772.x. [DOI] [PubMed] [Google Scholar]
- Sekar R, Pernthaler A, Pernthaler J, et al. An improved protocol for quantification of freshwater Actinobacteria by fluorescence in situ hybridization. Appl Environ Microbiol. 2003;69:2928–35. doi: 10.1128/AEM.69.5.2928-2935.2003. [DOI] [PMC free article] [PubMed] [Google Scholar]
- Šimek K, Horňák K, Jezbera J, et al. Influence of top-down and bottom-up manipulations on the R-BT065 subcluster of β-Proteobacteria, an abundant group in bacterioplankton of a freshwater reservoir. Appl Environ Microbiol. 2005;71:2381–90. doi: 10.1128/AEM.71.5.2381-2390.2005. [DOI] [PMC free article] [PubMed] [Google Scholar]
- Šimek K, Horňak K, Jezbera J, et al. Maximum growth rates and possible life strategies of different bacterioplankton groups in relation to phosphorus availability in a freshwater reservoir. Environ Microbiol. 2006;8:1613–24. doi: 10.1111/j.1462-2920.2006.01053.x. [DOI] [PubMed] [Google Scholar]
- Šimek K, Kasalický V, Jezbera J, et al. Broad habitat range of the phylogenetically narrow R-BT065 cluster, representing a core group of the Betaproteobacterial genus Limnohabitans. Appl Environ Microbiol. 2010;76:631–9. doi: 10.1128/AEM.02203-09. [DOI] [PMC free article] [PubMed] [Google Scholar]
- Šimek K, Pernthaler J, Weinbauer MG, et al. Changes in bacterial community composition and dynamics and viral mortality rates associated with enhanced flagellate grazing in a mesoeutrophic reservoir. Appl Environ Microbiol. 2001;67:2723–33. doi: 10.1128/AEM.67.6.2723-2733.2001. [DOI] [PMC free article] [PubMed] [Google Scholar]
- Sommaruga R, Augustin G. Seasonality in UV transparency of an alpine lake is associated to changes in phytoplankton biomass. Aquat Sci. 2006;68:129–41. [Google Scholar]
- Sterner RW. Elemental stoichiometry of species in ecosystems. In: Jones CJ, Lawton JH, editors. Linking Species & Wcosystems. New York: Chapman & Hall; 1995. pp. 240–52. [Google Scholar]
- Tabor P, Neihof R. Improved microautoradiographic method to determine individual microorganisms active in substrate uptake in natural waters. Appl Environ Microbiol. 1982;44:945–53. doi: 10.1128/aem.44.4.945-953.1982. [DOI] [PMC free article] [PubMed] [Google Scholar]
- Tolotti M, Thies H. Phytoplankton community and limnochemistry of Piburger See (Tyrol, Austria) 28 years after lake restoration. J Limnol. 2002;61:77–88. [Google Scholar]
- Vadstein O. Heterotrophic, planktonic bacteria and cycling of phosphorus. Adv Microb Ecol. 2000;16:115–67. [Google Scholar]
- van Veen HW. Phosphate transport in prokaryotes: molecules, mediators and mechanisms. Antonie van Leeuwenhoek. 1997;72:299–315. doi: 10.1023/a:1000530927928. [DOI] [PubMed] [Google Scholar]
- Vila-Costa M, Sharma S, Moran MA, et al. Diel gene expression profiles of a phosphorus limited mountain lake using metatranscriptomics. Environ Microbiol. 2012;15:1190–203. doi: 10.1111/1462-2920.12033. [DOI] [PubMed] [Google Scholar]
- Wanner BL. Gene regulation by phosphate in enteric bacteria. J Cell Biochem. 1993;51:47–54. doi: 10.1002/jcb.240510110. [DOI] [PubMed] [Google Scholar]
- Warnecke F, Sommaruga R, Sekar R, et al. Abundances, identity, and growth state of Actinobacteria in mountain lakes of different UV transparency. Appl Environ Microbiol. 2005;71:5551–9. doi: 10.1128/AEM.71.9.5551-5559.2005. [DOI] [PMC free article] [PubMed] [Google Scholar]
- Yang KC, Wang M, Metcalf WW. Uptake of glycerol-2-phosphate via the ugp-encoded transporter in Escherichia coli K-12. J Bacteriol. 2009;191:4667–70. doi: 10.1128/JB.00235-09. [DOI] [PMC free article] [PubMed] [Google Scholar]