Abstract
In our experience, complaints of ankle swelling are more common in summer, typically from patients with no obvious cardiovascular disease. Surprisingly, this observation has never been reported. To objectively establish this phenomenon, we sought evidence of seasonality in the public’s Internet searches for ankle swelling. Our data, obtained from Google Trends, consisted of all related Google searches in the United States from January 4, 2004, to January 26, 2016. Consistent with our expectations and confirmed by similar data for Australia, Internet searches for information on ankle swelling are highly seasonal (highest in midsummer), with seasonality explaining 86% of search volume variability.
Keywords: seasonal, edema, Web browser/Google
INTRODUCTION
Each summer we encounter an increased volume of patients complaining of ankle swelling—patients who do not go on to develop cardiovascular, venous, or lymphatic disease. This study looks to provide objective evidence that, for some patients, the symptom burden of ankle swelling is seasonally modulated.
Internet search volume has been used successfully to show unexpected seasonality in such conditions as nocturnal leg cramps.1 Using similar methods, we looked for seasonal modulation in the public’s interest in ankle swelling as measured by the volume of Google Internet searches related to ankle swelling.
METHODS
The Google Trends search engine provides data from 2004 onward about the frequency with which the public enters specified search terms (www.google.com/trends).2 Reporting can be global or region specific and is presented on a relative scale according to the proportion of overall searches that the queried term represents. We used a composite search term containing any of “ankle swelling,” “swollen ankles,” “swollen feet,” or “swollen legs,” and our data consisted of all such Google searches originating from the United States (the single largest geographic region) during the period of available data (January 4, 2004, to January 26, 2016).
We plotted Internet search volume as a time series and performed regressions, using GraphPad Prism 7 (GraphPad Software, Inc), with 2 models that represented either the null hypothesis (no seasonal variation) or the seasonal hypothesis (annual cycling in symptoms). The null model consisted of a best-fit straight line that allowed for linear change in search volume over time but no seasonality. The seasonal model consisted of the best-fit combination of a straight line and a sinusoid according to the following equation:
We used a sum-of-squares F test to compare the 2 models and calculate a P value for the difference in fit. We performed an identical analysis for Australia, where seasons are reversed.
RESULTS
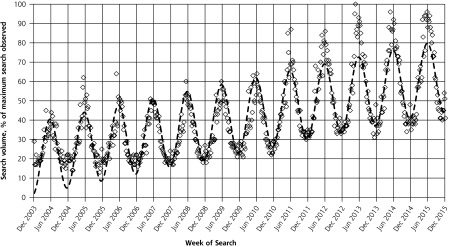
The seasonal model provided a significantly better fit than the null model (P <.0001). Seasonality explained 86% of the variability in search volume (ie, R2 = 0.86) with the peak of searches occurring in mid-June (midsummer) and the trough in mid-December (midwinter) (Figure 1).
Figure 1.
Google Trends Internet search volume for “ankle swelling,” “swollen ankles,” “swollen feet,” or “swollen legs” in the United States from January 4, 2004 to January 26, 2016.
Horizontal axis markers (Dec, Jun) are centered mid-month. The dashed line is the best-fit sinusoid.
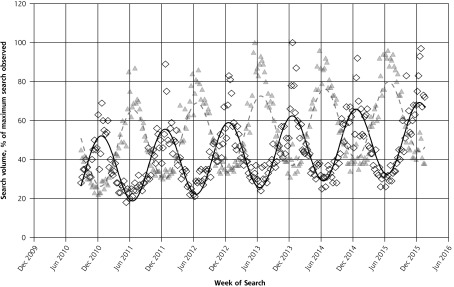
Australia’s reversed seasons follow the same pattern (Figure 2), (R2 = 0.73; 24.8-week phase difference).
Figure 2.
Google Trends Internet search volume for ‘ankle swelling,’ ‘swollen ankles,’ ‘swollen feet, or ‘swollen legs’ in Australia (◊) and the United States (Δ) (August 29, 2010, to January 26, 2016).
Horizontal axis markers (Dec, Jun) are centered mid-month. The solid line and dashed line are best-fit sinusoids for Australia and the United States, respectively.
DISCUSSION
Internet searches for ankle swelling and related terms are highly seasonal, with public interest peaking in midsummer. In contrast, heart failure admissions have been shown to exhibit the opposite seasonal trend, peaking in winter.3,4
An analysis of body composition in dialysis patients shows extracellular water content to be seasonal, increasing in spring and summer.5 This seasonal variation in fluid balance might also be true for the general population. Although seasonality in human physiology is seldom contemplated, evidence suggests that the rate of growth in children is greatest in summer (when resources are most plentiful) and immune activity is greatest in winter (when likelihood of disease exposure increases).6,7 Fluid retention during the hottest months of the year may also occur to evolutionary advantage.
The strengths of this study include the long period of observation, the large geographic areas covered, observations above and below the equator, and the lack of reporting and observer bias. Limitations include that information seeking is a surrogate for ankle swelling and that information seeking may be influenced by factors other than objective ankle swelling, such as aesthetics. Those with ankle swelling might, for instance, be more conscious of the problem in summer when lighter clothing generally leads to ankles being more visible. The individual doing the searching is also not necessarily the one experiencing the symptom. Health care students, for instance, might search for information on medical conditions seasonally according to their academic calendar (although such searches in the United States would be expected to fall, rather than rise, in the summer). These searches might also represent a different clinical presentation than we assume, such as ankle swelling that results from ankle sprains (though a Google Trends search for “ankle sprain” produces a non-sinusoidal graph). We are also unable to identify the cohort that is searching for this information. Contrary to our expectations, seekers of information on ankle swelling may be a subset of the population with cardiac, lymphatic, or venous disease.
Further research on patients with summertime ankle swelling would be needed to establish whether such patients have, or go on to develop, cardiovascular disease. Further research would also be needed to establish the mechanism behind this observation.
Although the utility of Google Trends as a research tool is limited by the inability to know anything about the searcher, its reliability as a means to assess overall public interest has been well documented.8,9 Disease seasonality, as we and others have shown, appears to be productively pursued using this tool.
Footnotes
Conflicts of interest: authors report none.
References
- 1.Garrison SR, Dormuth CR, Morrow RL, Carney GA, Khan KM. Seasonal effects on the occurrence of nocturnal leg cramps: a prospective cohort study. Can Med Assoc J. 2015;187(4):248–253. [DOI] [PMC free article] [PubMed] [Google Scholar]
- 2.Google Trends Help Center. https://support.google.com/trends/?hl=en. Updated 2015 Accessed Aug 12, 2015.
- 3.Inglis SC, Clark RA, Shakib S, et al. Hot summers and heart failure: seasonal variations in morbidity and mortality in Australian heart failure patients (1994–2005). Eur J Heart Fail. 2008;10(6):540–549. [DOI] [PubMed] [Google Scholar]
- 4.Patel NJ, Nalluri N, Deshmukh A, et al. Seasonal trends of heart failure hospitalizations in the United States: a national perspective from 2000 to 2011. Int J Cardiol. 2014;173(3):562–563. [DOI] [PubMed] [Google Scholar]
- 5.Broers NJH, Usvyat LA, Marcelli D, et al. Season affects body composition and estimation of fluid overload in haemodialysis patients: variations in body composition; a survey from the European MONDO database. Nephrol Dial Transplant. 2015;30(4):676–681. [DOI] [PubMed] [Google Scholar]
- 6.Gelander L, Karlberg J, Albertsson-Wikland K. Seasonality in lower leg length velocity in prepubertal children. Acta Paediatr. 1994; 83(12):1249–1254. [DOI] [PubMed] [Google Scholar]
- 7.Dopico XC, Evangelou M, Ferreira RC, et al. Widespread seasonal gene expression reveals annual differences in human immunity and physiology. Nat Commun. 2015;6:7000. [DOI] [PMC free article] [PubMed] [Google Scholar]
- 8.Bragazzi NL, Bacigaluppi S, Robba C, Nardone R, Trinka E, Brigo F. Infodemiology of status epilepticus: A systematic validation of the Google Trends-based search queries. Epilepsy Behav. 2016;55: 120–123. [DOI] [PubMed] [Google Scholar]
- 9.Schootman M, Toor A, Cavazos-Rehg P, et al. The utility of Google Trends data to examine interest in cancer screening. BMJ Open. 2015;5(6):e006678. [DOI] [PMC free article] [PubMed] [Google Scholar]


