

Abstract
Uniporters are a large class of transporters mediating facilitated diffusion of substrates along the direction of the substrate concentration gradient. Recently, structures of several important uniporters have been reported; however, the precise mechanisms of uniporter function remain subject of debate. Here, we present a series of general thermodynamic descriptions of uniporters, aimed at understanding the structure‐function relationship of uniporters, and in particular to reconcile biochemical phenomena of uniporters with our previously proposed thermodynamic model of general transporters.
Keywords: uniporters, differential binding energy, elastic conformational energy, transition‐state energy barrier, rate‐limiting step, kinetic asymmetry
Uniporter
The cellular membrane presents a major energy barrier to hydrophilic small molecules to move across. This barrier is usually so high that translocation of these small molecules across the membrane along their concentration gradients is practically halted, even in the presence of a thermodynamically favorable chemical potential. The function of uniporters is to lower this energy barrier for selected substrates, so that the substrates can be transported along their own concentration gradients, a process called facilitated diffusion. A uniporter is a transporter that does not require energy input other than the substrate chemical potential. Like all transporters, a uniporter differs from a channel in that the former uses the alternating access mechanism1 while the latter does not. Using this mechanism, a uniporter switches between two major conformations, namely inward‐facing (C In) and outward‐facing (C Out), allowing its substrate‐binding site to be accessible alternatingly to both sides of the membrane. The energy barrier for a hydrophilic molecule to transport passively across the cellular membrane is analogous to the transition‐state energy barrier in a chemical reaction. According to the transition‐state theory of enzymology, an enzyme stabilizes the transition state of the reactants, thus effectively lowering the transition‐state energy barrier. However, the reaction is driven by the chemical energy released during the reaction (or acquired from the environment), rather than the substrate binding energy per se. Uniporters may utilize the substrate chemical potential to drive the substrate movement in a conceptually similar way. Examples of structural studies on uniporters include recently reported crystal structures of GLUT1,2 GLUT3,3 GLUT5,4 and semi‐SWEET5 sugar transporters, and these studies provide the structural basis for a more detailed understanding of the mechanisms responsible for reducing the transition‐state energy barrier as well as for ensuring substrate selectivity. Meanwhile, a new thermodynamic picture of the transport process of uniporters is emerging, and will be the focus of this review.
Thermodynamics of the Chemical Potential driven Transport
For simplicity, we assume in the following discussion that the substrates of uniporters do not carry electric charges. Therefore, the transport is considered to be electroneutral in nature (for electrogenic uniporters, see Ref. 6.) For electroneutral uniporters, the driving energy may only come from the chemical potential of the substrate across the membrane, that is, difference between substrate concentrations in C Out ([S]out) and C In ([S]in) states. In general, the chemical potential of the substrate, Δμ(s) (≡ −RTln([S]L/[S]R)) which solely depends on the difference of substrate concentrations between the two sides of the membrane, can be divided into three terms: ΔG L, ΔG D, and ΔG R, where the subscripts L, D, and R represent loading, differential binding, and releasing, respectively (see Supporting Information Appendix [i]). For the uniporter to function sustainably, Δμ(s), ΔG L, and ΔG R should be of negative values (or close to zero). Furthermore, for a given substrate, the differential binding energy, ΔG D, is determined by the difference between substrate‐binding affinities (i.e., K d values) of the two major conformational states, is an intrinsic property of the transporter (i.e., independent of substrate concentration on either side of the membrane), and is experimentally measurable based on the population distribution among the different states as a function of substrate concentration.6 In case that its value is negative (i.e., K d,R < K d,L), ΔG D directly contributes to the driving energy of the substrate‐carrying conformational change. Nevertheless, driving energy gained from ΔGD (i.e., becoming more negative) is associated with the loss of ΔG L and/or ΔG R (i.e., becoming less negative).
For a given substrate, the energy barrier between the C In and C Out states of the transporter should be significantly lower than that of the membrane alone, thus rendering the transport of the substrate kinetically probable. In general, an electroneutral uniporter can transport substrates in both inward‐ and outward‐moving directions, depending on the chemical potential of the substrate. However, the kinetics of the transporter is strongly affected by the free‐energy landscape, which changes with the transport direction (Fig. 1). Without loss of generality, it shall be assumed that [S]out > [S]in [Fig. 1(A)]. As a result, the direction of the transport occurs from the outside (i.e., the loading side) to the inside (i.e., the releasing side) of the cell; thus, we will call this process influx transport in contrast to efflux transport in the opposition direction.
Figure 1.
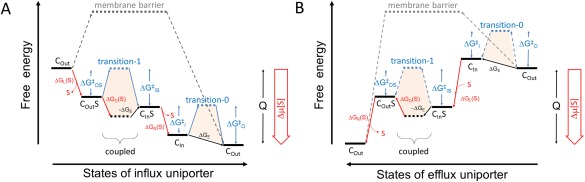
Schematic diagram of the energy landscape of uniporters. A. Influx uniporter. B. Efflux uniporter. The free‐energy landscape plot shown describes the thermodynamic relationship between the different states of the uniporter. Transition‐state energy barriers are shown as dashed lines. Horizontal lines represent states. Tilted arrows represent transitions between states. Transitions associated with the chemical potential of the substrate are shown in red. Subscripts L, R, D, and E represent energy terms associated with loading, releasing, differential binding, and elastic, respectively. Color‐filled polygons indicate intrinsic configurations of the transporter in the two transition states, independent of variations of the substrate concentrations. The relative scale of Δ and Δ is usually unknown. As the transport process cycles, the starting and end states are identical, only differing by the release of heat (Q) during one transport cycle. Thus, the end state of the plot must be lower than the starting state.
Raising the substrate concentration on the loading/extracellular side, for example, when [S]L ≫ K d,Out, increases the concentration of the transporters on the C Out side of the energy barrier (i.e., the temporal fraction that the C Out state is occupied by a substrate, [C Out S]), thus resulting in an increased rate of forward movement. Assuming [S]L ≪ K M, the forward rate (vforward, see Supporting Information Appendix [ii]) is proportional to the substrate concentration on the loading side. In thermodynamic terms, increase of [S]L is equivalent to reducing of the forward energy barrier (Δ > 0, also called activating energy; where subscript O stands for C Out and S for substrate‐bound) by |ΔG L|. If the value of this apparent energy barrier (Δ −|ΔG L|) becomes negative, the forward movement will become thermodynamically more favorable, and thus the negative “barrier” practically becomes a driving power. Although we have made the assumption of [S]L ≪ K M, generally the above discussion remains correct qualitatively. In a similar argument, lowering the substrate concentration on the releasing/intracellular side of the membrane (e.g., when [S]In ≪ K d,In) decreases the concentration on the C In side of the transition barrier (i.e., [C In S]), thus decreasing the rate of backward movement of the substrate (v backward). In thermodynamics terms, this is equivalent to increasing of the backward energy barrier (Δ > 0) by |ΔG R|. If the resulting apparent energy barrier (Δ +|ΔG R|) becomes significantly larger than RT, the backward movement may be effectively reduced. The overall transition rate is the difference between v forward and v backward, but predominated by the former.
Furthermore, after release of the substrate, the uniporter is required to return to its resting state (by definition). If the resting state of the uniporter happens to be the loading state [i.e., C Out in Fig. 1(A)], some elastic energy (−ΔG E > 0) stored in the releasing state (C In) would facilitate the substrate‐free transporter to be converted back to the resting state. Such a substrate‐free conformational change is referred to as relaxation.7 The stronger (i.e., more negative) the ΔG E, the more time the transporter will spend in its loading state [i.e., C Out in Fig. 1(A)] in a thermodynamic equilibrium between the C Out and C In states. In contrast, if ΔG E has a positive value, the releasing state of the uniporter would become the resting state. Therefore, ΔG E represents the stability difference between the C Out and C In states, and is experimentally measurable by determining of the population distribution of the transporter in the absence of substrate. The (plus or minus) sign of ΔG E determines whether C In or C Out state is the resting state. In GLUT‐like uniporters and, in a more general sense, transporters of the major facilitator superfamily (MFS), ΔG E may be provided by conserved motif‐A‐like structural elements stabilizing either the C Out or C In state.2, 4, 6, 8 However, it should be noted that crystal structures of transporters are determined in the absence of membrane environment but the presence of detergent(s) and crystal packing. Thus, conformations of transporters observed in crystals do not necessarily represent the true resting states of the corresponding proteins in a membrane environment. In addition, ΔG E is the differential free‐energy between the two states of the transporter in the absence of substrates.6 Therefore, similar to ΔG D, ΔG E is an intrinsic property of the transporter and does not depend on the substrate concentration on either side of the membrane. Both ΔG D and ΔG E are important, measurable parameters to describe a given transporter.
Two major conformational transitions exist in a transport cycle of a uniporter, termed substrate‐free transition‐0 and substrate‐carrying transition‐1 (Fig. 1). Their relative rate determines which transition is the rate‐limiting step of the transport cycle.
Kinetic Asymmetry, Transacceleration, and Others
Uniporters are often found to possess kinetic asymmetry in the two transport directions.9 In such an experiment, the same set of loading and releasing concentrations of substrate (i.e., [S]L and [S]R) is applied individually to both influx and efflux transports of the same uniporter. Yet, the transport rates in the two directions are usually different. The mechanism behind this phenomenon remains a subject of debate. Because the free‐energy landscapes of the influx and efflux transports differ in their shapes (Fig. 1), it is not surprising that their rates differ too. However, the key question to be addressed here is as to what the essential factor determining the kinetic asymmetry exactly is.
Transport activity (i.e., how fast the transport cycle may run) is determined by the rate‐limiting step of the transport cycle. A rate‐limiting step is the transition state that the relative population on the two sides of which differs most significantly from the equilibrium distribution, with all other steps essentially being in a thermodynamic equilibrium. The rate‐limiting step is most likely to be the transition state of the highest energy barrier. For example, in Figure 1(A) either substrate‐carrying transition‐1 or substrate‐free transition‐0 is the rate limiting step. Noticeably, because of the free‐energy difference between the two sides, the corresponding heights of the energy barrier of a given transition state may differ from each other. For example, in Figure 1(A) Δ > Δ , and Δ < Δ These differences are composed of ΔG D and/or −ΔG E, and are thus intrinsic properties of the transporter (for a given substrate).
First, it shall be considered that the substrate‐carrying transition‐1 is the rate‐limiting step, that is, (Δ +Δ ) ≫ (Δ +Δ ). Based on the assumption that [S]L ≪ K M, an influx transport would be driven by ΔG 1,influx (≡ Δ −RTln([S]L/K d,Out) < 0), and an efflux transport would be driven by ΔG 1,efflux (≡ Δ −RTln([S]L/K d,In) < 0). Under these conditions, the relative rate of transition‐1 between influx and efflux transports is determined by the differential driving power of transport‐1, that is, ΔΔG 1 (≡ ΔG 1,efflux −ΔG 1,influx). It can be proved mathematically that ΔΔG 1 equals to Δ −Δ (see Supporting Information Appendix [iii]). In other words, the sign and magnitude of the free‐energy difference associated with the non‐rate limiting transition‐0 determines the direction and strength of the kinetic asymmetry, if transition‐1 is the rate‐limiting step.
Similarly, if the substrate‐free transition‐0 is the rate‐limiting step, the relative rate of transition‐0 between influx and efflux transports is determined by the differential driving power of transport‐0, that is, ΔΔG 0 (≡ ΔG 0,efflux −ΔG 0,influx), which equals to Δ −Δ . Here too, the sign and magnitude of the free‐energy difference associated with the non‐rate limiting transition‐1 determines the direction and strength of the kinetic asymmetry, in case that transition‐0 is the rate‐limiting step. This seemingly counter‐intuitive result can be explained as follows: since the driving energy from the substrate chemical potential remains the same for both influx‐ and efflux‐transport cycles, the less energy spent on non‐rate limiting steps, the more energy would be available for the rate‐liming step. As a practical example, if transition‐0 is the rate‐limiting step and Δ < Δ , the efflux transport would be faster than the influx transport. In a classical kinetic study on GLUT1,10 the values of Δ , Δ , Δ , and Δ were reported to be 173, 127, 88, and 32 kJ mol−1, respectively. Although these values appear to be too high for an effective uniporter, their relative values is likely to be correct. Interestingly, the efflux transport of GLUT1 was found to be 10 times faster than the influx transport, which is qualitatively consistent with our kinetics model: (i) transition‐0 is the rate limiting step; (ii) Δ < Δ ; and (iii) efflux is faster than influx. Similar discussions may be valid for other situations. For example, if the transition‐state energy barrier(s) is reduced (e.g., by increasing the temperature from 0°C to 25°C), this kinetic asymmetry may disappear.10
Interestingly, it is feasible that an energetically favorable, forward movement of a substrate‐carrying uniporter is coupled with an energy‐consuming, backward substrate‐free conformational change (i.e., relaxation) of another.7, 9 Such a coupling would be equivalent to storing ΔG E. In this case, the transport speed is likely to be accelerated, because the rate‐limiting transition‐state energy barrier may be reduced (analogous to a double‐cylinder engine). Not surprisingly then, many uniporters form oligomers, maybe because evolution favored the state of cooperativity.9
A counter‐flow experiment (Fig. 2) can be considered as a special case of coupling, in which a substrate and its radioisotope‐labeled counterpart (usually at the same concentration) may diffuse in opposite directions. In the uniporter research field, a much‐studied phenomenon exists that is called trans‐acceleration,7 that is, the transport of one type of substrate (often radioisotope‐labeled) from one side of the membrane can be accelerated by the existence of another type of substrate (e.g., unlabeled) on the opposite side of the membrane. In fact, this is one form of counter‐flow experiment, although the two substrates on the opposite sides of the membrane may differ chemically (e.g., fructose vs. urate11) or in concentration. In any of these experimental or natural processes, the inward transport is driven by the chemical potential of one substrate, whereas the outward transport is driven by the other, forming a functional cycle as a result. In fact, both influx and efflux transport rates are increased, since the two chemical potentials drives the transport cycle in a cooperative manner (Fig. 2). Furthermore, if the chemical potential of the first substrate is sufficiently strong, it may even be able to drive the second substrate to move against its own chemical potential. Such a phenomenon has been observed in GLUT1.7 In this case, the uniporter has been transformed into a secondary active transporter, and more specifically, into an antiporter (or an exchanger). However, an effective antiporter requires either a tight energy coupling between the two transport processes in opposite directions6 or a high‐energy barrier for the substrate‐free transition‐0. Otherwise, the transporter might simply return to its resting state through an energetically favorable relaxation process.
Figure 2.

Schematic diagram of the energy landscape of a counter‐flow assay. Note: Under isotherm‐isobaric conditions, dilution is a heat‐absorbing process. Therefore, the released heat Q converted from substrate chemical potentials may not be experimentally measurable.
Moreover, allosteric regulations may modulate the transport speed by adjusting the heights of the transition‐state energy barriers, for example, by changing the stability of either the C Out or C In state. Consistent with its biological function(s), for example, sugar uptake by GLUT1 is inhibited by ATP.12, 13 In addition, it is often observed that disrupting the balance between the C In and C Out states, for example, by mutations, results in reduction and even abolishing of the transport activity of MFS transporters.14 This phenomenon can be readily explained in the thermodynamic framework presented here. For instance, decrease of the stability of C In is necessarily accompanied by decreases of Δ as well as Δ , such that the substrate‐carrying transition‐1 may become thermodynamically unfavorable in the influx transport [Fig. 1(A)], assuming that the C In S state has sufficiently long life time to go back to the C Out S state.
Taken together, both thermodynamic and kinetic properties of the transporter play important roles in the transport process: While a favorable overall Δμ(S) provides the thermodynamic driving force, a stronger driving power to the rate‐limiting step likely accelerates the transport rate of uniporters. Therefore, the thermodynamics view presented here may provide a unifying theoretical framework for understanding mechanisms of uniporters.
Abbreviations
- CIn
inward‐facing conformation
- COut
outward‐facing conformation.
Supporting information
Supporting Information Appendix.
Acknowledgments
The authors thank Dr. Torsten Juelich for linguistic assistance during the preparation of this manuscript.
REFERENCES
- 1. Jardetzky O (1966) Simple allosteric model for membrane pumps. Nature 211:969–970. [DOI] [PubMed] [Google Scholar]
- 2. Deng D, Xu C, Sun P, Wu J, Yan C, Hu M, Yan N (2014) Crystal structure of the human glucose transporter GLUT1. Nature 510:121–125. [DOI] [PubMed] [Google Scholar]
- 3. Deng D, Sun P, Yan C, Ke M, Jiang X, Xiong L, Ren W, Hirata K, Yamamoto M, Fan S, Yan N (2015) Molecular basis of ligand recognition and transport by glucose transporters. Nature 526:391–396. [DOI] [PubMed] [Google Scholar]
- 4. Nomura N, Verdon G, Kang HJ, Shimamura T, Nomura Y, Sonoda Y, Hussien SA, Qureshi AA, Coincon M, Sato Y, Abe H, Nakada‐Nakura Y, Hino T, Arakawa T, Kusano‐Arai O, Iwanari H, Murata T, Kobayashi T, Hamakubo T, Kasahara M, Iwata S, Drew D (2015) Structure and mechanism of the mammalian fructose transporter GLUT5. Nature 526:397–401. [DOI] [PMC free article] [PubMed] [Google Scholar]
- 5. Xu Y, Tao Y, Cheung LS, Fan C, Chen LQ, Xu S, Perry K, Frommer WB, Feng L (2014) Structures of bacterial homologues of SWEET transporters in two distinct conformations. Nature 515:448–452. [DOI] [PMC free article] [PubMed] [Google Scholar]
- 6. Zhang XC, Zhao Y, Heng J, Jiang D (2015) Energy coupling mechanisms of MFS transporters. Protein Sci 24:1560–1579. [DOI] [PMC free article] [PubMed] [Google Scholar]
- 7. Vollers SS, Carruthers A (2012) Sequence determinants of GLUT1‐mediated accelerated‐exchange transport: analysis by homology‐scanning mutagenesis. J Biol Chem 287:42533–42544. [DOI] [PMC free article] [PubMed] [Google Scholar]
- 8. Jiang D, Zhao Y, Wang X, Fan J, Heng J, Liu X, Feng W, Kang X, Huang B, Liu J, Zhang XC (2013) Structure of the YajR transporter suggests a transport mechanism based on the conserved motif A. Proc Natl Acad Sci USA 110:14664–14669. [DOI] [PMC free article] [PubMed] [Google Scholar]
- 9. Carruthers A, DeZutter J, Ganguly A, Devaskar SU (2009) Will the original glucose transporter isoform please stand up! Am J Physiol Endocrinol Metab 297:E836–E848. [DOI] [PMC free article] [PubMed] [Google Scholar]
- 10. Lowe AG, Walmsley AR (1986) The kinetics of glucose transport in human red blood cells. Biochim Biophys Acta 857:146–154. [DOI] [PubMed] [Google Scholar]
- 11. Long W, Panwar P, Witkowska K, Wong K, O'Neill D, Chen XZ, Lemieux MJ, Cheeseman CI (2015) Critical roles of two hydrophobic residues within human glucose transporter 9 (hSLC2A9) in substrate selectivity and urate transport. J Biol Chem 290:15292–15303. [DOI] [PMC free article] [PubMed] [Google Scholar]
- 12. Carruthers A, Helgerson AL (1989) The human erythrocyte sugar transporter is also a nucleotide binding protein. Biochemistry 28:8337–8346. [DOI] [PubMed] [Google Scholar]
- 13. Blodgett DM, De Zutter JK, Levine KB, Karim P, Carruthers A (2007) Structural basis of GLUT1 inhibition by cytoplasmic ATP. J Gen Physiol 130:157–168. [DOI] [PMC free article] [PubMed] [Google Scholar]
- 14. Zhao Y, Mao G, Liu M, Zhang L, Wang X, Zhang XC (2014) Crystal structure of the E. coli peptide transporter YbgH. Structure 22:1–9. [DOI] [PubMed] [Google Scholar]
Associated Data
This section collects any data citations, data availability statements, or supplementary materials included in this article.
Supplementary Materials
Supporting Information Appendix.