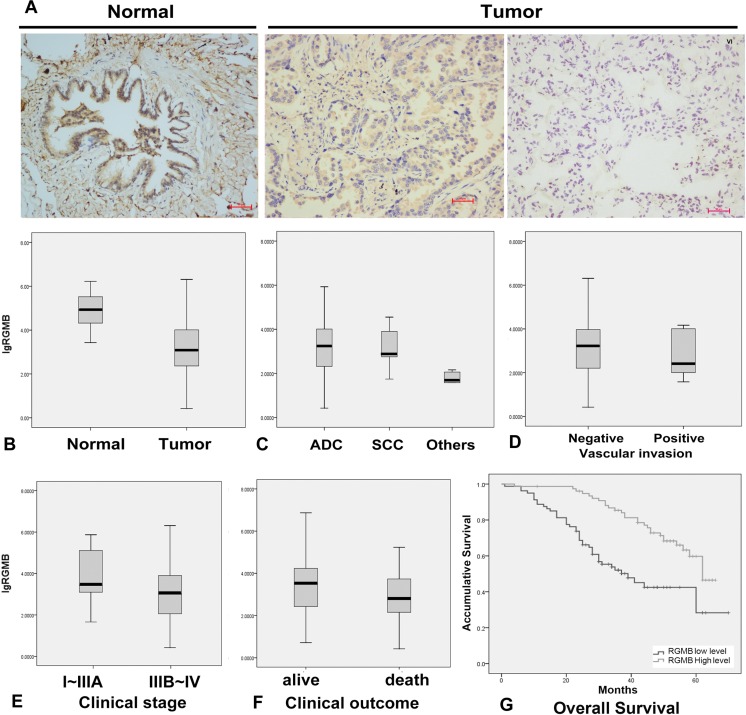
Figure 1. RGMB expression and association with lung cancer progression.
(A) Representative IHC images show a high level of RGMB expression in normal lung tissues (left, N), weak expression of RGMB in stage I tumors (middle), and the absence of RGMB expression in stage IV tumors (right) (scale bar = 100 μm). (B–E) RGMB transcription levels in (B) lung cancer [T, median: 1,217.815, interquartile range (IQR) 9,073.67, n = 296] and background tissues (N, median: 83,114.17, IQR: 259,640.2, n = 22, P ≤ 0.001), (C) in adenocarcinoma (ADC, median: 1,462.276, IQR: 10,349.5, n = 270), squamous cell carcinoma (SCC, median: 725.313, IQR: 10,651.07, n = 17) and other histological types (median: 48.912, IQR: 81.169, n = 9, P ≤ 0.001), (D) in patients with vascular invasion (median: 420.478, IQR: 7651.594, n = 8) and without vascular invasion (median: 1,319.333, IQR: 10814.95, n = 292, P ≤ 0.1), (E) in early-stage patients (median: 2,358.109, IQR: 109860, n = 261) and late-stage patients (median: 1,025.724, IQR: 9814.407, n = 33, P = 0.017). (F) Patients with better clinical outcomes have higher RGMB expression levels (median: 3,153.453, IQR: 17,853.13, n = 197) compared to those with poor outcomes (median: 710.577, IQR: 6,350.661, n = 85, P = 0.015). (G) Kaplan-Meier survival curves show the overall prognosis of patients with high RGMB expression (median: 62 months, 95% CI 58–67, P < 0.001) and low RGMB levels (median: 39 months, 95% CI 27–51) based on log-rank tests.

