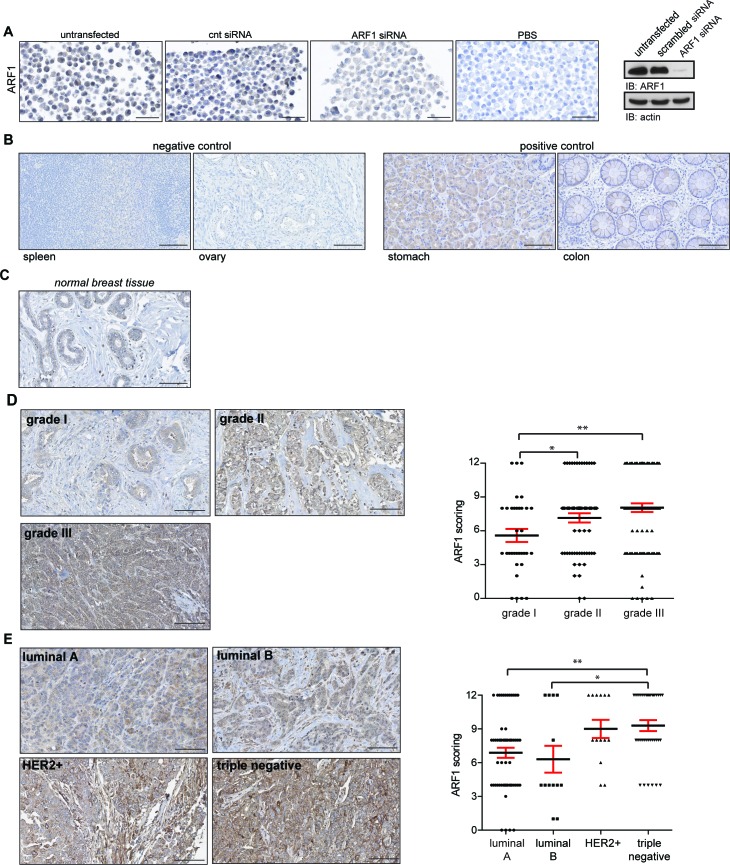
Figure 1. ARF1 expression correlates with molecular subtypes of breast cancer and is associated with tumor grade.
A. MDA-MB-231 cells were transfected or not with (cnt; scrambled) or ARF1 siRNA. Each pellet of cells was incubated in the presence or the absence of the anti-ARF1 antibody. Scale bar, 50 μm. Endogenous level of ARF1 and actin were analyzed by Western blot (right panel). B. Representative IHC labeling with ARF1 in normal human tissue. Spleen and ovary were chosen as negative controls, while stomach and colon served as positive controls. Each sample was incubated with anti-ARF1 antibody as shown in A. Scale bar, 100 μm. C. Expression of ARF1 in normal breast tissues. Samples correspond to individual breast tissue from the same TMA and incubated with anti-ARF1 antibody. Scale bars, 100 μm. D. ARF1 expression in breast cancers tissue samples according to histological grades. Samples are from the same TMA described as in A. Scale bars, 100 μm. Graph showing ARF1 labeling intensity in breast cancer tissue samples according to histological grade. Grade I n = 34, II n = 64 and III n = 100, dataset including 198 patients. E. Expression of ARF1 in different molecular subtypes of breast cancer. Samples correspond to individual breast cancer tissue from the same TMA and incubated with anti-ARF1 antibody. Scale bars, 100 μm. Graph depicting ARF1 labeling intensity of breast cancer tissue samples according to molecular subtype. Luminal A n = 60, luminal B n = 13, HER2+ n n = 14 and triple-negative n = 37, dataset including 124 patients. In D and E, significance was measured by one-way ANOVA followed by Tukey's multiple comparison tests. * p < 0.05, ** p < 0.01.

