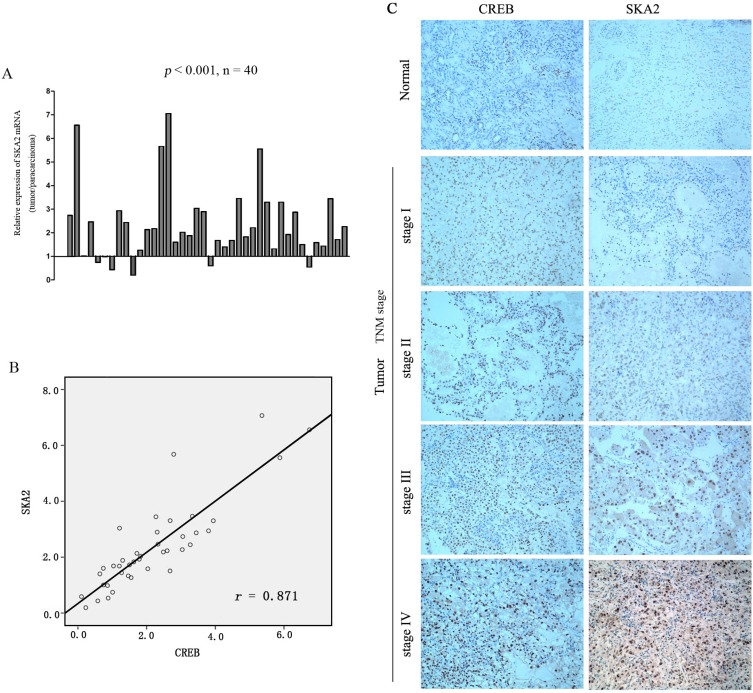
Figure 6. The correlation between SKA2 and CREB expression in RCC tissue sample.
The mRNA level of SKA2 was up-regulated in RCC cancers compared to their matched adjacent non-tumor tissues (A). Positive correlation between the mRNA levels of CREB and SKA2 in RCC cancers versus their matched non-tumor counterparts. A statistically significant correlation between CREB expression and SKA2 protein was observed by Pearson's correlation coefficient (B). Representative immunohistochemical staining of higher CREB is concomitant with higher SKA2 in tumor, but not in benign tissues, from the same patient, with increasing expression seen at higher TNM stages from I-IV (n = 166) (Figure C). Representative images were captured at a magnification of × 200.

