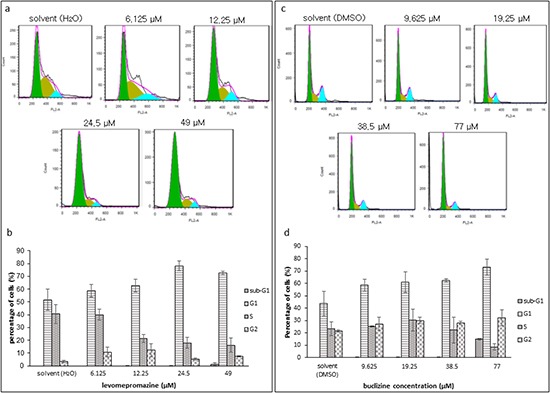
Figure 8. Cell cycle analysis of MCF-7 cells after treatment with levomepromazine (a and b) or buclizine (c and d) for 72 h.

The graphs are mean values and standard deviations of three independent experiments.

The graphs are mean values and standard deviations of three independent experiments.