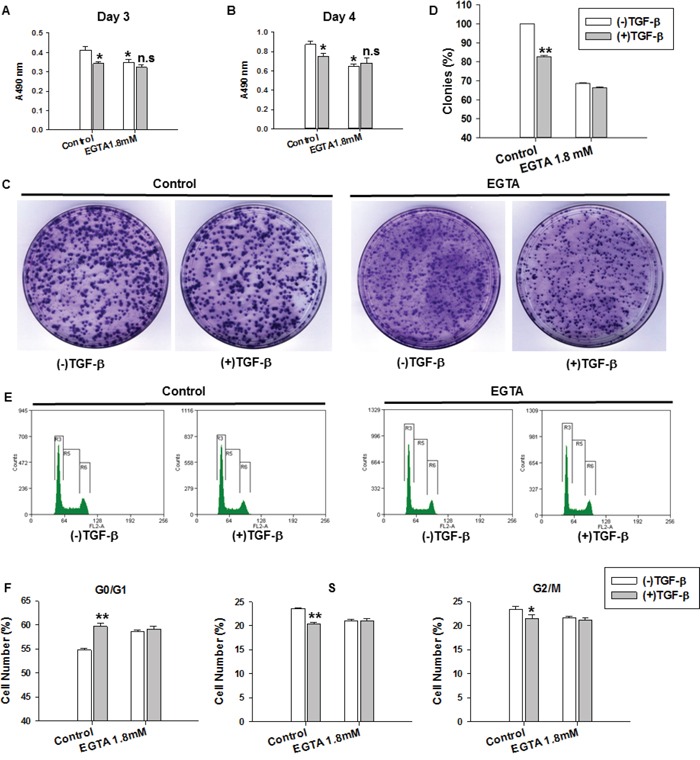
Figure 1. TGF-β-induced suppression of cell proliferation, cell colony formation and cell cycle arrest were impaired with EGTA treatment.

A-B. MDA-MB-231 cell proliferation was determined by MTT assay after various treatments for 3 and 4 days. Cell proliferation was expressed as the absorbance values. *P<0.05 VS. Control group without TGF-β treatment, n.s (not significant) VS. EGTA 1.8mM treatment group without TGF-β treatment. C. Colony formation assay in MDA-MB-231 cell with various treatments. D. The number of colonies was measured by the software Lane 1D. Numbers of colonies was quantified in 3 dishes from each treatment group. Results are the means ± SE from 3 independent experiments plotted as percent (%) colonies relative to control group. E. Cell cycle distribution was detected by flow cytometry in MDA-MB-231 cells with various treatments for 3 days. F. The statistical analysis of cell cycle distribution in G0/G1, S and G2/M phases. TGF-β and EGTA induced G0/G1 arrest. TGF-β-induced cell cycle arrest was impaired by EGTA (1.8 mM). Data represent the means ± SE of three independent experiments. *P < 0.05, **P < 0.01 compared with control group.
