
Figure 1. A heat map or chromaticity diagram for the F values of the 400 1-gap dipeptides.
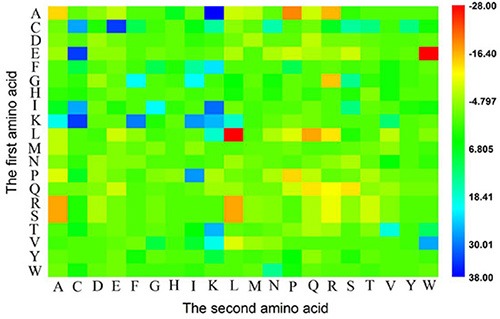
The blue boxes indicate that the features are enriched in anticancer peptide, while the red boxes indicate that the features are enriched in non-anticancer peptide. See the text for more explanation.