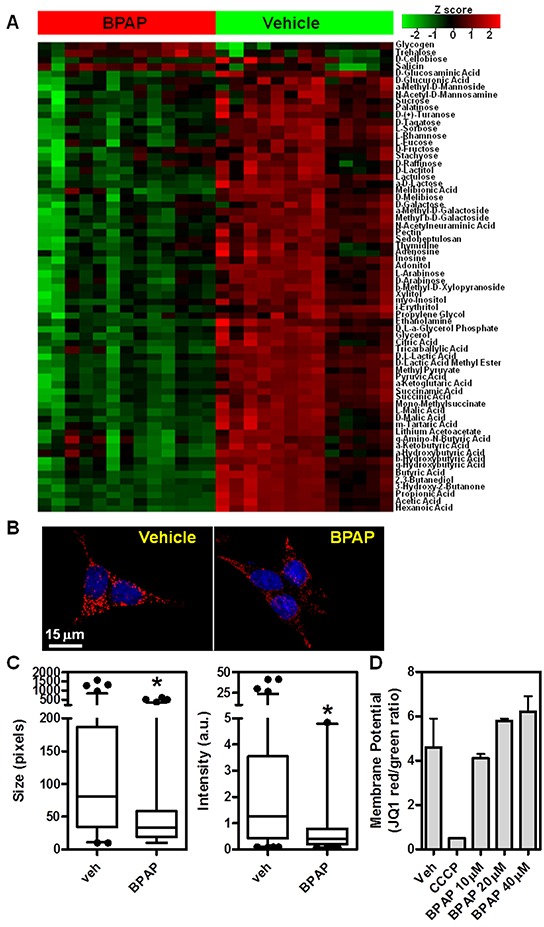
Figure 7. BPAP causes changes in cell metabolism and mitochondria.

A. Metabolomics Phenotype Arrays (sugar sources) were performed in 22Rv1 cells after treatment with vehicle or BPAP 20μM for 24h. Heatmap represents differential carbon source usage between treatments as represented by Z-score, each column represents biological replicates. B–C. BPAP reduces mitochondria size and intensity of signal after 24 hr of treatment in 22Rv1 cells. Images were taken with 100x objective on a DeltaVision deconvolution microscope. Size and intensity of mitochondria were measured via automated image analysis routines. D. 22Rv1 were treated with BPAP 10–40μM for 24hrs and then stained with JC-1 to measure mitochondrial potential. Graph shows red/green ratio that represents mitochondria functionality. 50μM CCCP was used as positive control.
