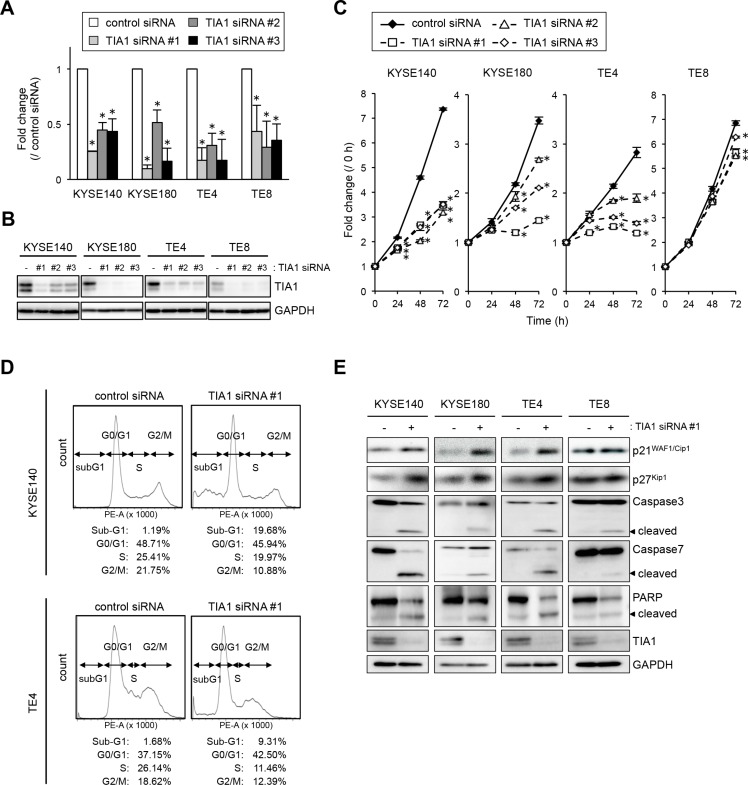
Figure 3. Effects of TIA1 knockdown on cell proliferation.
(A) KYSE140, KYSE180, TE4 or TE8 cells were transfected with each 10 nM TIA1-specific or control siRNA for 48 h, and the TIA1 mRNA expression levels were evaluated by qPCR using GAPDH mRNA as an endogenous control. The values are expressed as fold changes (mean ± SD, n = 3) compared with the respective values in control siRNA-transfected cells. *significantly different from the control value by Student's t test (P < 0.05). (B) Effectiveness of siRNA transfection. KYSE140, KYSE180, TE4 or TE8 cells were treated as described in (A), and the expression levels of TIA1 protein were evaluated by western blot analysis using GAPDH as a loading control. (C) KYSE140, KYSE180, TE4 or TE8 cells were transfected with each 10 nM TIA1-specific or control siRNA for 24 h, and cellular proliferation was measured using a WST assay at the indicated times. The values are expressed as fold changes (mean ± SD, n = 4) compared with the respective values in control cells (0 h). *significantly different from the control value by Student's t test (P < 0.05). (D) Representative results of cell cycle analysis. After KYSE140 or TE4 cells were treated with 10 nM TIA1-specific or control siRNA for 48 h, then the cells were stained with PI and subjected to FACS analysis. Raw data were quantified for cell cycle analysis by FACSVerse software. (E) KYSE140, KYSE180, TE4 and TE8 cells were transfected with 10 nM TIA1-specific or control (-) siRNA for 48 h. Levels of caspase-3, caspase-7, PARP, p21WAF1/Cip1, p27Kip1 and TIA1 proteins were measured by western blot analysis using GAPDH as a loading control.

