Significance
Elongation factor G (EF-G) uses energy stored in GTP to catalyze movement of transfer RNAs and messenger RNA in the ribosome during the translocation step of prokaryotic protein synthesis. Using single-molecule polarized fluorescence microscopy, three-dimensional rotational motions of individual domains of EF-G were directly captured, for the first time to our knowledge, during normal translocation. Our observations strongly imply a hybrid model, in which the initial steps of translocation are ribosome unlocking driven by a force generated via EF-G–dependent GTP hydrolysis, and further steps of translocation are mainly driven by the energetics of the ribosome itself. These results demonstrate that the ribosome and EF-G make use of power-stroke and Brownian-ratchet mechanisms to ensure efficiency and accuracy of translocation.
Keywords: polarized TIRF, ribosome, rotational motion, translocation, energy landscape
Abstract
During the translocation step of prokaryotic protein synthesis, elongation factor G (EF-G), a guanosine triphosphatase (GTPase), binds to the ribosomal PRE-translocation (PRE) complex and facilitates movement of transfer RNAs (tRNAs) and messenger RNA (mRNA) by one codon. Energy liberated by EF-G’s GTPase activity is necessary for EF-G to catalyze rapid and precise translocation. Whether this energy is used mainly to drive movements of the tRNAs and mRNA or to foster EF-G dissociation from the ribosome after translocation has been a long-lasting debate. Free EF-G, not bound to the ribosome, adopts quite different structures in its GTP and GDP forms. Structures of EF-G on the ribosome have been visualized at various intermediate steps along the translocation pathway, using antibiotics and nonhydolyzable GTP analogs to block translocation and to prolong the dwell time of EF-G on the ribosome. However, the structural dynamics of EF-G bound to the ribosome have not yet been described during normal, uninhibited translocation. Here, we report the rotational motions of EF-G domains during normal translocation detected by single-molecule polarized total internal reflection fluorescence (polTIRF) microscopy. Our study shows that EF-G has a small (∼10°) global rotational motion relative to the ribosome after GTP hydrolysis that exerts a force to unlock the ribosome. This is followed by a larger rotation within domain III of EF-G before its dissociation from the ribosome.
Coupled translocation of transfer RNA (tRNA) and messenger RNA (mRNA) within the ribosome, catalyzed by the guanosine triphosphatase (GTPase) elongation factor G (EF-G), is one of the major steps in the elongation cycle of protein synthesis, allowing the next codon to enter into the ribosomal A site, in preparation for the next decoding step. Upon binding to the PRE-translocation (PRE) ribosomal complex, EF-G rapidly hydrolyzes GTP. Translocation follows, and EF-G·GDP dissociates from the resulting POST-translocation complex (1). Recent studies (2–4) have clearly demonstrated that EF-G·GTP promotes translocation from either the classic or hybrid PRE complex, which contain tRNAs in the A/A and P/P or A/P and P/E sites, respectively (first letter 30S position, second letter 50S position).
EF-G has five domains (5, 6). Its structures in the GTP and GDP forms free of the ribosome indicate a significant hinge-like joint motion of the C-terminal domains (III–V) with respect to N terminus (domains I and II) (7, 8). Structural and single-molecule studies have captured different EF-G structures and states on the ribosome (9–17), using antibiotics and/or nonhydrolyzable GTP analogs to prevent rapid translocation and increase the lifetime of ribosome-bound EF-G. These studies have provided valuable insights into how EF-G interacts with the ribosome. However, studies of the EF-G:ribosome complexes obtained in these conditions do not necessarily capture all of the relevant intermediates and may sometimes represent off-pathway or rarely visited states. Rapid reaction kinetics studies have examined the structural changes of the ribosome and tRNAs during normal translocation (4, 18–21), whereas the corresponding kinetic and structural information for EF-G is mostly unknown. Moreover, none of these earlier studies have described the kinetics of conformational changes of ribosome-bound EF-G during normal, rapid translocation.
Here we address this gap by comparing rotational motions that individual EF-G subdomains, labeled with an appropriate fluorescent probe, undergo on the ribosome during both normal and antibiotic-inhibited translocation or with an empty ribosomal A site. We detect these motions with millisecond time resolution, using single-molecule polarized total internal reflection fluorescence (polTIRF) microscopy (22, 23). By monitoring the emission polarization of single fluorescent probes under different polarizations of the excitation light, polTIRF determines the kinetics of change in the 3D angular orientation of the labeled subdomains and the microsecond rotational fluctuations (the “wobble”) of the protein relative to the ribosome. We previously used polTIRF to determine how molecular motor proteins translocate along the cytoskeletal actin filaments in vitro (22, 23). This is to our knowledge the first study to extend this single-molecule tool beyond cytoskeletal motors. Details of the polTIRF principle and instrumentation are described in Supporting Information and ref. 22. Our results suggest that EF-G serves as a force-generating motor via a power stroke in the early steps of translocation, supporting the proposal that energy released from GTP hydrolysis triggers EF-G conformational changes to promote translocation (24). The sequential motions of EF-G that follow the first stroke and complete translocation may follow either a power-stroke or a Brownian ratchet mechanism, the latter driven by stochastic thermal fluctuations.
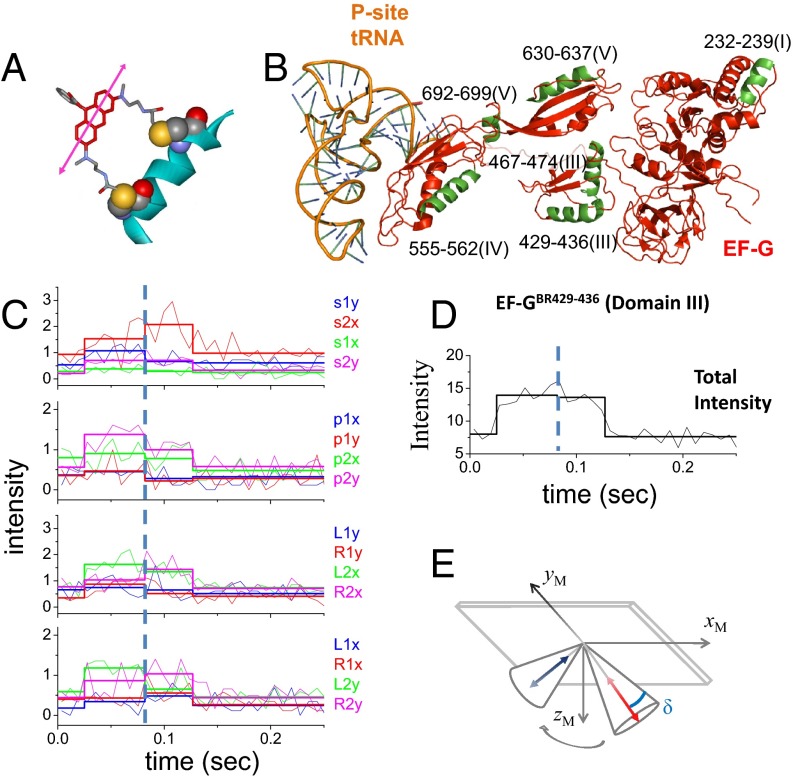
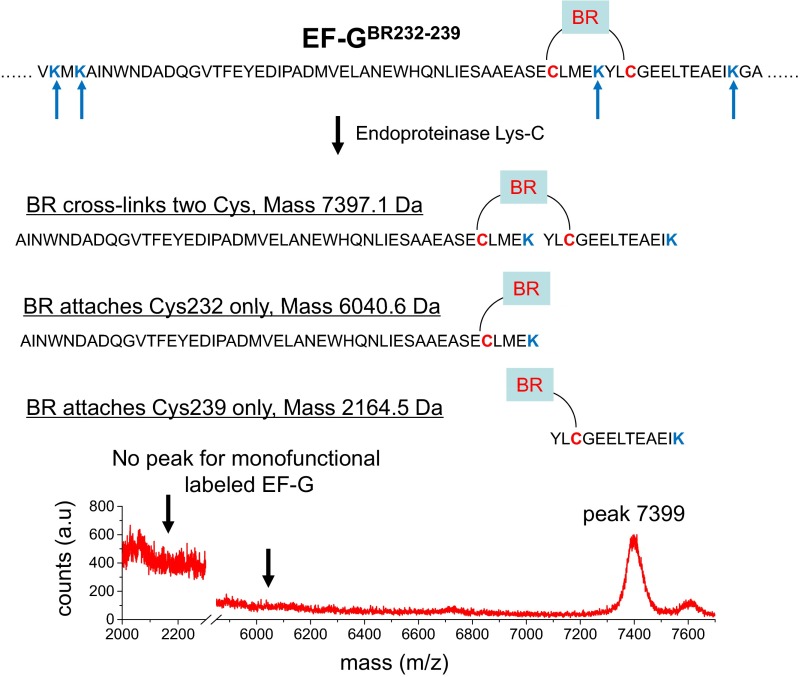
We labeled EF-G using bifunctional rhodamine (BR), a fluorescent probe that cross-links two engineered cysteine (Cys) residues located seven residues apart in an α-helix (Fig. 1A). Rotation of BR relative to the protein is highly restricted, as documented by the polTIRF signals, and thus rotations of the labeled sites can be inferred from the probe angle changes. We prepared several EF-G mutants, labeled them with BR, and demonstrated that BR cross-links the two engineered Cys residues, using site-specific cleavage and mass spectrometry (Fig. S1). After testing their activities in translocation (Table S1), we selected the following BR-labeled EF-Gs for further polTIRF experiments: EF-GBR232-239 (BR cross-linking cysteines in the EF-G sequence at positions 232 and 239, domain I), EF-GBR429-436 (domain III), EF-GBR467-474 (domain III), EF-GBR555-562 (domain IV), EF-GBR630-637 (domain V), and EF-GBR692-699 (formally domain V, but actually in between IV and V) (Fig. 1B).
Fig. 1.
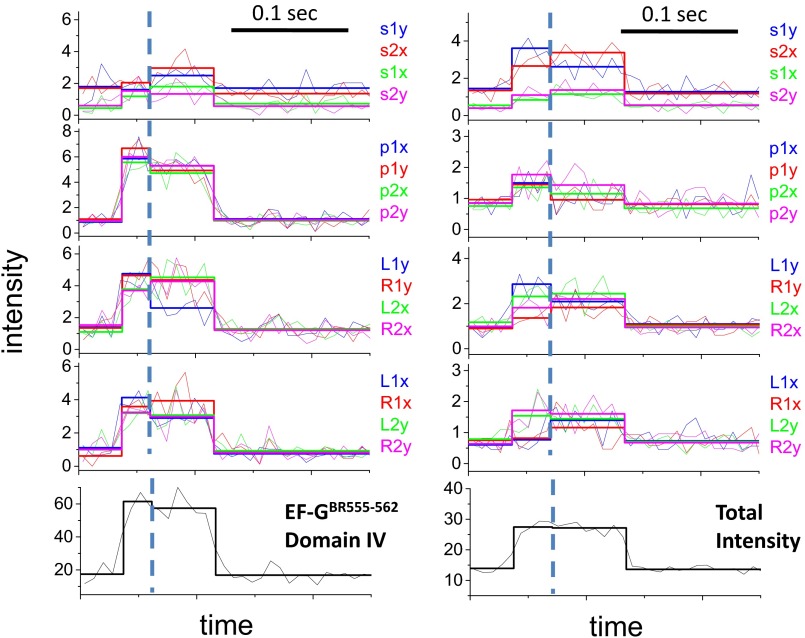
Structures of BR and EF-G and polTIRF recordings of a single EF-GBR binding event. (A and B) Structures of (A) BR and (B) EF-G. BR is shown cross-linking two Cys side chains on an α-helix. The α-helices of EF-G labeled with BR are marked in green. (C and D) Sixteen PFIs (C) and the sum of all PFIs (D) of a single EF-GBR binding event during translocation. Intensities are plotted as photon counts per ms averaged every 8 ms. (E) Three-dimensional orientations, rotational motion, and wobble (δ) of BR-labeled EF-G reconstructed from PFIs of this binding event. In C, the labels, such as s1x, s2x, and s1y, represent 16 combinations of excitation path (1 in the x–z plane, 2 in the y–z plane), excitation polarization (s, perpendicular to and p, parallel to the plane containing the incident and reflected beams; and L, 45° to the left of p and R, 45° to the right of p), and emission polarization (x or y), which were collected and plotted as PFIs. The binding of EF-GBR to the immobilized ribosome at time 0.02 s and the dissociation of BR-EF-G at time 0.12 s are determined by sudden increase and decease of the total intensity, respectively. The rotational motion of EF-GBR is clearly indicated by changes of many individual PFIs at time 0.08 s, whereas the total intensity remains almost constant. Three-dimensional orientations of the probe dipole before and after rotational motions were resolved from 16 PFIs and plotted as red and blue arrows in E, respectively. Wobble (δ) of the probe on the microsecond scale, reconstructed from PFIs, was plotted in E as a cone around the dipole.
Fig. S1.
Characterization of EF-GBR232-239. EF-GBR232-239 was digested by endoproteinase Lys-C. Digested peptide fragments were separated by analytical HPLC (reverse-phase C18). The fluorescent fragments were collected and analyzed by electrospray time-of-flight mass spectrometry, which confirmed that BR cross-links the two engineered Cys residues (54). As indicated, the expected fragment for the fragment containing the BR cross-link between the two Cys residues, mass 7,397.1 Da, is present in the mass spectrum, whereas no mass corresponding to either of the two fragments expected for monofunctional labeling was observed.
Table S1.
Translocation activities of EF-GBRs
| Labeling sites and EF-G domains | Mutation sites | Labeling | Relative translocation activity compared with WT-EF-G* |
| 232-239/I | E232C, G239C | BR labeled | 1.03 ± 0.03 |
| 429-436/III | E429C, G436C | BR labeled | 1.04 ± 0.05 |
| 467-474/III | D467C, K474 | Unlabeled | 1.01 ± 0.07 |
| BR labeled | 0.92 ± 0.09 | ||
| 555-562/IV | K555C, K562C | Unlabeled | 0.81 ± 0.03 |
| BR labeled | 0.83 ± 0.10 | ||
| 599-606/IV | I599C, K606C | Unlabeled | 1.00 ± 0.05 |
| BR labeled† | 0.92 ± 0.02 | ||
| 629-636/V | G629C, S636C | Unlabeled | 0.55 ± 0.05 |
| BR labeled | 0.21 ± 0.02 | ||
| 630-637/V | D630C, R637C | Unlabeled | 0.87 ± 0.06 |
| BR labeled | 0.91 ± 0.04 | ||
| 668-675/V | G629C, S636C | Unlabeled | 0.61 ± 0.10 |
| 692-699/V | S692C, I699C | Unlabeled | 0.74 ± 0.06 |
| BR labeled | 0.73 ± 0.10 |
All Cys residues were introduced into the Cys-less triple variant C114D/C266A/C397S of EF-G (56).
Relative translocation activity was measured by the disappearance of high FRET intensity between Cy5-labeled L11 and Cy3-labeled A-site tRNA in a PRE-translocation complex after incubation with 100 nM of the various EF-G constructs for 5 min. Active EF-G promotes translocation from PRE-translocation to POST-translocation complex, which leads to a larger distance between L11 and tRNA and thereby lowers the FRET efficiency.
The mass spectrometry assay indicated that BR-labeled EF-G(599-606) contains monofunctional labeled product, in which BR is attached to EF-G through only one Cys residue. Therefore, it was not used for further polTIRF experiments.
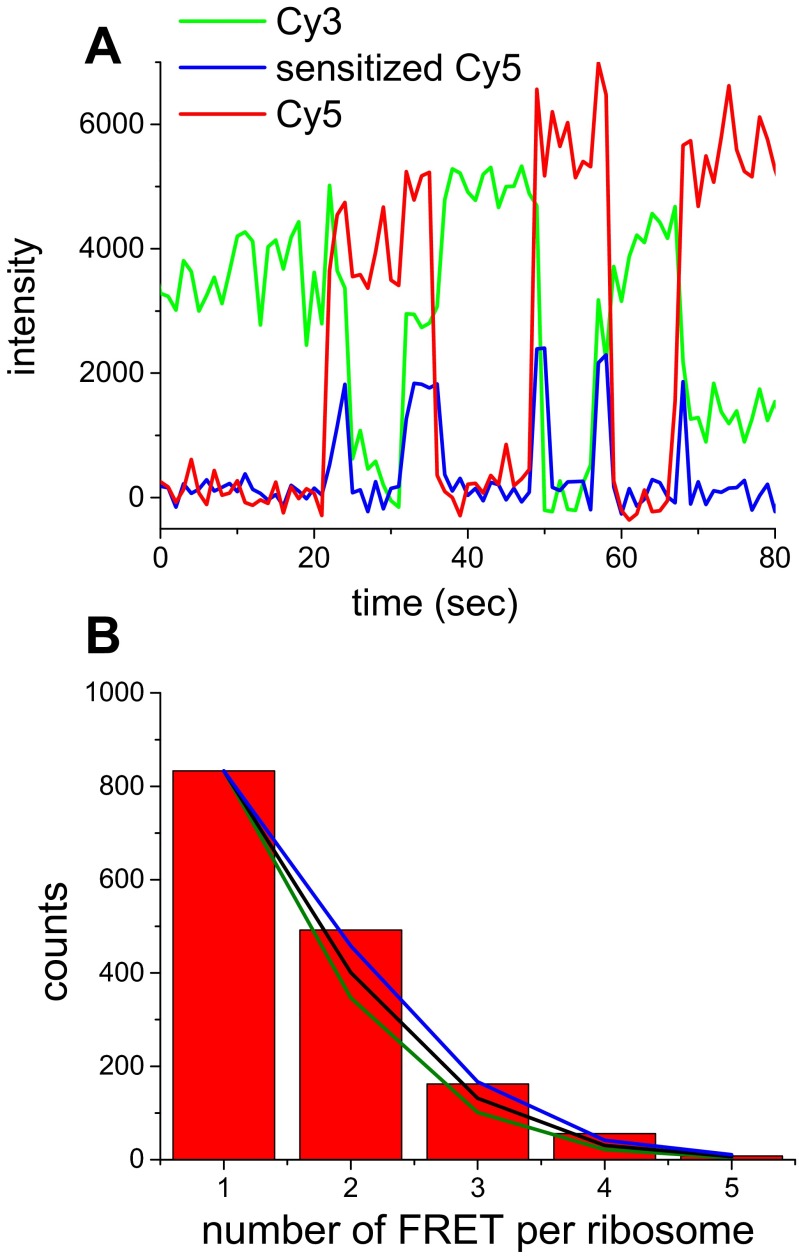
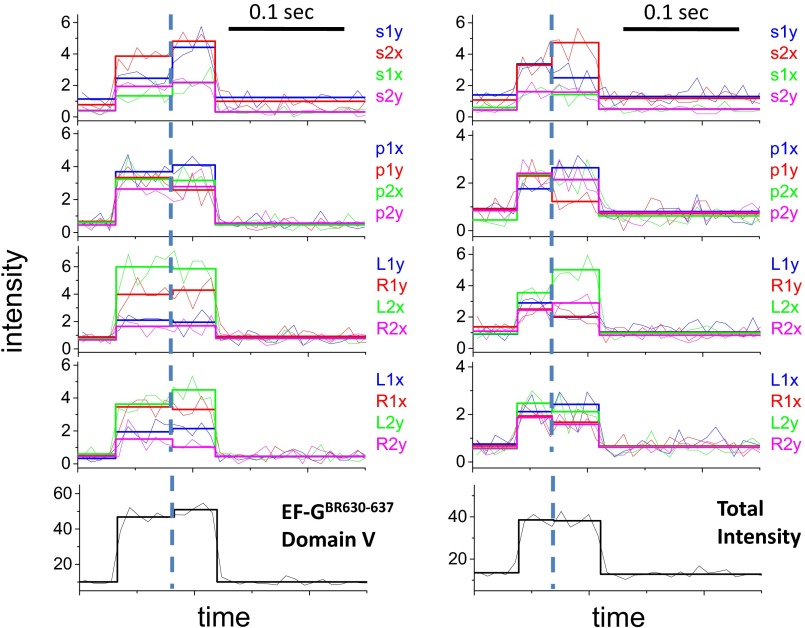
In polTIRF experiments, the ribosome was attached to a microscope slide through both the 3′ and 5′ ends of an mRNA to constrain its rotational mobility (Fig. S2A). A 40-nt length mRNA and 2-kDa PEG linkers provided an optimized attachment that immobilized the ribosomes with the least rotational mobility (Fig. S2B). Ribosomes immobilized under these conditions successfully completed approximately six elongation cycles (Fig. S3), as detected by single-molecule fluorescence resonance energy transfer (FRET) patterns using Cy3- and Cy5-labeled tRNAs (25). PolTIRF recordings, including 16 different simultaneous polarized fluorescence intensities (PFIs) as shown in Fig. 1C, began after injecting BR-labeled EF-G (EF-GBR) and other necessary components into the flow chamber to start multiple elongation cycles. When an EF-GBR transiently bound to an immobilized ribosome, a pulse of fluorescence was detected (Fig. 1 C and D). During this binding event, simultaneous discrete changes of the individual PFIs signaled a sudden rotation of the EF-GBR, whereas the total intensity remained almost constant (Fig. 1 C–E). A maximum-likelihood, multitrace change-point algorithm identifies statistically valid change points caused by sudden rotations and localizes their timing within several milliseconds (26). For each instance of EF-GBR binding to the ribosome, the orientation and extent of wobble of EF-GBR before and after any structural changes were determined from the PFIs (details in Supporting Information).
Fig. S2.
(A) Schematic representation of the immobilization linkage of the ribosome. (B) Flexibility of the ribosome characterized by microsecond wobble angles of BR under various attachment conditions. The values 80-nt, 65-nt, and 40-nt are the numbers of bases in the doubly biotinylated mRNA. The values 5k, 2k, and 0.5k are molecular weights of biotin-PEG. (C) At the shortest linker length (40 nt, 0.5 kDa PEG), the wobble was higher than at 2 kDa PEG, presumably because the linkers were too short for both ends to reliably form continuous linker chains to the substrate. We thus used the 40-nt mRNA and 2 kDa PEG for the remaining studies reported herein, limiting aggregate wobble of the ribosome, EF-G, and local attachment helix to less than ∼45°.
Fig. S3.
Single-molecule FRET experiments indicate that most of doubly tethered ribosomes can complete about six elongation cycles using the 40-nt doubly biotinylated mRNA coded for MFVFVFV. (A) A single-molecule FRET trajectory shows alternative Cy3-F (green curve) and Cy5-V (red curve) binding and five FRET events (pulses of sensitized emission, blue curve) between simultaneously bound tRNAs. The ribosome completes six elongation cycles before the end of the mRNA. (B) Distribution of FRET events per ribosome. The decreasing number of the ribosome showing multiple FRET events is caused by imperfect labeling efficiency of tRNAs. In our previous studies, we estimated that the effective labeling efficiency of tRNAs is 40–50%. Estimates of the distribution of FRET events per ribosome are shown in green, black, and blue curves, corresponding to 40%, 45%, and 50% effective labeling efficiencies, respectively, assuming that the ribosomes can complete six elongation cycles. The estimated curves agree with experimental measurement quite well, indicating that most of the ribosomes can complete six elongation cycles. Each polTIRF binding event containing rotational motions corresponds to a translocation step in one of these cycles.
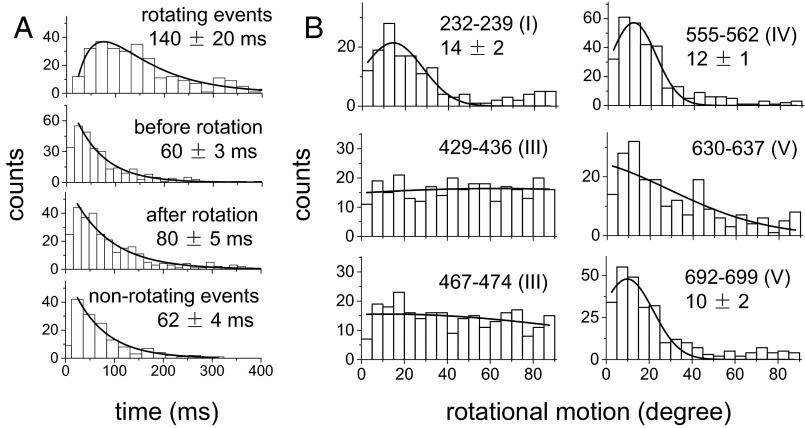
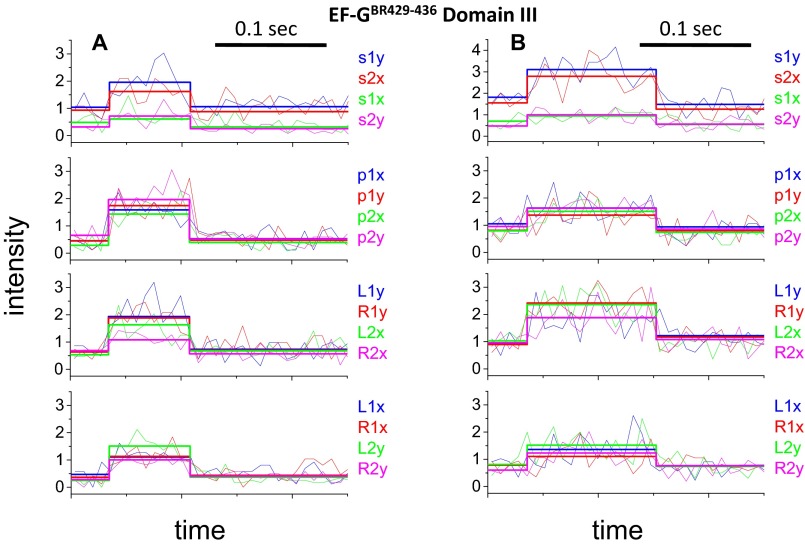
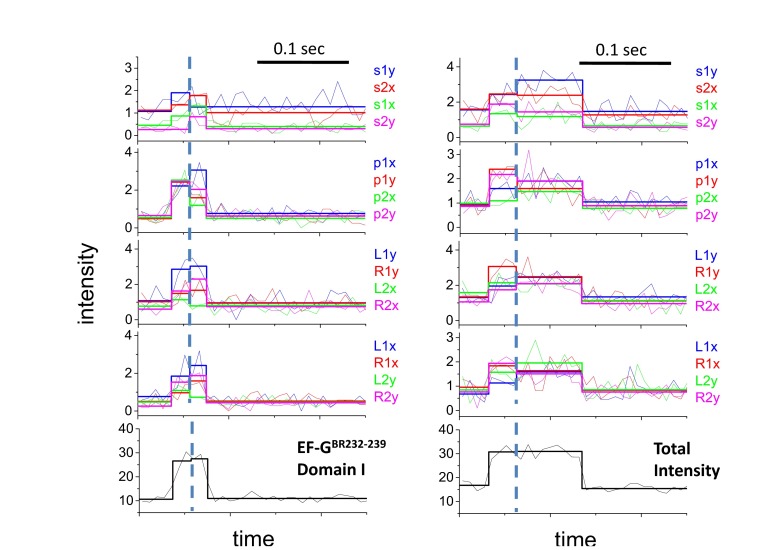
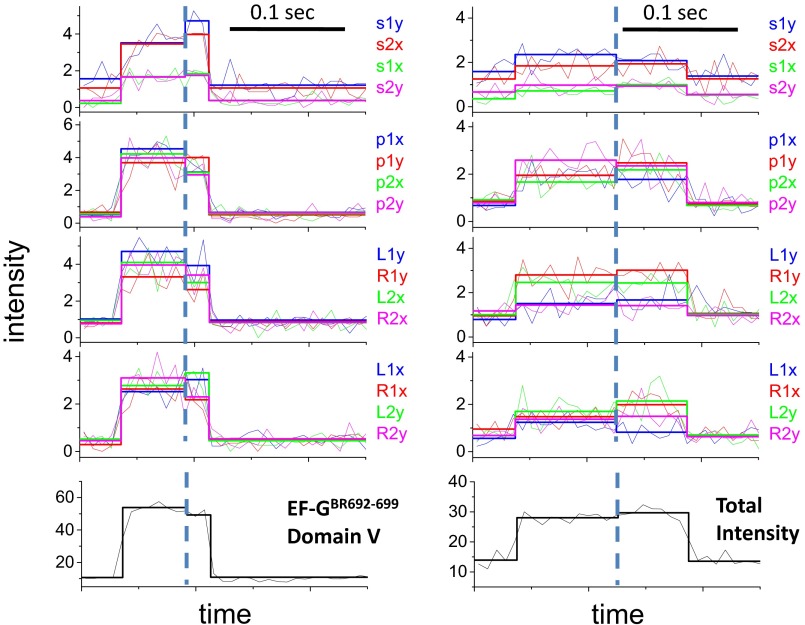
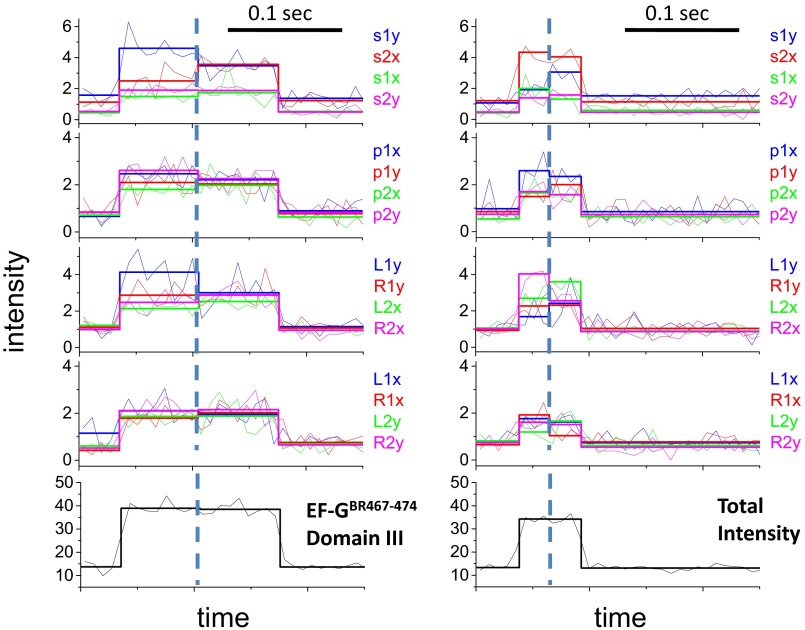
For all of the EF-GBR constructs tested, the observed fluorescence pulses under normal elongation conditions indicated two types of binding events. About half of the events had short dwell times of occupancy on the ribosome (42–71 ms; Fig. 2A, Fig. S4, and Table S2) and no detectable rotations. These events were assigned to sampling of the ribosome by EF-G and dissociation, without completion of translocation. The other half of the events showed rotational motions and had longer dwell times (130–183 ms; Fig. 2A and Table S2 and sample traces in Fig. 1 C and D and Figs. S5–S9). These were considered to be successful translocation events. The assignments and durations of these two different types of binding events agree very well with a recent study using Cy5-labeled EF-G (4), in which EF-G binding events without ribosomal 30S–50S subunit rotations were considered to be sampling events and EF-G binding events that were correlated with subunit counter-rotations were considered to be translocations. For these events, all of the EF-GBRs exhibited similar dwell times on the ribosome before and after the rotational change points (60–80 ms and 72–104 ms, respectively, at 18 °C; Table S2).
Fig. 2.
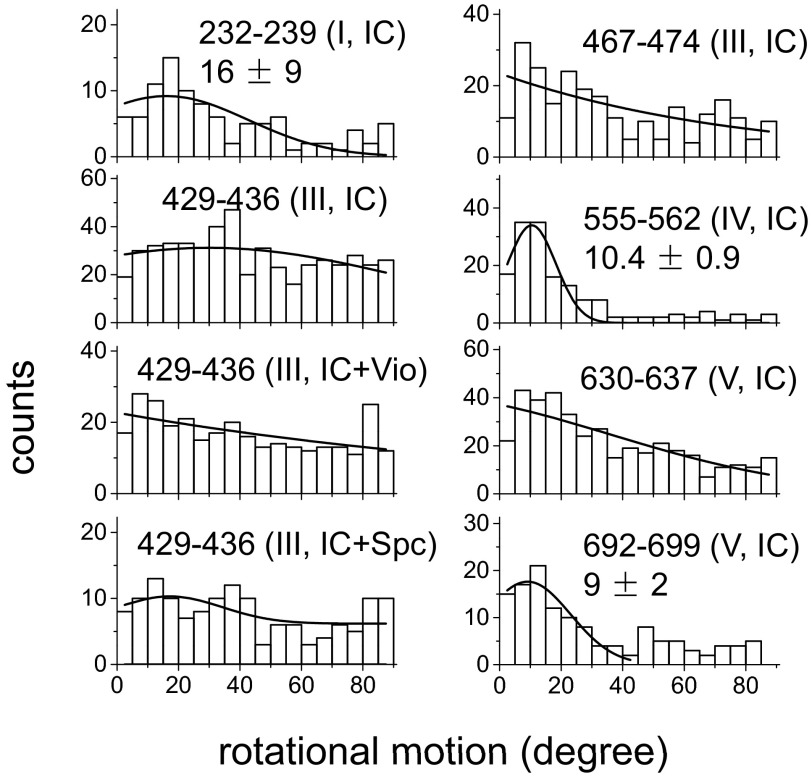
Distributions of dwell times and rotational motions of EF-GBR. (A) The dwell time distributions of EF-GBR429-436 binding events under conditions of normal translocation. Events are separated into rotating and nonrotating events. For events exhibiting a rotation, distributions of dwell times before and after rotation are also plotted. (B) Distributions of rotational motions of EF-GBR during translocation, defined as the total change in the probe dipole angle before and after the structural change. Solid curves are fitted Gaussian distributions with peak values and uncertainty (SEM).
Fig. S4.
Two EF-GBR429-436 binding events during translocation without a detectable rotational motion. The noisy traces are the 16 polarized fluorescence intensities binned at 8-ms intervals.
Table S2.
Dwell times of EF-GBR on the ribosome during translocation
| Dwell time, ms | |||||||
| Rotating events | |||||||
| Labeling domain | Labeling site | No. events | % events with rotations | Nonrotating events | Total | Before rotation | After rotation |
| I | 232-239 | 327 | 46.2 | 71 ± 6 | 160 ± 30 | 62 ± 5 | 95 ± 8 |
| III | 429-436 | 437 | 65.9 | 63 ± 4 | 140 ± 20 | 60 ± 3 | 80 ± 5 |
| III | 467-474 | 522 | 49.4 | 42 ± 1 | 152 ± 5 | 60 ± 3 | 92 ± 6 |
| IV | 555-562 | 567 | 52.9 | 53 ± 2 | 165 ± 11 | 74 ± 5 | 87 ± 6 |
| V | 630-637 | 394 | 53.0 | 53 ± 5 | 183 ± 13 | 80 ± 3 | 104 ± 10 |
| V | 692-699 | 470 | 58.7 | 46 ± 4 | 130 ± 12 | 63 ± 3 | 72 ± 6 |
Fig. S5.
EF-GBR232-239 binding events during translocation with rotational motions detected by the change-point algorithm with 95% confidence indicated by a dashed line. Polarized fluorescence intensities are shown binned at 8 ms.
Fig. S9.
EF-GBR692-699 binding events during translocation with rotational motions detected by the change-point algorithm with 95% confidence indicated by a dashed line. Polarized fluorescence intensities are shown binned at 8 ms.
Fig. S6.
EF-GBR467-474 binding events during translocation with rotational motions detected by the change-point algorithm with 95% confidence indicated by a dashed line. Polarized fluorescence intensities are shown binned at 8 ms.
Fig. S7.
EF-GBR555-562 binding events during translocation with rotational motions detected by the change-point algorithm with 95% confidence indicated by a dashed line. Polarized fluorescence intensities are shown binned at 8 ms.
Fig. S8.
EF-GBR630-637 binding events during translocation with rotational motions detected by the change-point algorithm with 95% confidence indicated by a dashed line. Polarized fluorescence intensities are shown binned at 8 ms.
Rotational motions of individual EF-GBR binding events were quantified by the orientation of the BR probe before and after motions. All EF-GBRs exhibited similar microsecond wobble amplitudes, demonstrating that the probe dipoles follow the labeled helix quite faithfully and that none of the labeled helices were highly mobile relative to the rest of their domains.
Histograms of the angle change captured using EF-GBR232-239, EF-GBR555-562, and EF-GBR692-699 (Fig. 2B) all had well-defined peaks around 10° (total subtended angle change). Rotational motions of EF-GBR630-637 also showed a peak around 10°, but with a broader distribution. Such small reorientations of the entire EF-G molecule are consistent with the several positions detected in structural studies of EF-G trapped on the ribosome in various intermediate translocation states (8, 11–15, 27–30). On the other hand, EF-GBR429-436 and EF-GBR467-474, both labeled in domain III, consistently showed very large and variable rotational motions, whose angular changes were evenly distributed from 0° to 90° without a clear peak (Fig. 2B). That both EF-GBR429-436 and EF-GBR467-474 exhibited the same behavior, although their fluorescent probes were located on two different α-helices nearly perpendicular to each other, indicates that the motions we detected are not artifacts caused by fluorophore labeling or changes of secondary structure. We speculate that the wide distribution of the domain III rotational angles results from flexibility of domain III in the EF-G∙GDP form (6) that might give rise to multiple parallel translocation and/or dissociation pathways. Strikingly, EF-GBR555-562 (domain IV), EF-GBR630-637 (domain V), and EF-GBR692-699 (domain V) all showed much smaller angle changes than domain III (Fig. 2). If domains IV and V accompany or follow tRNA motions during final translocation, their lack of large rotation indicates they are not tightly coupled to domain III.
We also detected two conformational states of ribosome-bound EF-G having similar dwell times (60 ± 7 ms and 52 ± 5 ms; Fig. S10), using single-molecule FRET between EF-GBR467-474 and Cy5-labeled ribosomal protein L11 on the large subunit. The change of FRET efficiency observed is caused by change in distance between EF-GBR467-474 and L11 during translocation (12, 15). Similar dwell times measured from polTIRF and FRET experiments indicate that they both capture the same transition dynamics during translocation. Together, the polTIRF and FRET results suggest that EF-G has a small, initial global reorientation and that its domain III, which includes residues 429-436 and 467-474, has a large and variable local motion, in concert with smaller motions of the other domains. As the linker between the C-terminal and N-terminal regions, domain III functions as a joint during EF-G’s hinge-like motion (7), so that its large rotational motions during translocation are consistent with the expected large translation of domain IV as it escorts or follows peptidyl-tRNA from the A site to the P site.
Fig. S10.
Kinetics of EF-G on the ribosome measured by single-molecule FRET between EF-GBR467-474 and L11 labeled with Cy5 at residue 87 at 21 °C. (A) Total dwell time of EF-G on the ribosome averages 105 ± 1 ms from the single exponential decay. (B) Transition density plot of the initial FRET value after EF-G binds vs. the final FRET value before EF-G dissociates. The final FRET efficiency is 0.03 ± 0.01 higher than the initial FRET, which indicates a small decrease in distance when EF-G tilts on the ribosome. Crystal structures of the ribosome–EF-G complexes (Protein Data Bank IDs 4W29 and 4V9k represent early and late translocation intermediates, respectively) (12, 15) show a small distance decrease (∼0.06 nm) between EF-G and the L11 labeling site during translocation, which corresponds to an ∼0.015 increase in FRET efficiency. Our smFRET observation is in line with the prediction from these structures, which indicates that the FRET increase we captured is attributable to translocation. (C) Postsynchronization analysis (62) was used to extract kinetic information from the recordings at relatively low signal-to-noise ratio. The black points are the average of all FRET traces aligned at the moment of EF-G binding, which gives the lifetime of the state before EF-G’s conformational change (60 ± 7 ms). The red points are the average of all FRET traces aligned at the last time point before EF-G dissociates, which gives the lifetime of the state after EF-G’s conformational change (52 ± 5 ms). These times are somewhat shorter than those determined in the polTIRF experiments, which is attributable to the higher temperature (21 °C vs. 18 °C) at which they were performed.
Interestingly, EF-GBR exhibits conformational changes on the ribosome even when it binds in the absence of an A-site tRNA. Binding of EF-G to initiation complexes (ICs) with empty A sites has been shown before (16, 31). Dwell times of EF-GBR binding to ICs containing a P-site initiator fMet-tRNAfMet and an empty A site decreased by 50–70% for both rotating and nonrotating events and the proportion of events showing angle changes decreased about 20% (Table S3). For events with tilting, EF-G dwell times were 50–75% shorter on ribosomes containing empty A sites both before and after the rotational motion. These results indicate that the presence of an A-site tRNA adds a relatively small increment (0.7–1.4 kBT) to the transition energy barrier for the internal conformational change and for dissociation of EF-G. The distributions of rotation angles for EF-GBR domains on ICs with an empty A site were quite similar to those observed during translocation (with the sole exception of EF-GBR467-474; Fig. S11).
Table S3.
Dwell times of EF-GBR on the ribosome under various conditions
| Dwell time, ms | |||||||
| Rotating events | |||||||
| Labeling site | Experimental condition | No. events | % rotational events | Nonrotating events | Total | Before rotation | After rotation |
| 429-436 | Translocation | 437 | 65.9 | 63 ± 4 | 137 ± 21 | 60 ± 3 | 80 ± 5 |
| + Vio | 770 | 48.4 | 79 ± 4 | 191 ± 22 | 94 ± 7 | 96 ± 5 | |
| + Spc | 585 | 64.6 | 69 ± 7 | 143 ± 10 | 75 ± 6 | 75 ± 4 | |
| IC | 1,080 | 46.9 | 30 ± 1 | 70 ± 2 | 35 ± 2 | 30 ± 2 | |
| IC, + Vio | 571 | 53.4 | 26 ± 2 | 81 ± 3 | 42 ± 2 | 31 ± 2 | |
| IC, + Spc | 276 | 51.5 | 25 ± 1 | 58 ± 4 | 42 ± 3 | 24 ± 2 | |
| 232-239 | Translocation | 327 | 46.2 | 71 ± 6 | 160 ± 30 | 62 ± 5 | 95 ± 8 |
| + Vio | 496 | 39.3 | 77 ± 4 | 164 ± 26 | 85 ± 6 | 88 ± 7 | |
| + Spc | 476 | 50.2 | 58 ± 2 | 179 ± 14 | 74 ± 4 | 95 ± 7 | |
| IC | 375 | 25.9 | 38 ± 6 | 64 ± 6 | 25 ± 4 | 27 ± 2 | |
| 467-474 | Translocation | 522 | 49.4 | 42 ± 1 | 152 ± 5 | 60 ± 3 | 92 ± 6 |
| + Vio | 599 | 41.2 | 60 ± 4 | 158 ± 9 | 88 ± 6 | 89 ± 6 | |
| + Spc | 592 | 46.6 | 40 ± 4 | 131 ± 8 | 64 ± 2 | 69 ± 4 | |
| IC | 619 | 39.7 | 26 ± 1 | 78 ± 3 | 33 ± 2 | 44 ± 2 | |
| 555-562 | Translocation | 567 | 52.9 | 53 ± 2 | 165 ± 11 | 74 ± 5 | 87 ± 6 |
| + Vio | 608 | 51.8 | 64 ± 4 | 134 ± 10 | 56 ± 4 | 66 ± 4 | |
| + Spc | 353 | 56.1 | 74 ± 7 | 178 ± 14 | 90 ± 7 | 86 ± 6 | |
| IC | 437 | 35.9 | 25 ± 1 | 40 ± 2 | 26 ± 2 | 21 ± 1 | |
| 630-637 | Translocation | 394 | 53.0 | 53 ± 5 | 183 ± 13 | 80 ± 3 | 104 ± 10 |
| + Vio | 282 | 51.8 | 49 ± 4 | 185 ± 19 | 111 ± 17 | 92 ± 8 | |
| + Spc | 416 | 61.5 | 52 ± 4 | 252 ± 17 | 84 ± 6 | 133 ± 8 | |
| IC | 790 | 49.6 | 31 ± 2 | 75 ± 6 | 38 ± 1 | 37 ± 1 | |
| 692-699 | Translocation | 470 | 58.7 | 46 ± 4 | 130 ± 12 | 62 ± 3 | 72 ± 6 |
| + Vio | 327 | 49.8 | 54 ± 3 | 150 ± 13 | 70 ± 5 | 80 ± 3 | |
| + Spc | 899 | 50.4 | 63 ± 3 | 174 ± 13 | 70 ± 3 | 94 ± 3 | |
| IC | 363 | 35.5 | 22 ± 1 | 59 ± 7 | 27 ± 2 | 25 ± 1 | |
IC stands for initiation complex containing fMet-tRNAfMet in the P site and an empty A site whose codon is UUC. A total of 5 μM Vio or 2 mM Spc was included where indicated.
Fig. S11.
Distribution of rotational angles of EF-GBR binding to the ribosomes (initiation complexes) containing only P-site initiator fMet-tRNAfMet. In some cases, 5 μM Vio or 2 mM Spc was added. Both A-site tRNA and one of the antibiotics must be present to block rotation of EF-G domain III.
The large and variable motions of the EF-G domain III we observe during normal translocation have not generally been detected among the X-ray and cryo-EM structures obtained using antibiotics and/or nonhydrolyzable GTP analogs that inhibit normal translocation and prolong the dwell time of EF-G on the ribosome. These blockers may rigidify the conformation of ribosome-bound EF-G. It is possible that time-resolved cryo-EM with single-particle sorting into different classes, by resolving structural heterogeneities in the sample, could reveal the motions of domain III detected by polTIRF. An exception to the structures lacking large motions within ribosome-bound EF-G is provided by a crystal structure in which the antibiotic dityromycin arrests the ribosome in a PRE-translocation structure (32). This structure shows domain III rotated about 90° from the position seen in isolated EF-G complexed with either GNPPNP or GDP, consistent with the large rotations of domain III that we observed. However, Lin et al. (32) assume that domains III–V rotate together as a rigid body, which is inconsistent with our polTIRF data showing domain IV rotates less than domain III. Molecular dynamic simulations (27) have revealed relative rotational motion between domains IV and III. Therefore, a model, in which domain III moves first to apply the force and then domain IV translates to complete translocation just before EF-G dissociates (see Fig. 4), would reconcile the structure presented by Lin et al. (32) and the rotational motions captured by us.
Fig. 4.
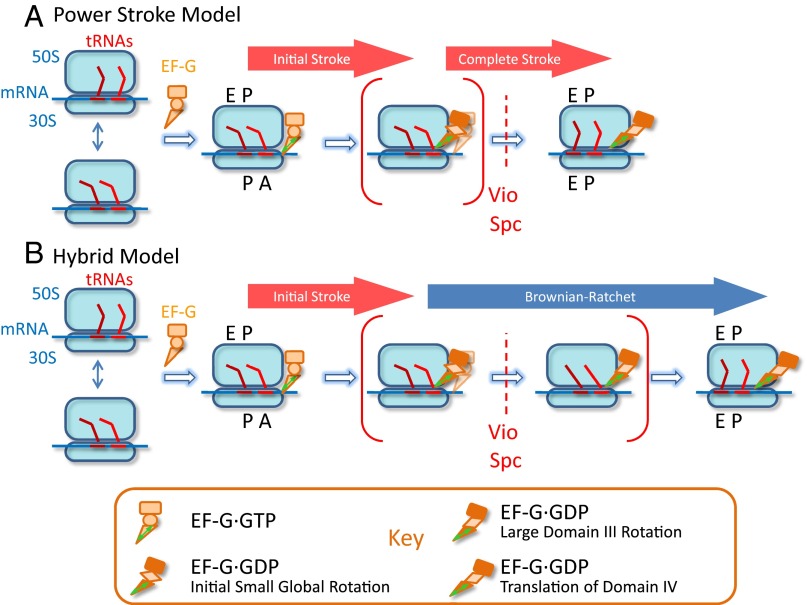
Two possible translocation models. The initial effect of EF-G after GTP hydrolysis is to apply a force to unlock the ribosome. After that first power stroke (A, Power Stroke Model), EF-G keeps actively pushing tRNAs and mRNA until translocation is completed, or (B, Hybrid Model) a series of sequential conformational changes of EF-G and the ribosome promote the final translocation of tRNAs and mRNA driven by thermal fluctuations and blocked reversal. Steps blocked by antibiotics are indicated. Brackets are used to mark short-lived intermediates during normal translocation, similar to states captured by time-resolved cryo-EM along the translocation pathway (9). In the hybrid model, these intermediates have similar free energies in the absence of EF-G; they can spontaneously interconvert until their thermally driven fluctuations are blocked by conformational changes within EF-G that complete translocation (2). Both of these models include a power stroke early in translocation. Final motions of domain IV (triangle) are indicated as a translation without rotation, consistent with the present data.
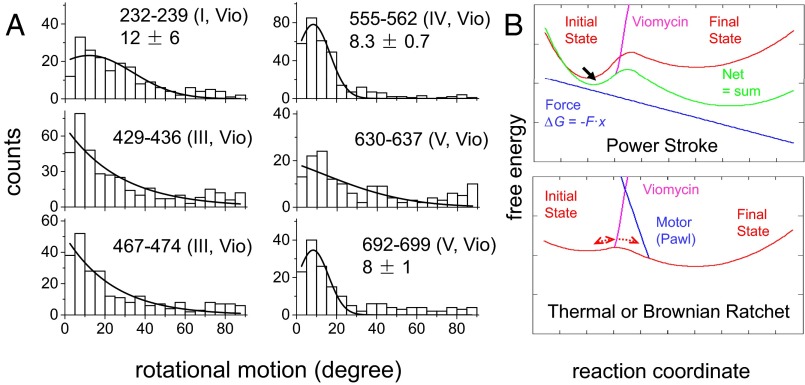
We next monitored the rotational dynamics of EF-GBRs in the presence of the antibiotics viomycin (Vio) (5 µM) and spectinomycin (Spc) (2 mM), which do not affect the rate of EF-G–dependent GTP hydrolysis (1, 33) but block translocation at subsequent steps along the pathway (19, 34, 35). Vio exhibits a bimodal behavior in its effects on ribosome dynamics (36). At the low concentration we use, Vio stabilizes tRNAs in the hybrid states and the ribosome in the rotated conformation and it halts translocation at an early stage (36–38). Spc disrupts translocation later in the process by blocking swiveling of the head domain of the small ribosomal subunit (39). Both Vio and Spc considerably reduced the extent of rotations in domain III (EF-GBR429-436 and EF-GBR467-474; Fig. 3A and Fig. S12) toward the amplitude of the global motion reported by the other domains. The average angle change of EF-GBR429-436 decreased from 46° ± 1° to 27° ± 1° and 37° ± 1° (SEM) in the presence of Vio and Spc, respectively.
Fig. 3.
Rotation and energy landscape of EF-GBR in the presence of Vio. (A) Distribution of rotational angles of EF-GBR with 5 μM of Vio. (B) Energy landscapes of translocation in the power-stroke (Upper) and Brownian-ratchet (Lower) models. The energy landscape of the ribosomal complex as the mRNA and tRNAs proceed from the PRE- to POST-translocation states in the absence of EF-G is represented by red lines in both models. In the power-stroke model, EF-G actively converts chemical energy stored in GTP to exert a force that promotes translocation of tRNAs and mRNA. The blue line represents the contribution to free energy of a force, which for simplicity is assumed to be constant, along the reaction coordinate. The green line, which is the sum of red and blue lines, represents the energy landscape in the presence of EF-G tilted toward the final state by EF-G–generated force. The black arrow indicates the change in the position of the energy minimum of the initial state due to the force generated by EF-G. In the Brownian-ratchet model, motions of tRNAs are spontaneous fluctuations and EF-G functions to block the reverse reaction, indicated by blue line labeled Motor (Pawl). The antibiotic Vio, which fixes tRNAs in the hybrid conformational state, helps us to distinguish between these two models. Vio blocks translocation by creating a large energy barrier between the initial and final states, indicated by magenta lines. This barrier would prevent conformational changes of the Brownian motor, whereas in the power-stroke motor EF-G still has detectable motions in the presence of Vio due to the tilted energy landscape.
Fig. S12.
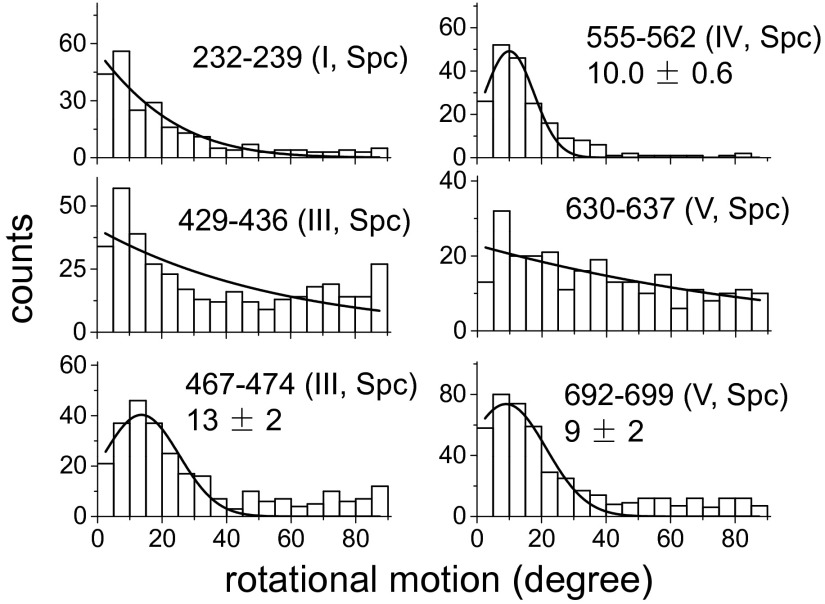
Distributions of rotational angles of EF-GBR domains in the presence 2 mM Spc.
In contrast, Vio and Spc had little or even no effect on rotations of domains I (EF-GBR232-239), IV (EF-GBR555-562), and IV–V (EF-GBR692-699) (Figs. 2B and 3A and Fig. S12). Moreover, the antibiotics had no significant effect on the proportion between rotating and nonrotating EF-GBR binding events and their occupancy times on the ribosome (Table S3). Most strikingly, neither Vio nor Spc had perceptible effects on rotation of EF-GBR429-436, domain III, when the A site was empty (Fig. S11), strongly suggesting that tRNA must be present in the A site for Vio and Spc to hinder the large rotational motions of EF-G domain III. The simplest explanation of this result is that when the tRNAs cannot move due to the action of the antibiotics, they become a physical barrier that blocks domain III’s local motion as well, consistent with the notion introduced above that such local motion is directly correlated with tRNA translational movement.
Whether EF-G functions as a force-generating power-stroke motor or the pawl of a Brownian ratchet that blocks reversal of ribosome and tRNA/mRNA thermal fluctuations has long been debated (20, 30, 40–42). We illustrate these two ideas by the simplified schematic energy landscapes in Fig. 3B. The reaction coordinate here is conceptually the translocation distance of the mRNA and tRNAs between their PRE- and POST-translocation positions. In the power-stroke model (Fig. 3B, Upper), EF-G converts biochemical energy of GTP hydrolysis and product release to mechanical work. The force generated by EF-G along the reaction coordinate tilts the energy landscape by slope ΔG/Δx = Force (blue line), which decreases the energy barrier (red curve before force generation vs. green curve after application of force) and actively promotes movements of tRNAs and mRNA from the PRE-translocation state. In the Brownian-ratchet model, the energy barrier between initial and final states is lower, and thermal energy drives fluctuations between initial and final states of translocation. In this model conformational changes in EF-G and/or the ribosome, triggered by the transiently formed POST-translocation state, cause domain IV of EF-G to act as a pawl (blue line), suppressing the backward reaction and thereby stabilizing the POST state (2). In the Brownian-ratchet model of translocation, the role of GTP hydrolysis is mainly to facilitate EF-G dissociation after translocation.
Vio and Spc at the low concentrations used here stabilize the ribosome in PRE conformational states, with the Vio-stabilized state occurring earlier in the translocation process than the Spc-stabilized state (14, 19, 33–37, 43, 44). Such stabilizations correspond to large energy barriers (shown in magenta for Vio in Fig. 3) between the initial and final states (33, 45). According to the Brownian-ratchet model, the induced barrier blocks thermally driven fluctuations of the ribosomal complex between the PRE- and POST-translocation states without affecting the position of the energy minimum in the initial state. EF-G conformational changes, required for blocking the back reaction, would not take place in the presence of Vio or Spc. In contrast, we find that EF-G domains, including domain III, undergo similar rotations in the presence of Vio and Spc (Fig. 3A and Fig. S12). In the power-stroke model, the force generated by EF-G–catalyzed GTPase can still tilt the energy landscape of the initial state before the antibiotic-generated energy barrier is encountered, thus shifting the position of the energy minimum in the PRE state (black arrow in Fig. 3B). The EF-G–bound ribosome complex moving along the reaction coordinate to this new energy minimum would exhibit small global structural changes, including in EF-G domain III, as we detect in the presence of Vio and Spc. Therefore, our findings strongly suggest that, at least for the initial portion of translocation, EF-G tilts the energy landscape, by generating a force (Figs. 3B and 4). In the presence of Vio and Spc, A-site–bound peptidyl-tRNA presents a physical barrier that suppresses large motions of EF-G.
Disrupting the interactions between the mRNA–tRNA duplex and ribosomal RNA in the decoding center (bases A1492 and A1493) by the tip of EF-G domain IV is thought to be a critical step that reduces the energy barrier for tRNA and mRNA movement (29, 46). Binding of Vio to the 30S subunit affects the positioning of A1492 and A1493, which presumably strengthens interactions of the mRNA–tRNA duplex with the decoding center (43). If the effect of EF-G’s initial stroke is to accelerate disruption of mRNA–tRNA interactions, then Vio would be expected to slow EF-G’s motions. Our observation that rates of EF-G rotational motions on the ribosome are unaffected by Vio implies that the initial power-stroke motion of EF-G does not act directly to disrupt interactions between mRNA, tRNA, A1492, and A1493. Instead, the power-stroke force is likely to foster structural rearrangements in the ribosome before tRNA and mRNA movements. Therefore, force applied by the ribosome on mRNA to unwind downstream secondary structures (47–49) is unlikely to be directly generated by the initial power stroke of EF-G. This is consistent with earlier suggestions that GTP hydrolysis triggers an “unlocking process” in the ribosome that enables further translocation steps, including ribosomal subunit rotation, tRNA and mRNA motion, and 30S head movement (18).
After the initial power stroke, EF-G undergoes further steps to complete translocation. During these steps, domain IV is likely to escort the A-site tRNA into the P site in the 30S subunit or follow it after spontaneous tRNA arrival. Domain IV does not exhibit the large rotations of domain III, indicating that they are not rigidly coupled during the rotation of domain III. These later motions of EF-G could proceed by either the power-stroke or Brownian-ratchet mechanism (Fig. 4). Recent evidence obtained from the force dependence of translational velocity in an optical trap favors the latter (48), consistent with the proposal these later steps are mainly driven by the energetics of the ribosome itself (20). Holtkamp et al. (24) also suggested a hybrid model combining power-stroke and Brownian-ratchet mechanisms. Using Vio and Spc, we were able to trap EF-G motions at early and later intermediate states, respectively. The dissociation rates of EF-G from the states trapped by Vio and Spc are almost the same as the ones during normal translocation, implying that EF-G can naturally dissociate before translocation is completed. The variability of domain III rotational motions indicates that EF-G may adopt various structures in different ribosomes after its abrupt conformational change (Fig. 1C), which is in line with various translocation intermediates that have been described (9, 15, 29). A hybrid model (Fig. 4), in which EF-G functions as a Brownian-ratchet pawl after its initial force generation, could rationalize the multiple structures and reaction pathways of EF-G.
Summary
Our studies directly capture previously undetected rotational motions of EF-G on the ribosome during normal translocation. Neither Vio, nor Spc, nor an empty A site completely abolishes motions of EF-G on the ribosome. Vio, which prevents translocation by increasing the affinity of tRNA to the A site ∼1,000 fold, barely affects kinetic rates of EF-G conformational changes, but markedly reduces the magnitude of EF-G domain III rotation. These findings suggest that conformational changes of EF-G on the ribosome that follow GTP hydrolysis early in translocation generate a mechanical force that either moves the mRNA and tRNAs directly or facilitates an “unlocking” of the ribosome that enables movement. Combining our results with those of others, we conclude that the ribosome and EF-G make use of both power-stroke and Brownian-ratchet mechanisms to ensure the efficiency and accuracy of translocation.
mRNA Sequences
40-nt mRNA: G UUA AUA AGG AUA CAU ACU AUG UUC GUG UUC GUG UUC GUG.
65-nt mRNA: AUU UAA AAG UUA AUA AGG AUA CAU ACU AUG UUC GUG UUC GUG UUC GUG UUC GUG UUC GUG UUC GU.
80-nt mRNA: AAU UCA AAA AUU UAA AAG UUA AUA AGG AUA CAU ACU AUG UUC GUG UUC GUG UUC GUG UUC GUG UUC GUG UUC GUG UUC GU.
The underlined sequences are start codons. All mRNAs were purchased from Dharmacon and had both 5′ and 3′ biotinylated.
Ribosome and tRNA Preparation
The 70S ribosomes were prepared according to published procedures (3, 25, 50, 51). Initiation complexes were formed by incubation of 70S ribosomes with mRNA, initiation factors 1–3, GTP, and fMet-tRNAfMet in TAM15 buffer (15 mM MgAc2, 50 mM Tris⋅HCl, pH 7.5, 30 mM NH4Cl, 70 mM KCl, and 1 mM DTT), at 37 °C for 25 min, followed by centrifugation through a sucrose cushion (3).
Amino acid-specific tRNAs, Escherichia coli tRNAfMet, yeast tRNAPhe, and E. coli tRNAVal were purchased from Chemical Block and charged and labeled as described (52, 53). Neither the charging nor the labeling reactions were stoichiometric. Partial separation of charged from uncharged tRNAs was achieved by reverse-phase HPLC, using a LiChrospher WP-300 RP-18 column (5-μm beads, 250–4 mm; Merck KGaA-Darmstadt). The tRNA mixture was applied to the column equilibrated with buffer E (20 mM NH4Ac, pH 5.0, 10 mM MgAc2, and 400 mM NaCl) and the aminoacylated tRNAs were eluted with a linear gradient of buffer E containing 30% (vol/vol) ethanol. Cy3/Cy5-labeled tRNAs were fully resolved from unlabeled tRNAs using the same column and buffers, but at a higher pH (7.0) with elution at 10 °C instead of room temperature. Stoichiometries of fluorophore/tRNA labeling varied from 0.7 to 1.2 probe per tRNA (53). Ternary complexes were formed by incubating 2 µM EF-Tu, 1 µM charged tRNAs, 3 mM GTP, 1.3 mM phosphoenolpyruvate, and 5 µg/mL pyruvate kinase in TAM15 buffer for 15 min at 37 °C.
EF-GBR Preparation and Activity
Mutation sites of all EF-GBRs are listed in Table S1. EF-G variants labeled with bifunctional rhodamine dye (BR-I2, a generous gift from J. E. T. Corrie, National Institute for Medical Research, Mill Hill, London) were prepared and characterized according to published procedures (54, 55). EF-G was exchanged into the labeling buffer (50 mM Hepes, pH 7.4, 1 mM MgCl2, 100 mM NaCl, 15 μM GDP). TCEP [Tris (2-chloroethyl) phosphate] was then added to a final concentration of 1 mM, with incubatation at room temperature for 50 min. BR-I2 dye was added in equal portions four times at 30-min intervals, bringing the final BR-I2:EF-G ratio to 2:1. Following incubation for an additional 3 h at room temperature, the reaction was quenched with MESNA (sodium 2-sulfanylethanesulfonate, final concentration 3 mM). Unreacted dye was removed using a Thermo 22858 column (Thermo Fisher Scientific). The sample was next dialyzed into 50 mM Tris⋅HCl (pH 7.5), 70 mM NH4Cl, 30 mM KCl, 7 mM MgCl2, 1 mM DTT, and 15 μM GDP overnight at 4 °C.
Purification of EF-GBRs was achieved by FPLC, using a TSK column. The EF-GBR mixture was applied to the column with buffer A (3.5 M NaCl, 20 mM Hepes (pH 7.4), 15 μM GDP, 5 mM MgCl2) and was eluted with a linear gradient of 100% buffer A to 100% buffer B [20 mM Hepes (pH 7.4), 15 μM GDP, 5 mM MgCl2]. Eluted peaks with fluorescence were collected and dialyzed into 50 mM Tris⋅HCl (pH 7.5), 70 mM NH4Cl, 30 mM KCl, 7 mM MgCl2, 1 mM DTT, and 15 μM GDP for storage.
To verify that BR cross-linked the two engineered Cys residues, each EF-GBR was digested by a site-specific protease (endoproteinase Lys-C or trypsin, sequencing grade). Digested peptide fragments were separated by analytical HPLC (reverse-phase C18). The fluorescent fragments were collected and analyzed by electrospray time-of-flight mass spectrometry (Fig. S1) (54). No masses corresponding to fragments derived from monofunctional labeling were found, whereas the masses of the expected bifunctional labeled fragments were present, indicating that all of the EF-GBR samples have the two engineered Cys residues cross-linked by BR.
Cysteine-free EF-G and its mutants have been used in several previous studies, including refs. 4, 16, 17, 56, and 57. These EF-G mutants were shown to have similar activities to those of wild-type EF-G (WT-EF-G) to promote translocation. Using single-molecule fluorescence resonance energy transfer (smFRET) between ribosomal protein L11 and A-site tRNA (3), we characterized the activities of EF-G mutants in promoting translocation by quantifying movements of tRNA from A site to P site (Table S1). Those EF-GBRs, whose translocation activities were 70% or higher compared with the WT-EF-G, were used in further polTIRF experiments. The measured dwell times from all of our labeled mutants used in polTIRF experiments (Tables S2 and S3) are in the same range and consistent with other measurements in the literature (1, 4, 18, 19, 58, 59), indicating high activity.
The Principle of polTIRF
Details of the polTIRF method, including the instrumentation, data acquisition, and analysis, have been described elsewhere (22, 23, 26, 60).
In brief, BR probes attached to EF-G were excited by polarized evanescent waves generated in a prism-type total internal reflection microscope. The polarized fluorescent emission from single BR probes was used to determine its 3D orientation. A total of 16 combinations of temporally modulated excitation path and excitation polarization and simultaneously measured emission polarization were collected, allowing unambiguous 3D resolution of individual probe dipole orientations within a hemisphere. The remaining ambiguity is due to the dipolar nature of the fluorescent probe. The ribosomes were unlabeled and their absolute orientations during experiments were unknown. Therefore, we do not obtain absolute angles between EF-G and the ribosomes. The rotational motions of the ribosomes were restricted by attachment via two ends of the mRNA as shown in Fig. S2. On the other hand, rotational motions of the labeled EF-G domains could be clearly quantified as the angle change between different probe dipole orientations during each individual EF-G binding event that led to translocation. All probes reported here had microsecond wobbles with conical half-angles of ∼45°. This wobble is the aggregate of ribosome, whole EF-G, and local secondary structure flexibility, giving the upper limit of all of them to be less than ∼45°. Due to the twofold symmetry of the probe dipole, measured angle changes between two dipoles positions can be either or Considering that most structural studies suggest relatively small rotational motions while EF-G is on the ribosome, angles smaller than were used to represent rotational motions of the EF-G domains.
Acquisition and Analysis of polTIRF Data
All polTIRF studies were carried out at 18 °C. Initiation complexes were specifically attached to microscope flow cells via biotinylated mRNA to PEG-passivated quartz slides (61), decorated with biotin-PEG and streptavidin. polTIRF experiments were performed in TAM15 buffer (15 mM MgAc2, 50 mM Tris⋅HCl, pH 7.5, 30 mM NH4Cl, 70 mM KCl) with 100 mM DTT to diminish photoblinking and bleaching of the BR probe.
Two alternating beams from a 532-nm Nd:YAG laser were projected through a coupling prism at a glancing incident angle, producing an evanescent field at the quartz slide/aqueous interface. Switching between the two beams (termed path 1 and path 2), which were in perpendicular planes, was achieved by computer-controlled voltages applied to a Pockels cell and a polarizing beam-splitting cube. Similarly, the polarization of the laser in each beam was switched between four different linear polarizations (s, 90°; p, 0°; L, +45°; and R, −45° relative to the plane defined by the incident and reflected beams) by an additional Pockels cell and a Berek compensator in each beam. These combinations result in a total of eight incident excitations. Each of the polarized excitations illuminated the sample for 100 µs.
Fluorescence emission was collected by a Leica 100 × 1.2 NA water immersion objective lens, passed through a long-pass blocking filter, and directed onto two avalanche photodiodes (APDx and APDy) through a polarizing beam splitter that resolved its x and y components. Thus, a total of 16 combinations of excitation path, excitation polarization, and emission polarization were collected as a cycle each 800 μs and plotted as PFIs. They were termed s1x, s1y, s2x, s2y, p1x, p1y, p2x, p2y, R1x, R1y, R2x, R2y, L1x, L1y, L2x, and L2y (s, p, R, and L indicate incident polarization; the number indicates path; and x and y indicate the detector). A maximum-likelihood, multitrace change-point algorithm was used to identify statistically valid change points caused by sudden rotations and to localize their timing within several milliseconds (26). For visualization purposes, single-photon counts were converted to and plotted as 16 PFIs by counting the number of photons detected during successive constant 8-ms time bins (Fig. 1 C and D and Figs. S4–S9). An analytical model of the PFIs expected from adjustable angles was fitted by maximum likelihood to averages of the 16 PFIs over the intervals between the sudden change points to determine the orientation of the probe absorption and emission dipole and the rotational motion.
The spot detection nature of the avalanche photodiodes necessitates observing repeated events of EF-G binding within the 2 × 2-μm detection area to obtain valid, reproducible data. EF-G binding and dissociation from normally translating ribosomes or repeated EF-G binding to Vio- or Spc-blocked ribosomes thus enable reliable events to be collected. Trapping EF-G on the ribosome, though, using nonhydrolyzable GTP analogs or antibiotic fusidic acid does not provide reliable data. Due to the stochastic nature of the normal reactions, each individual single-molecule polTIRF event has unique features that contain real thermal motions of the sample and stochastic fluctuations in photon counting, dwell times, and tilting. Hundreds of single-molecule polTIRF traces, such as the one shown in Fig. 1 C and D and Figs. S4–S9, were collected under each experimental condition to compile distributions of dwell times and rotation as shown in Figs. 2 and 3A and Figs. S11 and S12 and to extract thermal motions of the labeled helix.
Acknowledgments
This work was supported by NIH Grant R01GM080376 (to B.S.C. and Y.E.G.) and AHA Postdoctoral Fellowship 12POST8910014 (to C.C.).
Footnotes
The authors declare no conflict of interest.
This article is a PNAS Direct Submission.
This article contains supporting information online at www.pnas.org/lookup/suppl/doi:10.1073/pnas.1602668113/-/DCSupplemental.
References
- 1.Rodnina MV, Savelsbergh A, Katunin VI, Wintermeyer W. Hydrolysis of GTP by elongation factor G drives tRNA movement on the ribosome. Nature. 1997;385(6611):37–41. doi: 10.1038/385037a0. [DOI] [PubMed] [Google Scholar]
- 2.Adio S, et al. Fluctuations between multiple EF-G-induced chimeric tRNA states during translocation on the ribosome. Nat Commun. 2015;6:7442. doi: 10.1038/ncomms8442. [DOI] [PMC free article] [PubMed] [Google Scholar]
- 3.Chen C, et al. Single-molecule fluorescence measurements of ribosomal translocation dynamics. Mol Cell. 2011;42(3):367–377. doi: 10.1016/j.molcel.2011.03.024. [DOI] [PMC free article] [PubMed] [Google Scholar]
- 4.Chen J, Petrov A, Tsai A, O’Leary SE, Puglisi JD. Coordinated conformational and compositional dynamics drive ribosome translocation. Nat Struct Mol Biol. 2013;20(6):718–727. doi: 10.1038/nsmb.2567. [DOI] [PMC free article] [PubMed] [Google Scholar]
- 5.al-Karadaghi S, Aevarsson A, Garber M, Zheltonosova J, Liljas A. The structure of elongation factor G in complex with GDP: Conformational flexibility and nucleotide exchange. Structure. 1996;4(5):555–565. doi: 10.1016/s0969-2126(96)00061-5. [DOI] [PubMed] [Google Scholar]
- 6.Czworkowski J, Wang J, Steitz TA, Moore PB. The crystal structure of elongation factor G complexed with GDP, at 2.7 A resolution. EMBO J. 1994;13(16):3661–3668. doi: 10.1002/j.1460-2075.1994.tb06675.x. [DOI] [PMC free article] [PubMed] [Google Scholar]
- 7.Frank J, Gao H, Sengupta J, Gao N, Taylor DJ. The process of mRNA-tRNA translocation. Proc Natl Acad Sci USA. 2007;104(50):19671–19678. doi: 10.1073/pnas.0708517104. [DOI] [PMC free article] [PubMed] [Google Scholar]
- 8.Connell SR, et al. Structural basis for interaction of the ribosome with the switch regions of GTP-bound elongation factors. Mol Cell. 2007;25(5):751–764. doi: 10.1016/j.molcel.2007.01.027. [DOI] [PubMed] [Google Scholar]
- 9.Fischer N, Konevega AL, Wintermeyer W, Rodnina MV, Stark H. Ribosome dynamics and tRNA movement by time-resolved electron cryomicroscopy. Nature. 2010;466(7304):329–333. doi: 10.1038/nature09206. [DOI] [PubMed] [Google Scholar]
- 10.Agirrezabala X, et al. Structural characterization of mRNA-tRNA translocation intermediates. Proc Natl Acad Sci USA. 2012;109(16):6094–6099. doi: 10.1073/pnas.1201288109. [DOI] [PMC free article] [PubMed] [Google Scholar]
- 11.Tourigny DS, Fernández IS, Kelley AC, Ramakrishnan V. Elongation factor G bound to the ribosome in an intermediate state of translocation. Science. 2013;340(6140):1235490. doi: 10.1126/science.1235490. [DOI] [PMC free article] [PubMed] [Google Scholar]
- 12.Zhou J, Lancaster L, Donohue JP, Noller HF. Crystal structures of EF-G-ribosome complexes trapped in intermediate states of translocation. Science. 2013;340(6140):1236086. doi: 10.1126/science.1236086. [DOI] [PMC free article] [PubMed] [Google Scholar]
- 13.Pulk A, Cate JHD. Control of ribosomal subunit rotation by elongation factor G. Science. 2013;340(6140):1235970. doi: 10.1126/science.1235970. [DOI] [PMC free article] [PubMed] [Google Scholar]
- 14.Brilot AF, Korostelev AA, Ermolenko DN, Grigorieff N. Structure of the ribosome with elongation factor G trapped in the pretranslocation state. Proc Natl Acad Sci USA. 2013;110(52):20994–20999. doi: 10.1073/pnas.1311423110. [DOI] [PMC free article] [PubMed] [Google Scholar]
- 15.Zhou J, Lancaster L, Donohue JP, Noller HF. How the ribosome hands the A-site tRNA to the P site during EF-G-catalyzed translocation. Science. 2014;345(6201):1188–1191. doi: 10.1126/science.1255030. [DOI] [PMC free article] [PubMed] [Google Scholar]
- 16.Salsi E, Farah E, Dann J, Ermolenko DN. Following movement of domain IV of elongation factor G during ribosomal translocation. Proc Natl Acad Sci USA. 2014;111(42):15060–15065. doi: 10.1073/pnas.1410873111. [DOI] [PMC free article] [PubMed] [Google Scholar]
- 17.Salsi E, Farah E, Netter Z, Dann J, Ermolenko DN. Movement of elongation factor G between compact and extended conformations. J Mol Biol. 2015;427(2):454–467. doi: 10.1016/j.jmb.2014.11.010. [DOI] [PMC free article] [PubMed] [Google Scholar]
- 18.Savelsbergh A, et al. An elongation factor G-induced ribosome rearrangement precedes tRNA-mRNA translocation. Mol Cell. 2003;11(6):1517–1523. doi: 10.1016/s1097-2765(03)00230-2. [DOI] [PubMed] [Google Scholar]
- 19.Pan D, Kirillov SV, Cooperman BS. Kinetically competent intermediates in the translocation step of protein synthesis. Mol Cell. 2007;25(4):519–529. doi: 10.1016/j.molcel.2007.01.014. [DOI] [PMC free article] [PubMed] [Google Scholar]
- 20.Frank J, Gonzalez RL., Jr Structure and dynamics of a processive Brownian motor: The translating ribosome. Annu Rev Biochem. 2010;79:381–412. doi: 10.1146/annurev-biochem-060408-173330. [DOI] [PMC free article] [PubMed] [Google Scholar]
- 21.Munro JB, Sanbonmatsu KY, Spahn CMT, Blanchard SC. Navigating the ribosome’s metastable energy landscape. Trends Biochem Sci. 2009;34(8):390–400. doi: 10.1016/j.tibs.2009.04.004. [DOI] [PMC free article] [PubMed] [Google Scholar]
- 22.Beausang JF, Shroder DY, Nelson PC, Goldman YE. Tilting and wobble of myosin V by high-speed single-molecule polarized fluorescence microscopy. Biophys J. 2013;104(6):1263–1273. doi: 10.1016/j.bpj.2013.01.057. [DOI] [PMC free article] [PubMed] [Google Scholar]
- 23.Forkey JN, Quinlan ME, Shaw MA, Corrie JET, Goldman YE. Three-dimensional structural dynamics of myosin V by single-molecule fluorescence polarization. Nature. 2003;422(6930):399–404. doi: 10.1038/nature01529. [DOI] [PubMed] [Google Scholar]
- 24.Holtkamp W, et al. GTP hydrolysis by EF-G synchronizes tRNA movement on small and large ribosomal subunits. EMBO J. 2014;33(9):1073–1085. doi: 10.1002/embj.201387465. [DOI] [PMC free article] [PubMed] [Google Scholar]
- 25.Stevens B, et al. FRET-based identification of mRNAs undergoing translation. PLoS One. 2012;7(5):e38344. doi: 10.1371/journal.pone.0038344. [DOI] [PMC free article] [PubMed] [Google Scholar]
- 26.Beausang JF, Goldman YE, Nelson PC. Changepoint analysis for single-molecule polarized total internal reflection fluorescence microscopy experiments. Methods Enzymol. 2011;487:431–463. doi: 10.1016/B978-0-12-381270-4.00015-9. [DOI] [PMC free article] [PubMed] [Google Scholar]
- 27.Li W, Trabuco LG, Schulten K, Frank J. Molecular dynamics of EF-G during translocation. Proteins. 2011;79(5):1478–1486. doi: 10.1002/prot.22976. [DOI] [PMC free article] [PubMed] [Google Scholar]
- 28.Gao YG, et al. The structure of the ribosome with elongation factor G trapped in the posttranslocational state. Science. 2009;326(5953):694–699. doi: 10.1126/science.1179709. [DOI] [PMC free article] [PubMed] [Google Scholar]
- 29.Ramrath DJ, et al. Visualization of two transfer RNAs trapped in transit during elongation factor G-mediated translocation. Proc Natl Acad Sci USA. 2013;110(52):20964–20969. doi: 10.1073/pnas.1320387110. [DOI] [PMC free article] [PubMed] [Google Scholar]
- 30.Ratje AH, et al. Head swivel on the ribosome facilitates translocation by means of intra-subunit tRNA hybrid sites. Nature. 2010;468(7324):713–716. doi: 10.1038/nature09547. [DOI] [PMC free article] [PubMed] [Google Scholar]
- 31.Munro JB, Altman RB, Tung CS, Sanbonmatsu KY, Blanchard SC. A fast dynamic mode of the EF-G-bound ribosome. EMBO J. 2010;29(4):770–781. doi: 10.1038/emboj.2009.384. [DOI] [PMC free article] [PubMed] [Google Scholar]
- 32.Lin J, Gagnon MG, Bulkley D, Steitz TA. Conformational changes of elongation factor G on the ribosome during tRNA translocation. Cell. 2015;160(1–2):219–227. doi: 10.1016/j.cell.2014.11.049. [DOI] [PMC free article] [PubMed] [Google Scholar]
- 33.Peske F, Savelsbergh A, Katunin VI, Rodnina MV, Wintermeyer W. Conformational changes of the small ribosomal subunit during elongation factor G-dependent tRNA-mRNA translocation. J Mol Biol. 2004;343(5):1183–1194. doi: 10.1016/j.jmb.2004.08.097. [DOI] [PubMed] [Google Scholar]
- 34.Ly CT, Altuntop ME, Wang Y. Single-molecule study of viomycin’s inhibition mechanism on ribosome translocation. Biochemistry. 2010;49(45):9732–9738. doi: 10.1021/bi101029g. [DOI] [PubMed] [Google Scholar]
- 35.Holm M, Borg A, Ehrenberg M, Sanyal S. Molecular mechanism of viomycin inhibition of peptide elongation in bacteria. Proc Natl Acad Sci USA. 2016;113(4):978–983. doi: 10.1073/pnas.1517541113. [DOI] [PMC free article] [PubMed] [Google Scholar]
- 36.Feldman MB, Terry DS, Altman RB, Blanchard SC. Aminoglycoside activity observed on single pre-translocation ribosome complexes. Nat Chem Biol. 2010;6(1):54–62. doi: 10.1038/nchembio.274. [DOI] [PMC free article] [PubMed] [Google Scholar]
- 37.Ermolenko DN, et al. The antibiotic viomycin traps the ribosome in an intermediate state of translocation. Nat Struct Mol Biol. 2007;14(6):493–497. doi: 10.1038/nsmb1243. [DOI] [PubMed] [Google Scholar]
- 38.Cornish PV, Ermolenko DN, Noller HF, Ha T. Spontaneous intersubunit rotation in single ribosomes. Mol Cell. 2008;30(5):578–588. doi: 10.1016/j.molcel.2008.05.004. [DOI] [PMC free article] [PubMed] [Google Scholar]
- 39.Borovinskaya MA, Shoji S, Holton JM, Fredrick K, Cate JHD. A steric block in translation caused by the antibiotic spectinomycin. ACS Chem Biol. 2007;2(8):545–552. doi: 10.1021/cb700100n. [DOI] [PMC free article] [PubMed] [Google Scholar]
- 40.Cunha CE, et al. Dual use of GTP hydrolysis by elongation factor G on the ribosome. Translation. 2013;1(1):e24315. doi: 10.4161/trla.24315. [DOI] [PMC free article] [PubMed] [Google Scholar]
- 41.Ermolenko DN, Cornish PV, Ha T, Noller HF. Antibiotics that bind to the A site of the large ribosomal subunit can induce mRNA translocation. RNA. 2013;19(2):158–166. doi: 10.1261/rna.035964.112. [DOI] [PMC free article] [PubMed] [Google Scholar]
- 42.Dunkle JA, et al. Structures of the bacterial ribosome in classical and hybrid states of tRNA binding. Science. 2011;332(6032):981–984. doi: 10.1126/science.1202692. [DOI] [PMC free article] [PubMed] [Google Scholar]
- 43.Stanley RE, Blaha G, Grodzicki RL, Strickler MD, Steitz TA. The structures of the anti-tuberculosis antibiotics viomycin and capreomycin bound to the 70S ribosome. Nat Struct Mol Biol. 2010;17(3):289–293. doi: 10.1038/nsmb.1755. [DOI] [PMC free article] [PubMed] [Google Scholar]
- 44.Ning W, Fei J, Gonzalez RL., Jr The ribosome uses cooperative conformational changes to maximize and regulate the efficiency of translation. Proc Natl Acad Sci USA. 2014;111(33):12073–12078. doi: 10.1073/pnas.1401864111. [DOI] [PMC free article] [PubMed] [Google Scholar]
- 45.Shoji S, Walker SE, Fredrick K. Reverse translocation of tRNA in the ribosome. Mol Cell. 2006;24(6):931–942. doi: 10.1016/j.molcel.2006.11.025. [DOI] [PMC free article] [PubMed] [Google Scholar]
- 46.Liu G, et al. EF-G catalyzes tRNA translocation by disrupting interactions between decoding center and codon-anticodon duplex. Nat Struct Mol Biol. 2014;21(9):817–824. doi: 10.1038/nsmb.2869. [DOI] [PubMed] [Google Scholar]
- 47.Chen C, et al. Dynamics of translation by single ribosomes through mRNA secondary structures. Nat Struct Mol Biol. 2013;20(5):582–588. doi: 10.1038/nsmb.2544. [DOI] [PMC free article] [PubMed] [Google Scholar]
- 48.Liu T, et al. Direct measurement of the mechanical work during translocation by the ribosome. eLife. 2014;3:e03406. doi: 10.7554/eLife.03406. [DOI] [PMC free article] [PubMed] [Google Scholar]
- 49.Yao L, Li Y, Tsai TW, Xu S, Wang Y. Noninvasive measurement of the mechanical force generated by motor protein EF-G during ribosome translocation. Angew Chem Int Ed Engl. 2013;52(52):14041–14044. doi: 10.1002/anie.201307419. [DOI] [PubMed] [Google Scholar]
- 50.Rodnina MV, Wintermeyer W. GTP consumption of elongation factor Tu during translation of heteropolymeric mRNAs. Proc Natl Acad Sci USA. 1995;92(6):1945–1949. doi: 10.1073/pnas.92.6.1945. [DOI] [PMC free article] [PubMed] [Google Scholar]
- 51.Subramanian AR, Dabbs ER. Functional studies on ribosomes lacking protein L1 from mutant Escherichia coli. Eur J Biochem. 1980;112(2):425–430. doi: 10.1111/j.1432-1033.1980.tb07222.x. [DOI] [PubMed] [Google Scholar]
- 52.Pan D, Qin H, Cooperman BS. Synthesis and functional activity of tRNAs labeled with fluorescent hydrazides in the D-loop. RNA. 2009;15(2):346–354. doi: 10.1261/rna.1257509. [DOI] [PMC free article] [PubMed] [Google Scholar]
- 53.Kaur J, Raj M, Cooperman BS. Fluorescent labeling of tRNA dihydrouridine residues: Mechanism and distribution. RNA. 2011;17(7):1393–1400. doi: 10.1261/rna.2670811. [DOI] [PMC free article] [PubMed] [Google Scholar]
- 54.Beausang JF, Sun Y, Quinlan ME, Forkey JN, Goldman YE. Fluorescent labeling of calmodulin with bifunctional rhodamine. Cold Spring Harb Protoc. 2012;2012(5):pdb.prot069351. doi: 10.1101/pdb.prot069351. [DOI] [PMC free article] [PubMed] [Google Scholar]
- 55.Beausang JF, Sun Y, Quinlan ME, Forkey JN, Goldman YE. Fluorescent labeling of myosin V for polarized total internal reflection fluorescence microscopy (polTIRFM) motility assays. Cold Spring Harb Protoc. 2012;2012(5):pdb.prot069369. doi: 10.1101/pdb.prot069369. [DOI] [PMC free article] [PubMed] [Google Scholar]
- 56.Wilson KS, Noller HF. Mapping the position of translational elongation factor EF-G in the ribosome by directed hydroxyl radical probing. Cell. 1998;92(1):131–139. doi: 10.1016/s0092-8674(00)80905-8. [DOI] [PubMed] [Google Scholar]
- 57.Ticu C, Nechifor R, Nguyen B, Desrosiers M, Wilson KS. Conformational changes in switch I of EF-G drive its directional cycling on and off the ribosome. EMBO J. 2009;28(14):2053–2065. doi: 10.1038/emboj.2009.169. [DOI] [PMC free article] [PubMed] [Google Scholar]
- 58.Ermolenko DN, Noller HF. mRNA translocation occurs during the second step of ribosomal intersubunit rotation. Nat Struct Mol Biol. 2011;18(4):457–462. doi: 10.1038/nsmb.2011. [DOI] [PMC free article] [PubMed] [Google Scholar]
- 59.Studer SM, Feinberg JS, Joseph S. Rapid kinetic analysis of EF-G-dependent mRNA translocation in the ribosome. J Mol Biol. 2003;327(2):369–381. doi: 10.1016/s0022-2836(03)00146-3. [DOI] [PubMed] [Google Scholar]
- 60.Beausang JF, Sun Y, Quinlan ME, Forkey JN, Goldman YE. The acquisition and analysis of polarized total internal reflection fluorescence microscopy (polTIRFM) data. Cold Spring Harb Protoc. 2012;2012(6):722–725. doi: 10.1101/pdb.prot069419. [DOI] [PMC free article] [PubMed] [Google Scholar]
- 61.Roy R, Hohng S, Ha T. A practical guide to single-molecule FRET. Nat Methods. 2008;5(6):507–516. doi: 10.1038/nmeth.1208. [DOI] [PMC free article] [PubMed] [Google Scholar]
- 62.Chen C, et al. Kinetic schemes for post-synchronized single molecule dynamics. Biophys J. 2012;102(6):L23–L25. doi: 10.1016/j.bpj.2012.01.054. [DOI] [PMC free article] [PubMed] [Google Scholar]


