Significance
Natural killer T (NKT) cells are a specialized population of innate-like T cells that acquire their effector program during development under the control of the transcription factor PLZF (promyelocytic leukemia zinc finger, encoded by Zbtb16). To elucidate the mechanisms underlying this unique property of PLZF, we performed ChIP-seq and microarray analysis of NKT cells and PLZF-transgenic T cells, which revealed direct regulation of effector genes and of T-helper–specific transcription factors. Notably, PLZF also bound and repressed Bach2, a global repressor of effector differentiation. Thus, multiple layers of positive and negative regulation coordinate the induction of the innate effector program by PLZF.
Keywords: PLZF, NKT, lymphocyte, development
Abstract
The transcription factor PLZF [promyelocytic leukemia zinc finger, encoded by zinc finger BTB domain containing 16 (Zbtb16)] is induced during the development of innate and innate-like lymphocytes to direct their acquisition of a T-helper effector program, but the molecular mechanisms involved are poorly understood. Using biotinylation-based ChIP-seq and microarray analysis of both natural killer T (NKT) cells and PLZF-transgenic thymocytes, we identified several layers of regulation of the innate-like NKT effector program. First, PLZF bound and regulated genes encoding cytokine receptors as well as homing and adhesion receptors; second, PLZF bound and activated T-helper–specific transcription factor genes that in turn control T-helper–specific programs; finally, PLZF bound and suppressed the transcription of Bach2, a potent general repressor of effector differentiation in naive T cells. These findings reveal the multilayered architecture of the transcriptional program recruited by PLZF and elucidate how a single transcription factor can drive the developmental acquisition of a broad effector program.
Natural killer (NK) T (NKT) cells are a conserved population of innate-like T cells that express CD1d-restricted semi-invariant αβ T-cell receptors (TCRs), using mostly the Vα14-Jα18 chain in mouse (Vα24-Jα18 in human) combined with variable Vβ8, Vβ7, and Vβ2 (Vβ11 in human) chains, which confer recognition of conserved self and foreign lipids (1–3). NKT cell precursors arise during thymic development at the CD4+CD8+ double-positive stage and undergo massive expansion on interaction with CD1d ligands expressed on cortical thymocytes. They also characteristically acquire an effector CD44hiCD62Llo phenotype along with receptors of the NK cell lineage.
The innate-like effector functions of NKT cells are illustrated by the cells’ ability to promptly secrete large quantities of both IL-4 and IFN-γ either after TCR activation or on exposure to tissue- and antigen-presenting cell-derived cytokines, such as IL-25+IL-33 and IL-12+IL-18, respectively. Whereas C57BL/6 mice produce predominantly NKT cells with a T-bet–dependent type 1 helper phenotype (NKT1), other strains, including BALB/c, also express substantial populations of so-called NKT2 and NKT17 cells with polarized type 2 and type 17 helper programs controlled by GATA3 and RORγt, respectively.
The BTB-zinc finger transcription factor PLZF (promyelocytic leukemia zinc finger, encoded by Zbtb16), is specifically expressed in NKT cells, but not in conventional T cells or NK cells, and directs the acquisition of several key components of the NKT cell effector program during development, including cytokine and migration properties (4–7). Mutations or deletion of Zbtb16 abrogate both the expansion and the effector-memory differentiation of NKT cells, resulting in reversal to a naive phenotype and redistribution to the lymph nodes and circulating blood. PLZF expression is also essential for the development of other innate-like T cells, including MR1-specific semi-invariant αβ T cells and γδ T cells expressing the Vγ1.1-Vδ6.3 TCR (4, 8). Importantly, ectopic expression of PLZF in the CD4 lineage during thymic development converts conventional naïve CD4+ thymocytes into CD44hiCD62Llo effector cells capable of producing both type 1 and type 2 cytokines (9, 10), suggesting that PLZF is not only required, but also sufficient, for acquisition of the innate T-cell effector program. Notably, PLZF was recently found to be transiently expressed during the development of innate lymphoid cells (ILCs), defining a common dedicated precursor to ILCs, the ILCP, and to significantly impact the development and function of ILC lineages (11, 12). Taken together, these findings indicate a broad defining role of PLZF in the differentiation of several innate and innate-like lymphocytes.
The molecular mechanisms underlying these remarkable properties of PLZF are only partially understood. In a γδTCR transgenic mouse model, the genetic inactivation of PLZF was found to compromise expression of the transcription factors Id2 and c-Maf, which are important for the survival of NKT cells in the liver and the production of IL-4, respectively (13). PLZF is essential for the expression of genes encoding cell surface receptors that shape responses to external stimuli, including costimulatory receptor Icos and cytokine receptors Il12rb1 and Il18r1, as well as Cd44. In addition, PLZF down-regulates Sell, which encodes the homing receptor CD62L. The precise molecular mechanisms underlying these regulatory properties, and in particular the question of whether PLZF directly or indirectly controls the expression of effector genes, have not yet been elucidated, however.
Here, using biotinylation-based ChIP-seq and microarray analysis, we identified the PLZF target genes in NKT cells. We found that many of the genes involved in the acquisition of an innate effector program, including T-helper–specific transcription factors, cytokine receptors, and other key surface receptors, are directly bound by PLZF. Notably, we also found that PLZF binds and suppresses Bach2, a broad and potent regulator of effector programs. These results elucidate how a single transcription factor can act at multiple levels to regulate the developmental acquisition of the innate effector gene program.
Results
PLZF Predominantly Binds DNA at Regulatory Sites Carrying Consensus Sequences for ETS, RUNX, and E Proteins.
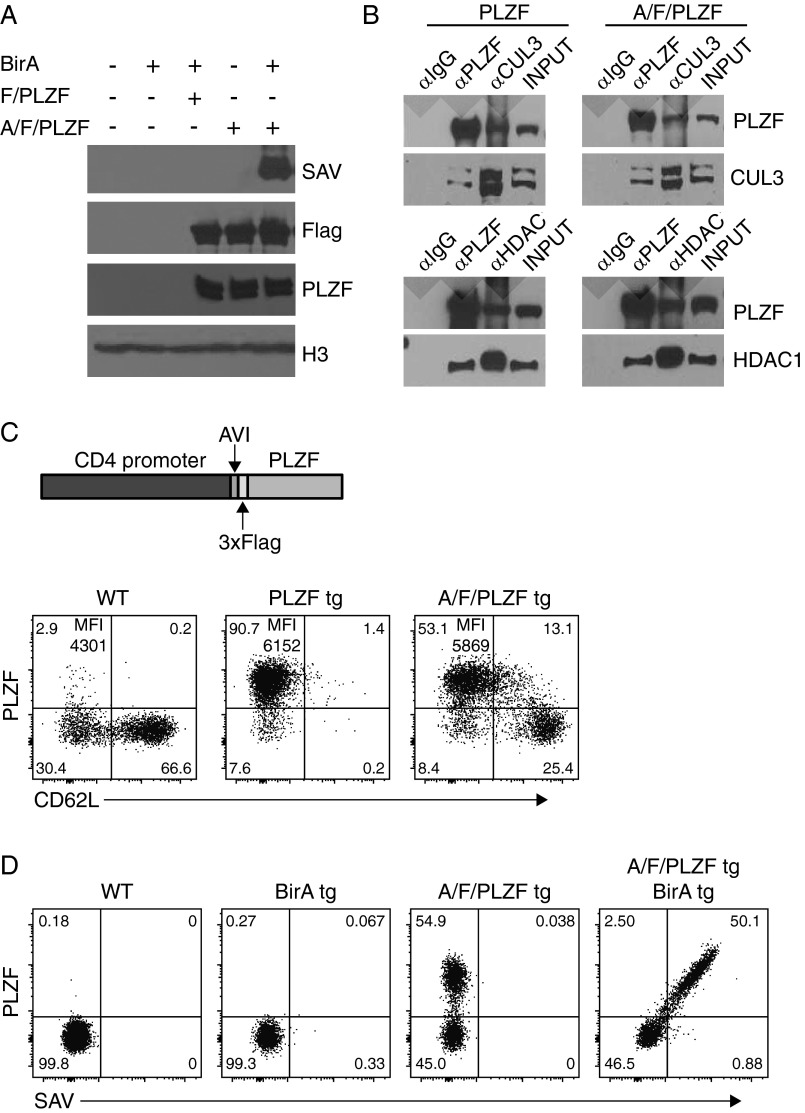
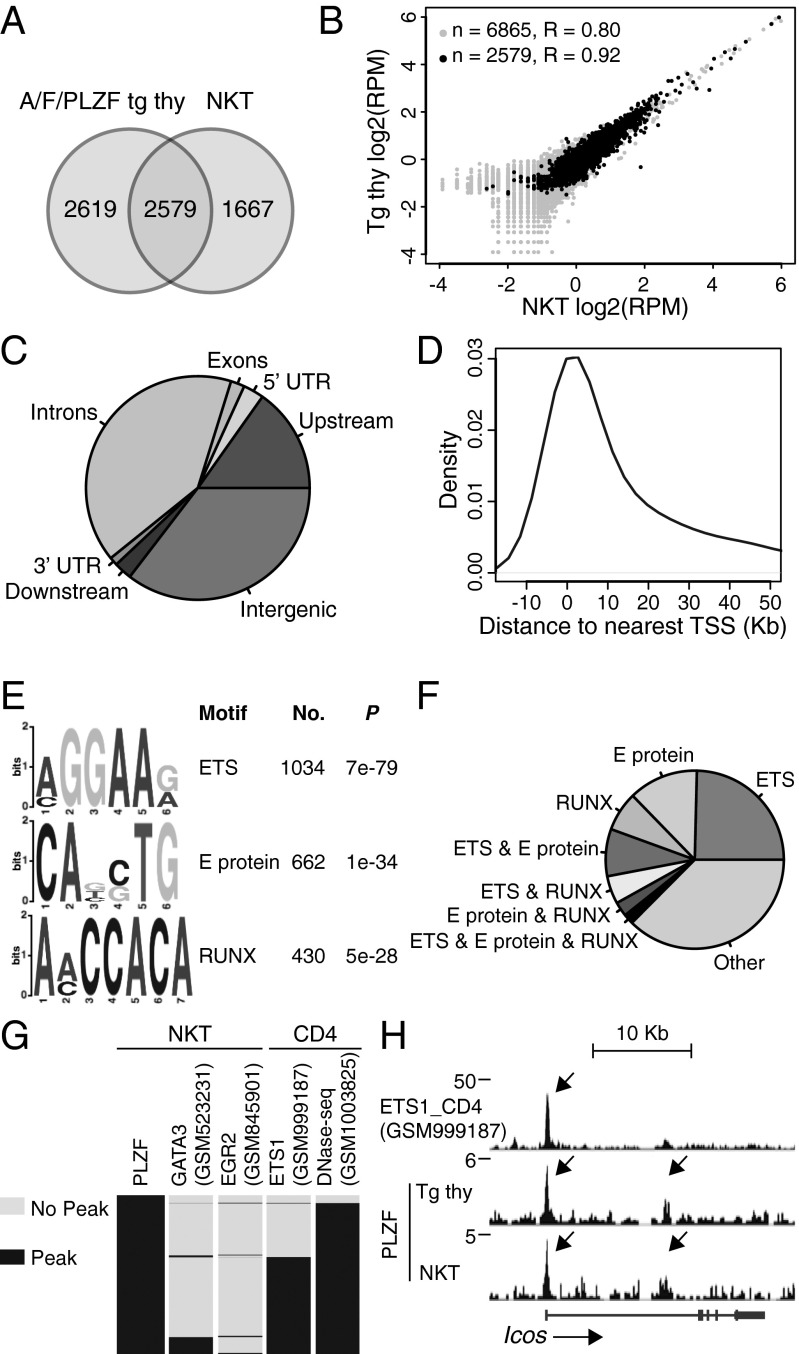
We identified the direct targets of PLZF in NKT cells through ChIP-seq analysis. Because ChIP-seq with various anti-PLZF antibodies was not successful in NKT cells, we generated a transgenic strain expressing a biotin acceptor peptide and a 3×Flag at the N terminus of PLZF (A/F/PLZF tg) under control of the Cd4 promoter, and crossed it to mice expressing a bacterial biotin ligase BirA transgene. In these mice, PLZF could be specifically biotinylated in vivo without altering its interaction with major binding partners, such as CUL3 and HDAC1, or its effector-promoting function (Fig. S1). We used magnetic streptavidin bead pull-down of chromatin from A/F/PLZF tg; BirA tg thymocytes (referred to as Tg thy) or from purified Vα14-Jα18 tg; A/F/PLZF tg; BirA tg NKT thymocytes (referred to as NKT cells) before DNA sequencing. Using the model-based analysis of ChIP-seq (MACS) peak calling software with a P value threshold of 1e-5, we identified 5,198 peaks in the Tg thy and 4,246 peaks in the NKT cells, of which 2,579 peaks were shared (Fig. 1 A and B).
Fig. S1.
AVI/Flag/PLZF tg mice phenocopy PLZF tg mice. (A) Analysis of lysates of 293T cells transfected with indicated plasmids and immunoblotted with streptavidin (SAV)-HRP, anti-Flag, anti-PLZF, and antihistone H3. (B) Analysis of anti-PLZF, anti-CUL3, and anti-HDAC1 immunoprecipitates from lysates of 293T cells transfected with the indicated plasmids and immunoblotted with the indicated antibodies. Data are representative of two independent experiments. (C) Diagram of the Cd4-AVI/Flag/Zbtb16 transgene (Upper) and FACS analysis of surface CD62L and intracellular PLZF in thymic CD4SP cells of AVI/Flag/PLZF (A/F/PLZF) tg mice compared with a reference PLZF tg line expressing PLZF at the same level as endogenous PLZF in NKT stage 1 thymocytes (line #1797) (4) (Lower). The WT littermates of A/F/PLZF tg mice served as controls. Quadrant statistics and mean fluorescence intensity (MFI) of cells in upper left quadrants are indicated. Data are representative of three independent experiments. (D) FACS staining with anti-PLZF and streptavidin (SAV) of thymic CD4SP cells in indicated mice. Data are representative of three independent experiments.
Fig. 1.
Distribution of PLZF ChIP-seq peaks. (A) Overlap of PLZF-bound peaks in A/F/PLZF Tg thy and NKT cells. Peaks were called with the MACS program with a P value cut-off of 1e-5. The minimum overlap required was 1 bp. (B) Scatterplot showing the correlation of peak reads per million (RPM) of all (gray) and overlapping (black) PLZF-bound peaks in Tg thy and NKT cells. (C and D) Distribution of PLZF peaks (C) and distances to the TSSs (D). PLZF was considered associated with a gene if a MACS peak was located anywhere from 5 kb upstream of TSS to 2 kb downstream of a TTS. (E) The top three motifs identified by MEME-ChIP. (F) Proportion of peaks containing the indicated motifs or their combinations. (G) Heatmap showing the overlap of PLZF peaks with GATA3, EGR2, ETS1, and DNase-seq peaks in indicated cell types. The ChIP-seq data for GATA3, EGR2, and ETS1 and the DNase-seq data for CD4 T cells were downloaded from the GEO database with accession numbers as shown. Peaks were called with the MACS program with a P value cut-off of 1e-6. A total of 3,946, 1,262 and 14,061, and 135,874 peaks were called for GATA3, EGR2, and ETS1 ChIP-seq and DNase-seq, respectively. (H) ETS1 and PLZF ChIP-seq reads aligned at the Icos gene locus. The peaks are indicated by arrows.
Visual comparison of peaks in the Tg thy and NKT cells confirmed that the binding landscape of PLZF was largely overlapping in both mouse models. Even when a peak was called in only one model, close inspection often revealed a subthreshold accumulation of reads in the other model. In fact, the analysis of enrichment for consensus sequences produced similar results in both sets of peaks and in the shared peaks. PLZF binding sites were overrepresented in the upstream and intronic regions of genes (Fig. 1C). Density plot analysis suggested that most gene-related peaks were within 10 kb of transcription start sites (TSS) (Fig. 1D).
To explore whether PLZF binding sites contain consensus binding motifs, we examined peaks for the presence of known and novel motifs. The top three motifs, which together account for more than 60% of PLZF-occupied sites, contained consensus sequences for ETS, E proteins, and RUNX factors (Fig. 1 E and F). In support of these findings, comparison with published ETS1 ChIP-seq analysis of CD4 T cells (14) revealed that nearly 60% of PLZF binding sites identified in NKT thymocytes overlapped with ETS1 peaks in CD4 T cells (Fig. 1 G and H). In contrast, only minor fractions of PLZF binding sites overlapped with published GATA3 (15) and EGR2 (16) ChIP-seq peaks in NKT cells. Similar findings were obtained by comparing the ChIP-seq profiles of Tg thy and NKT cells with a large database containing thousands of ChIP-seq data from a variety of cell types. In addition, >95% of shared PLZF binding sites were found to be DNase-accessible in CD4 T cells (Fig. 1G). These results suggest that rather than binding its own specific DNA motif, PLZF predominantly binds close to canonical transcription factors prominently expressed in lymphoid cells.
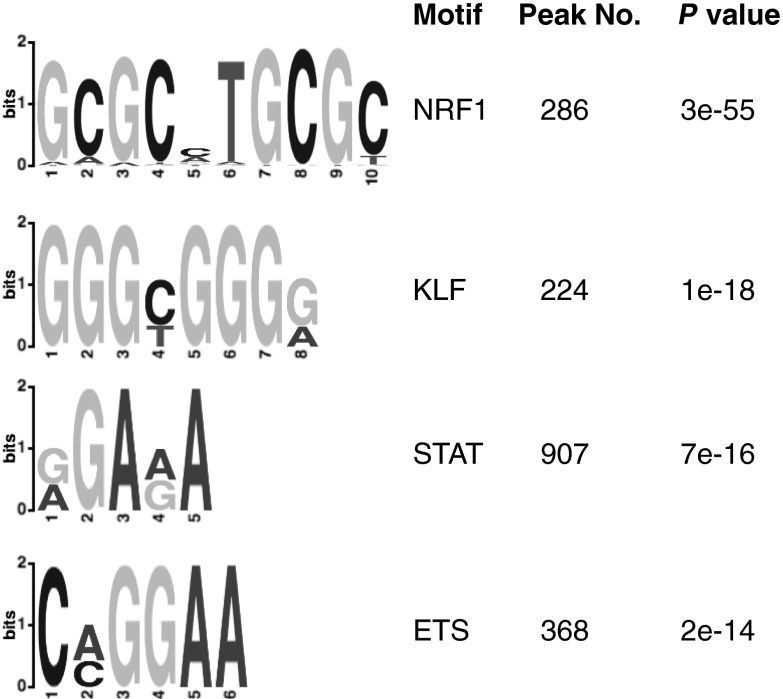
We also performed a ChIP-seq analysis of the human myeloid KG1a cell line (17), which naturally expresses PLZF and in which anti-PLZF antibodies efficiently pull down chromatin, to compare peaks across different cell types. Interestingly, the most strongly enriched consensus motif in the PLZF KG1a ChIP-seq peaks was for nuclear respiratory factor 1 (NRF1). This motif was not significantly enriched in NKT cells, indicating that PLZF likely binds different landscapes of regulatory elements in the two cell types (Fig. S2). A canonical ETS motif similar to the top consensus sequence in NKT cells was also found in KG1a, however, indicating overlap between the different cell types.
Fig. S2.
The top four motifs identified from PLZF ChIP-seq (using anti-PLZF antibody) in KG1a cells by MEME-ChIP. Peaks were called with the MACS program using a P value cut-off of 1e-5, with 2,126 peaks identified.
PLZF Binds a Broad Set of Immune Effector Genes Expressed by NKT Cells.
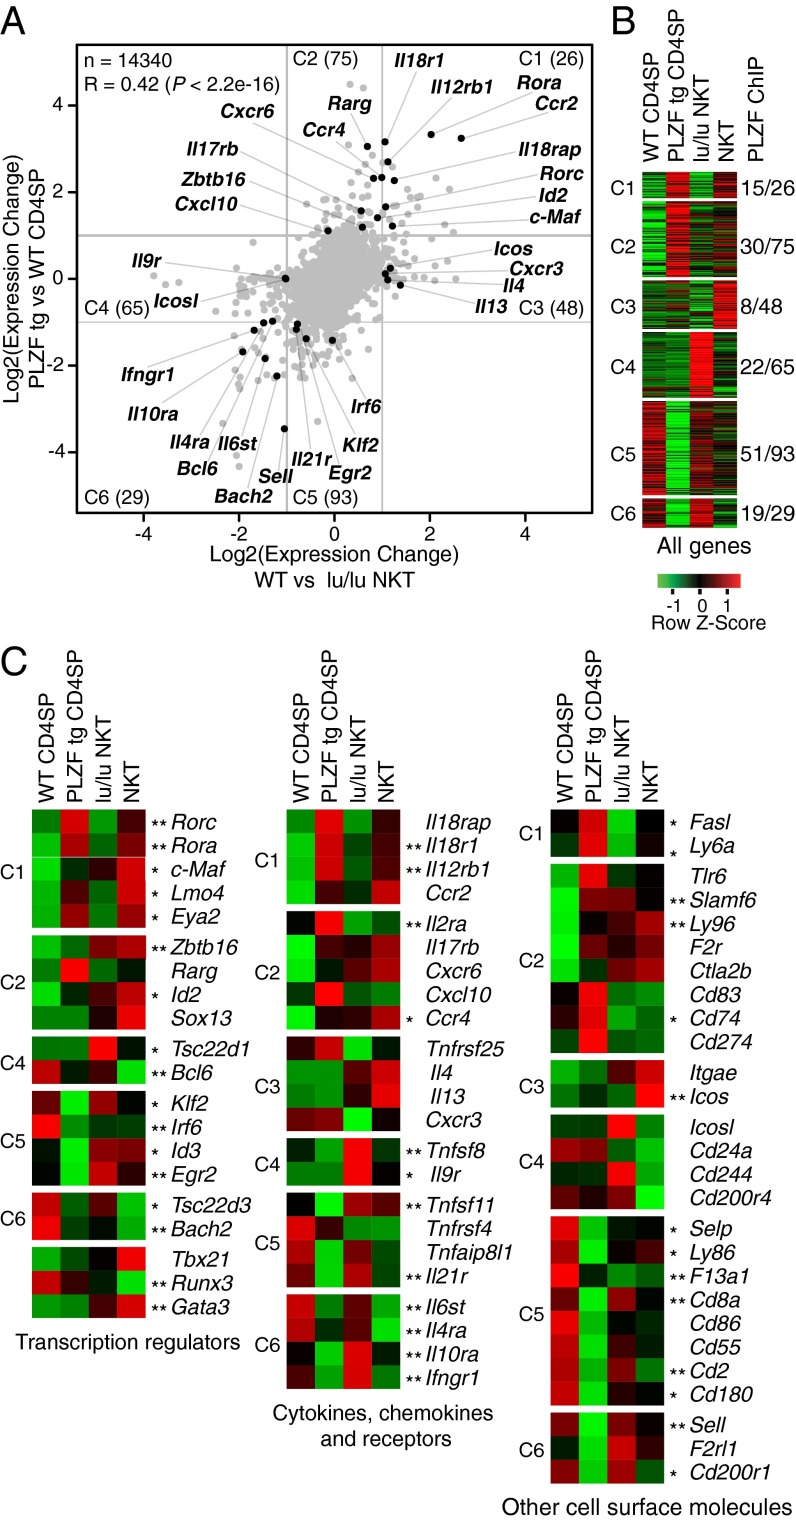
Although microarrays of Vα14-Jα18 NKT cells have been published and their functional program has been well described compared with that of CD4 T cells (13, 18, 19), the specific contribution of PLZF to the NKT cell transcriptional program has not yet been elucidated by gain-of-function and loss-of-function studies. Using microarray analysis, we compared Vα14-Jα18 stage 1 NKT thymocytes in WT and PLZF-deficient backgrounds (loss of function), as well as CD4 SP thymocytes in WT and PLZF-transgenic backgrounds (gain of function). At a twofold change cut-off, PLZF up-regulated or down-regulated a total of 336 genes distributed in regions C1–C6, as shown in the scatterplot in Fig. 2A. Thus, PLZF was required for 168 genes (in regions C1, C3, C4, and C6), sufficient for 223 genes (in C1, C2, C5, and C6), and necessary and sufficient for 55 genes (in C1 and C6). There was no example of discordant gene regulation by PLZF in NKT vs. PLZF Tg cells. Notably, similar frequencies of genes were up-regulated or down-regulated in the presence of PLZF. Of the 336 PLZF-regulated genes identified in C1–C6 and displayed in a heat map across the four T-cell populations (Fig. 2B), on average 43% were directly bound by PLZF, as determined by ChIP-seq analysis.
Fig. 2.
PLZF-regulated transcriptional program. (A) Scatterplot showing differentially expressed genes in the indicated cell type comparisons. Gray lines delineate the twofold change thresholds. Select immune genes are highlighted. Data are shown as mean values of two to three independent experiments. (B) Heatmap of all differentially expressed genes grouped according to indicated regions C1–C6 in the scatterplot with the corresponding number of genes bound by PLZF. Binding of a gene was defined by a peak (P = 1e-4) between 50-kb upstream of the TSS and 2 kb downstream of the TTS. Data are shown as mean values of two to three independent experiments. (C) Heatmap of select immune genes. Single and double asterisks denote genes bound by PLZF in either Tg thy or NKT thymocytes or in both, respectively. Data are shown as mean values of two to three independent experiments.
We isolated a group of 70 PLZF-regulated “immune” genes and broke them down by such categories as transcription regulators, cytokines/chemokines and their receptors, and other cell surface molecules (Fig. 2C). These immune genes were bound by PLZF, as denoted by asterisks in the figure, at frequencies ranging from 52% for surface receptors to 80% for transcription factors. Thus, PLZF directly binds a majority of PLZF-regulated immune effector genes, many of which have critical functions in the NKT cell effector program, as detailed below.
PLZF Binds and Controls Key Homing and Adhesion Receptor Genes.
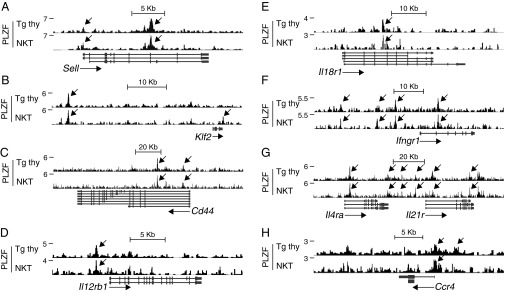
Among the key genes whose down-regulation characterizes the NKT cell effector program is Sell, which encodes CD62L and is required for recirculation to lymph nodes. PLZF directly bound this gene in both NKT cells and Tg thy (Fig. 3A). Furthermore, PLZF also bound and down-regulated the transcription factor Klf2, a major positive regulator of Sell (20, 21) (Fig. 3B). Another key direct target of PLZF, Cd44, encodes an adhesion receptor (Fig. 3C). Thus, PLZF directly regulates the CD44hiCD62Llo nonrecirculating effector phenotype of NKT cells.
Fig. 3.
PLZF directly binds genes encoding key surface receptors of the NKT effector program in NKT cells and Tg thy. Shown are PLZF ChIP-seq reads aligned at the Sell (A), Klf2 (B), Cd44 (C), Il12rb1 (D), Il18r1 (E), Ifngr1 (F), Il4ra and Il21r (G), and Ccr4 (H) loci. Peaks are indicated by arrows.
PLZF Binds and Controls Critical Cytokine Receptors and Chemokine Receptors.
A major function of NKT cells is to respond to cytokines, such as IL-12 and IL-18, produced by dendritic cells (DCs) by secreting abundant IFN-γ, even in the absence of exogenous antigen (22–25). PLZF directly bound and regulated Il12rb1 and Il18r1, as well as Ifngr1, in both NKT cells and Tg thy (Fig. 3 D–F). PLZF also bound and repressed Il21r (Fig. 3G). In addition, PLZF bound and activated Ccr4, which encodes a chemokine receptor that enables cell attraction toward CCL17-producing DCs and enhances the cross-presentation of antigen to CD8 T cells (Fig. 3H) (26). PLZF also bound and induced Icos, which can engage the ICOS ligand to activate DCs (Fig. 1H) (27).
PLZF Indirectly Controls Cytokine Secretion and T-Helper Function by Binding T-Helper–Specific Transcription Factors.
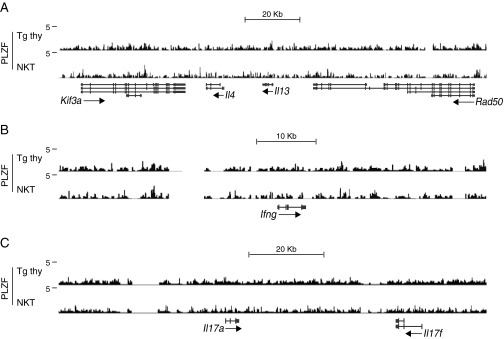
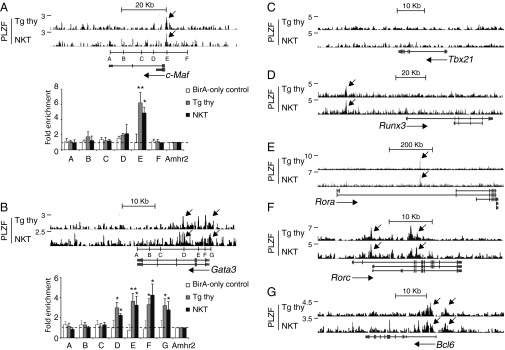
Although PLZF did not bind cytokine loci encoding IL-4, IL-13, IFN-γ, or IL-17 (Fig. S3), it did directly bind and/or activate multiple T-helper–specific transcription factors (Fig. 4). These factors included Gata3, c-Maf, Runx3, Rorc, and Rora, as was also confirmed by ChIP-quantitative PCR (qPCR) for Gata3 and c-Maf. Notably, there was no detectable binding to Tbx21, suggesting that its up-regulation in NKT cells may be mediated by another pathway, perhaps through Runx3, which was bound by PLZF. PLZF also directly bound and repressed Bcl6 (Fig. 4G), which controls T follicular helper (Tfh) cell function, perhaps explaining the relatively weak Tfh potential of NKT cells (28).
Fig. S3.
PLZF does not directly control NKT cytokine genes. Shown are PLZF ChIP-seq reads aligned to Il4 (A), Ifng (B), and Il17a and Il17f (C) gene loci.
Fig. 4.
PLZF directly binds genes encoding T-helper–specific transcription factors. Shown are PLZF ChIP-seq reads aligned at the c-Maf (A), Gata3 (B), Tbx21 (C), Runx3 (D), Rora (E), Rorc (F), and Bcl6 (G) loci. Peaks are indicated by arrows. ChIP-qPCR analysis of PLZF binding is also shown at indicated sites in c-Maf (A) and Gata3 (B) loci, with BirA-only control referring to thymocytes expressing BirA but not the biotin acceptor sequence. The fold enrichment is normalized relative to enrichment at the promoter region of reference gene Amhr2. Data are shown as mean ± SD of two to four independent experiments. *P < 0.05, **P < 0.01.
PLZF Binds and Represses Bach2, a Broad Suppressor of T-Helper Effector Genes.
One of the most profoundly repressed genes in both NKT cells and PLZF-transgenic T cells was Bach2 (Fig. 2), a transcription factor that is normally mostly expressed in naïve T cells and down-regulated in effector T cells. Bach2 has recently emerged as a broad, direct repressor of T-helper effector genes and is one of the genes most conspicuously associated with autoimmune diseases in multiple genome-wide association studies (29–31). We confirmed that Bach2 was down-regulated at the protein level in both NKT thymocytes and PLZF Tg CD4 SP thymocytes compared with WT CD4 SP thymocytes (Fig. 5A). Furthermore, PLZF showed extensive binding to multiple enhancer regions of Bach2 in the ChIP-seq analysis of both NKT thymocytes and PLZF-transgenic thymocytes, which was confirmed by ChIP-qPCR (Fig. 5B), supporting direct repression of Bach2 transcription by PLZF in NKT cells.
Fig. 5.
PLZF directly binds Bach2. (A) Immunoblot of lysates from indicated cell types with anti-Bach2, anti-PLZF, and anti-GAPDH. Ratios of Bach2 over GAPDH band density are indicated. Data are representative of two independent experiments. (B, Upper) PLZF ChIP-seq reads aligned at the Bach2 gene locus. Peaks are indicated by arrows. (Lower) For ChIP-qPCR analysis, the fold enrichment is normalized relative to enrichment at the promoter region of reference gene Amhr2. Data are shown as mean ± SD of two to four independent experiments. *P < 0.05, **P < 0.01.
Discussion
By combining ChIP-seq analysis with PLZF gain-of-function and loss-of-function studies, we have elucidated several molecular mechanisms that together explain how PLZF alone can direct the acquisition of a broad effector program during T-cell development. PLZF was found to bind and modulate several of the key genes involved in homing and migration, interaction with DCs, and responsiveness to cytokines and chemokines. Although PLZF did not seem to directly regulate cytokine genes, it did bind and broadly activate the T-helper–specific transcription factors c-Maf and Gata3, controlling Th2 cytokines, and Rorc and Rora, controlling Th17 cytokines; however, Tbx21 was not bound by PLZF, suggesting that its regulation is indirect. Finally, PLZF was a strong repressor of Bach2, which has been implicated in maintaining the resting state by broadly suppressing multiple T-helper effector genes (29, 31). Although ChIP-seq binding does not prove direct regulation, the systematic association of binding and regulation for many key genes of the NKT effector program is compelling evidence for direct regulation by PLZF. Taken together, these results explain how PLZF alone can function at different levels to recruit a broad effector gene program.
Although PLZF contains nine zinc fingers at its carboxy terminus, some of which have been proposed to bind DNA in a sequence-specific manner in myeloid cell types, ChIP-seq analyses have not been reported, and a consensus binding sequence has not emerged (32–36). Our study suggests the possibility that rather than binding a specific consensus motif, PLZF may occupy regulatory regions associated with other canonical lymphoid transcription factors, such as ETS, E protein, and RUNX. In support of this conclusion, the genetic disruption of each of these factors has been linked with NKT cell developmental defects (37–39); however, although PLZF is associated with various proteins, none of these transcription factors has been detected in these complexes (40). Thus, the link between PLZF and these transcription factors remains elusive.
PLZF also controls the differentiation of other innate-like T cells, including Vγ1.1-Vδ6 T cells and MR1 T cells (4, 8, 13, 41), as well as the development and function of ILCs (11), particularly ILC2s. Furthermore, the expression of canonical PLZF target genes, such as c-Maf, Icos, and Sell, is reportedly altered in the absence of PLZF in some of these populations, suggesting overlapping targets in these different lineages (11, 13).
In summary, our study elucidates how a single transcription factor can broadly control the T-helper effector program acquired by innate-like NKT cells during thymic differentiation, providing a sharp contrast with the cytokine-driven mechanisms underlying T-helper differentiation in conventional T cells.
Materials and Methods
Mice.
C57BL/6J (stock no. 000664) and C57BL/6-Zbtb16lu/J (Luxoid) mutant (stock no. 000100) mice were obtained from The Jackson Laboratory. The C57BL/6.Vα14-Jα18 transgenic (42) [C57BL/6-Tg (Cd4-TcraDN32D3)1Aben/J] (stock no. 14639) and the PLZF transgenic (4) [C57BL/6-Tg(Cd4-Zbtb16)1797Aben/J] (stock no. 14644) mice were maintained in our laboratory. The generation of A/F/PLZF-transgenic mice and their cross to the BirA-transgenic strain are described in SI Materials and Methods. All mice were raised in a specific pathogen-free environment at the University of Chicago, and all experiments were performed in accordance with the guidelines of the university’s Institutional Animal Care and Use Committee.
Flow Cytometry and MACS Enrichment.
CD1d-αGalCer tetramers were obtained from the National Institutes of Health’s tetramer facility. The following fluorochrome-labeled monoclonal antibodies were used: CD1d (1B1), CD3e (17A2), CD4 (L3T4), CD8α (53-6.7), CD24 (M1/69), CD25 (PC61), CD45.2 (104), CD44 (IM7), CD62L (MEL-14), NK1.1 (PK136), and TCRβ (H57-597). All antibodies were purchased from eBioscience, BD Biosciences, or BioLegend. PLZF antibody (sc-28319; Santa Cruz Biotechnology) was conjugated to Alexa Fluor 647 using an Invitrogen A-20186 labeling kit. For intracellular PLZF detection, cells were fixed and permeabilized using the eBioscience Foxp3 Staining Buffer Set.
For NKT cell MACS enrichment, cells were labeled with PE-conjugated CD1d-αGalCer tetramers, bound to anti-PE magnetic beads, and enriched on an autoMACS cell separator (Miltenyi Biotech). Samples were analyzed on an LSRII flow cytometer (BD Biosciences) or sorted on a FACSAria cell sorter (BD Biosciences), with doublet exclusion and DAPI staining of dead cells in most experiments. Data were analyzed with FlowJo (Tree Star).
Microarray Analysis.
RNA was extracted from FACS-sorted thymic CD4SP cells (CD4+CD8−TCRγδ−CD25−CD1d-αGalCer−) obtained from PLZF transgenic mice and littermate controls and stage 1 NKT cells (CD1d-αGalCer+CD24lowCD44−NK1.1−) obtained from WT and lu/lu Vα14-Jα18 tg mice using TRIzol (Thermo Fisher Scientific), followed by column purification using the RNeasy Mini Kit (Qiagen). RNA integrity was assessed using an Agilent 2100 Bioanalyzer; all samples used for hybridization had an RNA integrity number >9.3. Total RNA was used to synthesize cDNA, which was then fragmented and hybridized according to Affymetrix instructions at the University of Chicago’s Functional Genomics Facility. CD4SP samples were hybridized to GeneChip Mouse Exon 1.0 ST arrays (Affymetrix), and NKT samples were hybridized to GeneChip Mouse Genome 430 2.0 arrays (Affymetrix).
Arrays were scanned using a GeneChip Scanner 3000 (Affymetrix), and intensity values were generated by MicroArray Suite 5.0 software (Affymetrix). Microarray datasets were normalized using RMA, and differential expression was estimated using the Bioconductor package limma. When multiple probes were present for a given gene, their fold changes were averaged. Two or three biological replicates were analyzed for each cell type, and the average fold changes were used for comparison.
ChIP-seq and ChIP-qPCR.
For PLZF ChIP-seq in thymocytes, approximately 500 million thymocytes from A/F/PLZF tg/BirA tg mice were used. For PLZF ChIP-seq in NKT cells, approximately 100 million autoMACS-enriched NKT cells from A/F/PLZF tg/BirA tg/Vα14-Jα18 tg mice were used. For PLZF ChIP-seq in KG1a cells, approximately 20 million cells were used. Cells were fixed for 5 min at room temperature with 10% (vol/vol) formaldehyde. Glycine was then added to a final concentration of 0.125M to quench the reaction. Cells were washed twice with ice-cold PBS, lysed, and then sonicated to fragment DNA to 200–1,000 bp. The chromatin was then incubated overnight with magnetic streptavidin beads (14204; Invitrogen) or PLZF antibody (AF2944; R&D Systems). Precipitated ChIP and input DNA were washed, reverse cross-linked, and digested with proteinase K and RNase A. The DNA was then purified with phenol/chloroform exaction or a Qiagen reaction cleanup kit. ChIP was validated by qPCR for known targets before library preparation. For PLZF ChIP-seq, ChIP DNA was pooled from multiple batches of mice before deep sequencing of more than 100 million raw reads. Sequencing libraries were prepared with an Illumina ChIP-seq DNA Prep Kit and sequenced using Illumina Genome Analyzer IIx or Hiseq. The primers used for ChIP-qPCR are listed in Table S1.
Table S1.
Primers for ChIP-qPCR analyses
| Primer name | Primer sequence |
| Maf-A_F | TTGAGGGACAATTCCCATCC |
| Maf-A_R | CAAATTGCTGGGCAGTGAAG |
| Maf-B_F | GTTGCTGATATTCCATCAAGTGC |
| Maf-B_R | GCAGACTCTGTCATTTCCTTCC |
| Maf-C_F | TGTGGTGGCCTAAGAAAGTCAC |
| Maf-C_R | TGACTGATGAACAGCAGGTAGG |
| Maf-D_F | TCTAAAGCTGAGGACGGCTAAC |
| Maf-D_R | ACTCGGTGAGCTTAGACGTGAG |
| Maf-E_F | GCTGGGACAGGTTTGCTTAAC |
| Maf-E_R | CCCTGGTGCACTAAACTTCG |
| Maf-F_F | GCCTTTGAATGCAGCTTGTC |
| Maf-F_R | ACAAGCTGTTTGCTGCTCTCTC |
| Gata3-A_F | ACCATATTTGCTTTGGGATGC |
| Gata3-A_R | TATCAACGTGACGGCCAAG |
| Gata3-B_F | CCGCACAGAAGAAATCATCAC |
| Gata3-B_R | GCTTTGAGTAGTGGTGGTGAGC |
| Gata3-C_F | TTTGGAGCAGGACGGTCTAAG |
| Gata3-C_R | AGTCCTGGAATGGCAAGTCTG |
| Gata3-D_F | AAGAAACCTGGTCGGCAAAG |
| Gata3-D_R | TAGGCTCTGAGGTCTGGGAAG |
| Gata3-E_F | AACGCCAAGGGTTAAGGTTC |
| Gata3-E_R | GGGTTGTGTGCAGATTAGCAG |
| Gata3-F_F | GCAGACACGGAGGAATAAAGG |
| Gata3-F_R | AGGAATCAGTGTGCAGTGTGG |
| Gata3-G_F | CGTCCTTTGAGTCACTGCATC |
| Gata3-G_R | AAGTCTCTTTCGGACCTTGCTC |
| Bach2-A_F | TAAGCCACAGTCCACATGTACG |
| Bach2-A_R | ACCTCTTTCTCGAAACCCAGAG |
| Bach2-B_F | AAGGCAAGCCCTCTACTTCAAC |
| Bach2-B_R | GGCAGAAACATACCCACAAGTC |
| Bach2-C_F | GTTTCATTCCAGTGGGATTGG |
| Bach2-C_R | GCATTCTGCACCCTGATTTG |
| Bach2-D_F | CCAGCACAGCAACTAACACAAC |
| Bach2-D_R | CCTTTAAGCCACCATAGGCTTG |
| Bach2-E_F | GAAGCTTTCTCCAGGAAAGGAG |
| Bach2-E_R | CCTTATCGACAGAAACCAAGACC |
| Bach2-F_F | GAGCCCAAAGAAATCGATGC |
| Bach2-F_R | AGCTGTGAAGCTGGGCTAAAG |
| Bach2-G_F | GTACTTGCTGCAGTGTTTGGTG |
| Bach2-G_R | ACCTCCCACCCATATCCATAAC |
| Bach2-H_F | AAATTCTGGGTGTGGGAACC |
| Bach2-H_R | AGCGGGATGCTTCCTATATACC |
| Bach2-I_F | ACTGAAGCTCTGACCCTTGATG |
| Bach2-I_R | CAGCAATTTCCTGTGGCTTC |
| Bach2-J_F | GTTCAGGAGTTAGCGATGTTGG |
| Bach2-J_R | AACCAAAGTCTGTGCAACTGG |
| Bach2-K_F | CATTTGGCCACCATTTGC |
| Bach2-K_R | CATTTGGCTGGACTGCTTTC |
| Bach2-L_F | CGGGCTTCATAAGAATCTACGG |
| Bach2-L_R | TGTCTAGCTGCCTTTGTTGTTG |
| Bach2-M_F | AGCTCATGCTGCAAGGAAAG |
| Bach2-M_R | TGCGGGACCTAGGATTACATAG |
| Amhr2_F | ATTCTCTGCTCCTCCCTTTCTC |
| Amhr2_R | TCTGTCCTATCCCGGTCTCTG |
Analysis of ChIP-seq Reads.
ChIP-seq raw reads for transcription factors EGR2, GATA3, and ETS1 were downloaded from the National Center for Biotechnology Information’s Gene Expression Omnibus (GEO) database. For all mouse ChIP-seq experiments, the raw reads were aligned to the mm10 mouse genome using bowtie, allowing for two mismatches. For PLZF ChIP-seq in KG1a cells, the raw reads were aligned to the hg19 human genome. Only uniquely aligned reads were analyzed. Redundant reads due to PCR amplification were compressed to single reads. The total numbers of uniquely aligned PLZF ChIP-seq reads were 59 million in Tg thy cells, 38 million in NKT cells, and 9 million in KG1a cells. The ChIP-seq bedgraphs were generated using HOMER, with the total number of aligned reads normalized to 10 million. Input controls were used for peak calling to exclude peaks with a high input control signal.
Motif Analysis.
We extracted 200 bp centered on PLZF ChIP-seq peak summits and used it as input for MEME-ChIP (43), set to use the Vertebrate (in vivo and in silico) motifs. FIMO (44) was used to scan for occurrences of these motifs among all PLZF ChIP-seq peaks.
Statistical Analysis.
Two-tailed Student’s t tests were performed with R.
SI Materials and Methods
Generation of a Tagged PLZF Transgenic Strain.
For the generation of A/F/PLZF-transgenic mice, the A/F tag (ATGGGCCTGAACGACATCTTCGAGGCTCAGAAAATCGAATGGCACGAAGATTATAAAGATGACGATGACAAGGATTATAAAGATGACGATGACAAGGATTATAAAGATGACGATGACAAG) was added to N terminus of PLZF and cloned into a plasmid containing the minimal CD4 promoter and the intronic silencer (4). The linearized construct was injected into fertilized C57BL/6 oocytes, and the injected oocytes were implanted into foster mothers. Transgenic mice were screened with PCR (forward primer, 5′-TGTGCCAGGGTCGGAGACAATAACGG-3′; reverse primer, 5′-TCCTGGCTGTCCACCATGATGACCAC-3′). The BirA-transgenic mouse strain was obtained from M. Li (Memorial Sloan Kettering Cancer Center) and backcrossed to C57BL/6J for over five generations.
Immunoprecipitation and Western Blot Analysis.
Immunoprecipitation and Western blot analysis were performed as described previously (40). The following plasmids were used: pEF1a-BirA-V5his (a gift from K. Zhao, NIH, Bethesda), pCMV-HA-HDAC1 (a gift from J. Colgan, University of Iowa, Iowa City, IA), pcDNA3-Myc-CUL3 (a gift from Y. Xiong, University of North Carolina at Chapel Hill, Chapel Hill, NC), and pcDNA5-PLZF and pcDNA5-A/F/PLZF plasmids, constructed using standard molecular biology techniques. The following antibodies were used: anti-PLZF (AF2944; R&D Systems), anti-CUL3 (A301-109A; Bethyl Laboratories), anti-HDAC1 (ab-7028; Abcam), streptavidin-HRP (S2438; Sigma-Aldrich), anti–Flag-HRP (A8592; Sigma-Aldrich), anti-Bach2 (12809; CST), and anti-GAPDH (G9545; Sigma-Aldrich).
Acknowledgments
We thank A. Khan (University of Chicago) for helpful discussions and review of data. This work was supported by the National Institutes of Health Grants R01 AI038339, AI108643, and HL11892 (to A.B.) and the University of Chicago Digestive Diseases Research Core Center (Award P30 DK42086).
Footnotes
The authors declare no conflict of interest.
This article is a PNAS Direct Submission.
Data deposition: The ChIP-seq and microarray data reported in this paper have been deposited in the Gene Expression Omnibus (GEO) database, www.ncbi.nlm.nih.gov/geo (accession no. GSE81772).
This article contains supporting information online at www.pnas.org/lookup/suppl/doi:10.1073/pnas.1601504113/-/DCSupplemental.
References
- 1.Constantinides MG, Bendelac A. Transcriptional regulation of the NKT cell lineage. Curr Opin Immunol. 2013;25(2):161–167. doi: 10.1016/j.coi.2013.01.003. [DOI] [PMC free article] [PubMed] [Google Scholar]
- 2.Godfrey DI, Uldrich AP, McCluskey J, Rossjohn J, Moody DB. The burgeoning family of unconventional T cells. Nat Immunol. 2015;16(11):1114–1123. doi: 10.1038/ni.3298. [DOI] [PubMed] [Google Scholar]
- 3.Gapin L. Development of invariant natural killer T cells. Curr Opin Immunol. 2016;39:68–74. doi: 10.1016/j.coi.2016.01.001. [DOI] [PMC free article] [PubMed] [Google Scholar]
- 4.Savage AK, et al. The transcription factor PLZF directs the effector program of the NKT cell lineage. Immunity. 2008;29(3):391–403. doi: 10.1016/j.immuni.2008.07.011. [DOI] [PMC free article] [PubMed] [Google Scholar]
- 5.Thomas SY, et al. PLZF induces an intravascular surveillance program mediated by long-lived LFA-1–ICAM-1 interactions. J Exp Med. 2011;208(6):1179–1188. doi: 10.1084/jem.20102630. [DOI] [PMC free article] [PubMed] [Google Scholar]
- 6.Kovalovsky D, et al. The BTB-zinc finger transcriptional regulator PLZF controls the development of invariant natural killer T cell effector functions. Nat Immunol. 2008;9(9):1055–1064. doi: 10.1038/ni.1641. [DOI] [PMC free article] [PubMed] [Google Scholar]
- 7.Raberger J, et al. The transcriptional regulator PLZF induces the development of CD44 high memory phenotype T cells. Proc Natl Acad Sci USA. 2008;105(46):17919–17924. doi: 10.1073/pnas.0805733105. [DOI] [PMC free article] [PubMed] [Google Scholar]
- 8.Kreslavsky T, et al. TCR-inducible PLZF transcription factor required for innate phenotype of a subset of gammadelta T cells with restricted TCR diversity. Proc Natl Acad Sci USA. 2009;106(30):12453–12458. doi: 10.1073/pnas.0903895106. [DOI] [PMC free article] [PubMed] [Google Scholar]
- 9.Savage AK, Constantinides MG, Bendelac A. Promyelocytic leukemia zinc finger turns on the effector T cell program without requirement for agonist TCR signaling. J Immunol. 2011;186(10):5801–5806. doi: 10.4049/jimmunol.1100119. [DOI] [PMC free article] [PubMed] [Google Scholar]
- 10.Kovalovsky D, et al. PLZF induces the spontaneous acquisition of memory/effector functions in T cells independently of NKT cell-related signals. J Immunol. 2010;184(12):6746–6755. doi: 10.4049/jimmunol.1000776. [DOI] [PubMed] [Google Scholar]
- 11.Constantinides MG, McDonald BD, Verhoef PA, Bendelac A. A committed precursor to innate lymphoid cells. Nature. 2014;508(7496):397–401. doi: 10.1038/nature13047. [DOI] [PMC free article] [PubMed] [Google Scholar]
- 12.Verhoef PA, et al. Intrinsic functional defects of type 2 innate lymphoid cells impair innate allergic inflammation in promyelocytic leukemia zinc finger (PLZF)-deficient mice. J Allergy Clin Immunol. 2016;137(2):591–600.e1. doi: 10.1016/j.jaci.2015.07.050. [DOI] [PMC free article] [PubMed] [Google Scholar]
- 13.Gleimer M, von Boehmer H, Kreslavsky T. PLZF controls the expression of a limited number of genes essential for NKT cell function. Front Immunol. 2012;3:374. doi: 10.3389/fimmu.2012.00374. [DOI] [PMC free article] [PubMed] [Google Scholar]
- 14.Samstein RM, et al. Foxp3 exploits a pre-existent enhancer landscape for regulatory T cell lineage specification. Cell. 2012;151(1):153–166. doi: 10.1016/j.cell.2012.06.053. [DOI] [PMC free article] [PubMed] [Google Scholar]
- 15.Wei G, et al. Genome-wide analyses of transcription factor GATA3-mediated gene regulation in distinct T cell types. Immunity. 2011;35(2):299–311. doi: 10.1016/j.immuni.2011.08.007. [DOI] [PMC free article] [PubMed] [Google Scholar]
- 16.Seiler MP, et al. Elevated and sustained expression of the transcription factors Egr1 and Egr2 controls NKT lineage differentiation in response to TCR signaling. Nat Immunol. 2012;13(3):264–271. doi: 10.1038/ni.2230. [DOI] [PMC free article] [PubMed] [Google Scholar]
- 17.Furley AJ, et al. Divergent molecular phenotypes of KG1 and KG1a myeloid cell lines. Blood. 1986;68(5):1101–1107. [PubMed] [Google Scholar]
- 18.Cohen NR, et al. ImmGen Project Consortium Shared and distinct transcriptional programs underlie the hybrid nature of iNKT cells. Nat Immunol. 2013;14(1):90–99. doi: 10.1038/ni.2490. [DOI] [PMC free article] [PubMed] [Google Scholar]
- 19.Matsuda JL, et al. T-bet concomitantly controls migration, survival, and effector functions during the development of Valpha14i NKT cells. Blood. 2006;107(7):2797–2805. doi: 10.1182/blood-2005-08-3103. [DOI] [PMC free article] [PubMed] [Google Scholar]
- 20.Hart GT, Wang X, Hogquist KA, Jameson SC. Krüppel-like factor 2 (KLF2) regulates B-cell reactivity, subset differentiation, and trafficking molecule expression. Proc Natl Acad Sci USA. 2011;108(2):716–721. doi: 10.1073/pnas.1013168108. [DOI] [PMC free article] [PubMed] [Google Scholar]
- 21.Takada K, et al. Kruppel-like factor 2 is required for trafficking but not quiescence in postactivated T cells. J Immunol. 2011;186(2):775–783. doi: 10.4049/jimmunol.1000094. [DOI] [PMC free article] [PubMed] [Google Scholar]
- 22.Subleski JJ, et al. TCR-dependent and -independent activation underlie liver-specific regulation of NKT cells. J Immunol. 2011;186(2):838–847. doi: 10.4049/jimmunol.1001735. [DOI] [PMC free article] [PubMed] [Google Scholar]
- 23.Velázquez P, et al. Cutting edge: activation by innate cytokines or microbial antigens can cause arrest of natural killer T cell patrolling of liver sinusoids. J Immunol. 2008;180(4):2024–2028. doi: 10.4049/jimmunol.180.4.2024. [DOI] [PubMed] [Google Scholar]
- 24.Brigl M, Bry L, Kent SC, Gumperz JE, Brenner MB. Mechanism of CD1d-restricted natural killer T cell activation during microbial infection. Nat Immunol. 2003;4(12):1230–1237. doi: 10.1038/ni1002. [DOI] [PubMed] [Google Scholar]
- 25.Leite-De-Moraes MC, et al. IL-18 enhances IL-4 production by ligand-activated NKT lymphocytes: A pro-Th2 effect of IL-18 exerted through NKT cells. J Immunol. 2001;166(2):945–951. doi: 10.4049/jimmunol.166.2.945. [DOI] [PubMed] [Google Scholar]
- 26.Globisch T, et al. Cytokine-dependent regulation of dendritic cell differentiation in the splenic microenvironment. Eur J Immunol. 2014;44(2):500–510. doi: 10.1002/eji.201343820. [DOI] [PubMed] [Google Scholar]
- 27.Hedl M, Lahiri A, Ning K, Cho JH, Abraham C. Pattern recognition receptor signaling in human dendritic cells is enhanced by ICOS ligand and modulated by the Crohn’s disease ICOSLG risk allele. Immunity. 2014;40(5):734–746. doi: 10.1016/j.immuni.2014.04.011. [DOI] [PMC free article] [PubMed] [Google Scholar]
- 28.Bai L, et al. Natural killer T (NKT)–B-cell interactions promote prolonged antibody responses and long-term memory to pneumococcal capsular polysaccharides. Proc Natl Acad Sci USA. 2013;110(40):16097–16102. doi: 10.1073/pnas.1303218110. [DOI] [PMC free article] [PubMed] [Google Scholar]
- 29.Vahedi G, et al. Super-enhancers delineate disease-associated regulatory nodes in T cells. Nature. 2015;520(7548):558–562. doi: 10.1038/nature14154. [DOI] [PMC free article] [PubMed] [Google Scholar]
- 30.Roychoudhuri R, et al. BACH2 represses effector programs to stabilize T(reg)-mediated immune homeostasis. Nature. 2013;498(7455):506–510. doi: 10.1038/nature12199. [DOI] [PMC free article] [PubMed] [Google Scholar]
- 31.Tsukumo S, et al. Bach2 maintains T cells in a naive state by suppressing effector memory-related genes. Proc Natl Acad Sci USA. 2013;110(26):10735–10740. doi: 10.1073/pnas.1306691110. [DOI] [PMC free article] [PubMed] [Google Scholar]
- 32.Sitterlin D, Tiollais P, Transy C. The RAR alpha-PLZF chimera associated with acute promyelocytic leukemia has retained a sequence-specific DNA-binding domain. Oncogene. 1997;14(9):1067–1074. doi: 10.1038/sj.onc.1200916. [DOI] [PubMed] [Google Scholar]
- 33.Li JY, et al. Sequence-specific DNA binding and transcriptional regulation by the promyelocytic leukemia zinc finger protein. J Biol Chem. 1997;272(36):22447–22455. doi: 10.1074/jbc.272.36.22447. [DOI] [PubMed] [Google Scholar]
- 34.Doulatov S, et al. PLZF is a regulator of homeostatic and cytokine-induced myeloid development. Genes Dev. 2009;23(17):2076–2087. doi: 10.1101/gad.1788109. [DOI] [PMC free article] [PubMed] [Google Scholar]
- 35.Puszyk W, et al. The epigenetic regulator PLZF represses L1 retrotransposition in germ and progenitor cells. EMBO J. 2013;32(13):1941–1952. doi: 10.1038/emboj.2013.118. [DOI] [PMC free article] [PubMed] [Google Scholar]
- 36.Sadler AJ, et al. BTB-ZF transcriptional regulator PLZF modifies chromatin to restrain inflammatory signaling programs. Proc Natl Acad Sci USA. 2015;112(5):1535–1540. doi: 10.1073/pnas.1409728112. [DOI] [PMC free article] [PubMed] [Google Scholar]
- 37.Walunas TL, Wang B, Wang CR, Leiden JM. Cutting edge: The Ets1 transcription factor is required for the development of NK T cells in mice. J Immunol. 2000;164(6):2857–2860. doi: 10.4049/jimmunol.164.6.2857. [DOI] [PubMed] [Google Scholar]
- 38.D’Cruz LM, Stradner MH, Yang CY, Goldrath AW. E and Id proteins influence invariant NKT cell sublineage differentiation and proliferation. J Immunol. 2014;192(5):2227–2236. doi: 10.4049/jimmunol.1302904. [DOI] [PMC free article] [PubMed] [Google Scholar]
- 39.Egawa T, et al. Genetic evidence supporting selection of the Valpha14i NKT cell lineage from double-positive thymocyte precursors. Immunity. 2005;22(6):705–716. doi: 10.1016/j.immuni.2005.03.011. [DOI] [PubMed] [Google Scholar]
- 40.Mathew R, et al. BTB-ZF factors recruit the E3 ligase cullin 3 to regulate lymphoid effector programs. Nature. 2012;491(7425):618–621. doi: 10.1038/nature11548. [DOI] [PMC free article] [PubMed] [Google Scholar]
- 41.Alonzo ES, et al. Development of promyelocytic zinc finger and ThPOK-expressing innate gamma delta T cells is controlled by strength of TCR signaling and Id3. J Immunol. 2010;184(3):1268–1279. doi: 10.4049/jimmunol.0903218. [DOI] [PMC free article] [PubMed] [Google Scholar]
- 42.Griewank K, et al. Homotypic interactions mediated by Slamf1 and Slamf6 receptors control NKT cell lineage development. Immunity. 2007;27(5):751–762. doi: 10.1016/j.immuni.2007.08.020. [DOI] [PMC free article] [PubMed] [Google Scholar]
- 43.Machanick P, Bailey TL. MEME-ChIP: Motif analysis of large DNA datasets. Bioinformatics. 2011;27(12):1696–1697. doi: 10.1093/bioinformatics/btr189. [DOI] [PMC free article] [PubMed] [Google Scholar]
- 44.Grant CE, Bailey TL, Noble WS. FIMO: Scanning for occurrences of a given motif. Bioinformatics. 2011;27(7):1017–1018. doi: 10.1093/bioinformatics/btr064. [DOI] [PMC free article] [PubMed] [Google Scholar]


