Significance
Plant development is inextricably bound to the external light environment. Light drives photosynthetic carbon fixation and activates a suite of signal-transducing photoreceptors that regulate plant growth and development. This study highlights an important role for the phytochrome light receptors in synchronizing carbon resource allocation to daytime growth. We establish that phytochromes are major environmental drivers of plant biomass production and regulate the transition between growth-intensive and stress-resilient states.
Keywords: Arabidopsis thaliana, light, phytochrome, growth, sucrose
Abstract
Plants sense the light environment through an ensemble of photoreceptors. Members of the phytochrome class of light receptors are known to play a critical role in seedling establishment, and are among the best-characterized plant signaling components. Phytochromes also regulate adult plant growth; however, our knowledge of this process is rather fragmented. This study demonstrates that phytochrome controls carbon allocation and biomass production in the developing plant. Phytochrome mutants have a reduced CO2 uptake, yet overaccumulate daytime sucrose and starch. This finding suggests that even though carbon fixation is impeded, the available carbon resources are not fully used for growth during the day. Supporting this notion, phytochrome depletion alters the proportion of day:night growth. In addition, phytochrome loss leads to sizeable reductions in overall growth, dry weight, total protein levels, and the expression of CELLULOSE SYNTHASE-LIKE genes. Because cellulose and protein are major constituents of plant biomass, our data point to an important role for phytochrome in regulating these fundamental components of plant productivity. We show that phytochrome loss impacts core metabolism, leading to elevated levels of tricarboxylic acid cycle intermediates, amino acids, sugar derivatives, and notably the stress metabolites proline and raffinose. Furthermore, the already growth-retarded phytochrome mutants are less responsive to growth-inhibiting abiotic stresses and have elevated expression of stress marker genes. This coordinated response appears to divert resources from energetically costly biomass production to improve resilience. In nature, this strategy may be activated in phytochrome-disabling, vegetation-dense habitats to enhance survival in potentially resource-limiting conditions.
Plant life is completely dependent on light for photosynthesis; thus, it is paramount that growth and metabolism be adjusted to accommodate the variations in light and carbon resource availability that frequently occur in nature. Indeed, plants possess a multitude of light-sensing receptors; however, the role of these receptors in coordinating growth with carbon resources remains unknown (1).
Possibly the most well-characterized photoreceptors are the phytochromes, which regulate plant growth and development in response to changes in the external light environment (2). The model plant Arabidopsis has five phytochromes, designated phyA-phyE. These photoreceptors exert a strong influence through the entire life cycle, controlling numerous responses including germination, seedling establishment, the transition to photoautotrophic growth, adult plant architecture, and flowering time (2–6). Phytochromes act as light-regulated switches that toggle between Pr (inactive) and Pfr (active) isomeric forms (7). Red light activates phytochrome by photoconverting Pr to Pfr, whereas far-red light converts it back to Pr, switching it off. Phytochrome Pfr also undergoes nonphotochemical reversion back to Pr, a process commonly referred to as dark reversion. Once activated, phytochromes translocate to the nucleus, where they directly or indirectly regulate several transcription factors (8, 9). Phytochrome interacting factors (PIFs) were the first known direct targets and are the best-characterized of these targets to date (10). PIF1, PIF3, PIF4, and PIF5 preferentially interact with the Pfr form of phyB, an event that induces PIF proteolytic degradation, whereas phyA can interact with and degrade PIF1 and PIF3 (11). Interestingly, the phyB–PIF interaction also activates phyB degradation; thus, phyB-PIF operates as a dual feedback module (12, 13). In addition, phyB has been shown to control PIF1 and PIF3 activity by sequestering them from the promoters of target genes (14). Recently, mathematical models have been developed that consolidate this knowledge and provide a conceptual framework for understanding the photosensory and signaling properties of phyA and phyB (13, 15–17).
In Arabidopsis, the seedling hypocotyl (seedling stem) system has been used to great effect to elucidate the phytochrome signaling pathways. When Arabidopsis is grown in light, there is an inverse correlation between hypocotyl length and phytochrome activity, making hypocotyl elongation a simple, reliable assay for identifying and studying signaling components. It is in part due to the success of the seedling system that we do not more fully understand the role of phytochrome in the developing plant. Mutant analysis has identified phytochromes as important regulators of plant architecture and growth rate. Plants that lack phyB have altered leaf area and slower growth compared with wild type (WT) plants (6). These characteristics become more exaggerated in multiallele phytochrome mutants, such as phyABDE, that produces rosette leaves at ∼53% the rate of WT plants when grown at 16 °C (6). One possible explanation for this retarded growth comes from earlier work showing that multiallele mutant seedlings have substantial reductions in chlorophyll and, most likely, photosynthetic rate (18, 19).
Photosynthesis enables plants to fix carbon from CO2 to provide energy and building blocks for biomass accumulation during vegetative growth. The photosynthate sucrose is produced in leaves and transported to other tissues to support growth and development. During the day, a proportion of the assimilated carbon is converted to starch reserves, which are remobilized to support nighttime metabolism and growth. Disruption of this nocturnal carbon supply can cause starvation and cessation of growth (20–22). It is now widely accepted that sucrose is not simply a fuel for growth, but also an important signaling molecule that controls aspects of growth and development (23, 24). Interestingly, studies in the 1990s implicated sucrose in phytochrome signaling (25, 26). More recent work in etiolated seedlings has shown that CONSTITUTIVE PHOTOMORPHOGENESIS 1 (COP1) control of phyA abundance is sucrose-dependent (27), whereas PIFs have been implicated in sucrose-mediated hypocotyl elongation (28–30). These studies suggest that the phytochrome pathways connect with sucrose signaling at the seedling stage.
One of the most obvious characteristics of mutants that lack phyB or multiple phytochromes is retarded growth (6). We set out to establish the underlying causes by quantifying growth rate and biomass along with chlorophyll levels, CO2 assimilation rate, and sugar content in adult plants. Our findings show that phytochrome deficiency impacts carbon uptake, as well as the allocation of carbon resources to photoperiodic growth. We found that phytochromes also exert strong control on plant biomass production and metabolic state. Here we discuss the importance of these coordinated changes in enabling plants to thrive under differing light conditions.
Results
phyBD and phyABDE Mutants Fix Less CO2, yet Accumulate More Daytime Sucrose and Starch, than WT.
Previous studies have shown that phytochrome deficiency slows the pace of adult plant growth (6, 18, 19, 31). This situation could arise from reductions in carbon supply. For instance, seedling studies have shown that red light stimulates photosynthetic pigment production, while red light-grown phytochrome mutant seedlings have significantly lower chlorophyll levels (18, 19, 32). In keeping with these findings, inspection of microarray data from Michael et al. (33) revealed a clear reduction in the expression of photosynthesis and chlorophyll biosynthetic genes in phyB-9 seedlings compared with Col-0 WT seedlings (Fig. S1).
Fig. S1.
Photosynthesis and chlorophyll biosynthetic gene expression changes between phyB-9 seedlings and WT (Col0) seedlings using published array data (33), averaged across the diurnal cycle (4-h time point resolution) grouped by GO term. The box-and-whisker plot denotes the 5th, 25th, 50th, 75th, and 95th percentiles of the data, with points denoting outliers. The Wilcoxon rank-sum test was used to assess statistical significance of differences from the null distribution. ***P < 10−30.
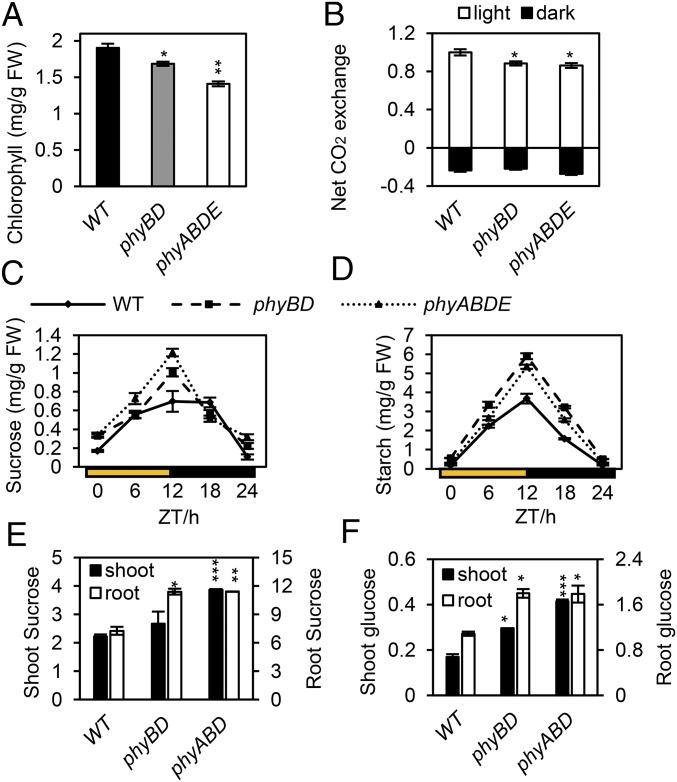
To test whether this deficit persisted beyond the seedling stage, we grew the plants for 2 wk in 100 µmol·m−2·s−1 white light, on a 8-h light (L):16-h dark (D) photoperiod, then for 4 wk on a 12-h L:12-h D photoperiod, with the temperature set to 18 °C to prevent early flowering of phytochrome mutants. Compared with Ler WT, we observed a sequential chlorophyll depletion in the phyB;phyD (phyBD hereinafter) mutant and in the severe phyABDE mutant that lacks four of the five phytochromes (Fig. 1A). However, the fold-change in our more mature, white light-grown phytochrome mutants was more subtle than that reported previously for red light-grown seedlings (18, 19). In keeping with our chlorophyll data, the CO2 exchange rate, commonly used to indicate photosynthetic carbon fixation, was also slightly reduced in the phyBD and phyABDE plants (Fig. 1B). In contrast, the rate of CO2 release in darkness (i.e., respiration) was similar in the WT and phytochrome mutant plants (Fig. 1B). Therefore, we expect that the continued impairment of photosynthesis in the developing plant is likely to impact vegetative growth.
Fig. 1.
CO2 uptake and carbon resource levels in Ler WT and phytochrome mutants. (A and B) Rosette leaf chlorophyll levels (mg/g FW) and net gas exchange rate (in light and dark) for WT, phyBD, and phyABDE. (C and D) Sucrose and starch quantification in plant rosettes through diurnal time course. (E and F) Soluble sugar (sucrose and glucose), quantified as milligram per gram FW, in shoot and root tissue at the end of light period. Plants were grown at 18 °C for 2 wk in an 8-h light/16-h dark white light cycle, then transferred to a 12-h light/12-h dark photoperiod cycle for another 3 wk (E and F) or 4 wk (A–D). Values are presented as mean ± SEM. Asterisks indicate a significant difference between values of the phytochrome mutants and WT. *P ≤ 0.05, **P ≤ 0.01, ***P ≤ 0.001, Student’s t test.
Photosynthetic carbon fixation generates organic sugars, including sucrose, the most abundant sugar for translocation and energy supply. A proportion of the carbon fixed during daytime is stored in rosette leaves as starch reserves, which are degraded (to sucrose) after photosynthesis ceases to sustain leaf respiration and night growth. Given that phytochrome mutants fix slightly less CO2 than WT, it follows that sucrose levels may be lower in these plants. However, our data show that phyBD and phyABDE mutants accumulate higher daytime sucrose and starch levels than WT plants (Fig. 1 C and D). Even though phyBD and phyABDE plants have more starch at dusk, starch levels are depleted to levels comparable with those in WT plants at the end of the night (Fig. 1D). Likewise, dusk sucrose levels in phyBD and phyABDE plants are significantly higher than in WT plants, but decrease to nearly WT levels through the night (Fig. 1C). These data imply that phytochrome plays an important role in carbon resource allocation, because phytochrome loss leads to sucrose and starch overaccumulation during the day and accelerated depletion at night.
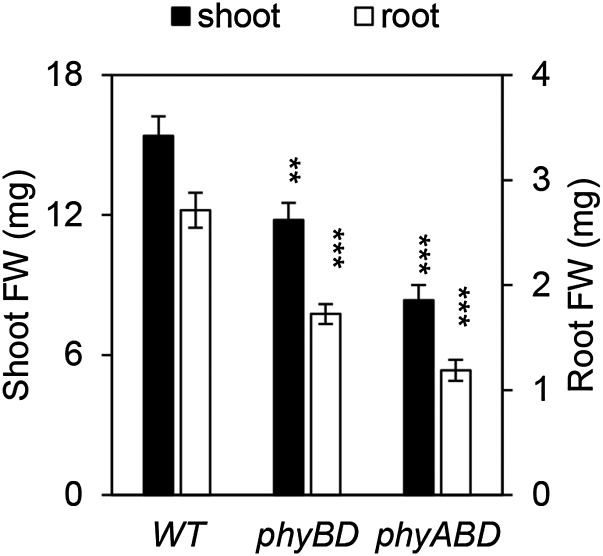
It has been suggested that phytochromes are needed for sucrose transport from cotyledon to root at the seedling stage (34). Thus, one possible reason for the high levels of sucrose in phytochrome mutant rosette leaves is impaired sucrose transport to the root. In this scenario, overall carbon levels would be lower than those in WT plants, but a higher proportion of carbon would be located in the shoot. However, our data show that phytochrome deficiency results in reduced shoot and root biomass (Fig. S2), but higher levels of metabolizible sugars in both shoot and root tissue (Fig. 1 E and F). In this experiment, a triple phyABD mutant was used instead of phyABDE, because adventitious roots emerge from the phyABDE hypocotyl, hindering separation of shoots and roots. Our data suggest that the increase in leaf sucrose levels observed in phytochrome-deficient plants does not arise from reduced shoot-to-root translocation.
Fig. S2.
Shoot and root FW in WT, phyBD, and phyABD plants. FW values are presented as mean ± SEM. Asterisks indicate a significant difference between values of mutants and WT. **P ≤ 0.01, ***P ≤ 0.001, Student’s t test.
phyBD Retarded Daytime Growth Relative to Nighttime Growth.
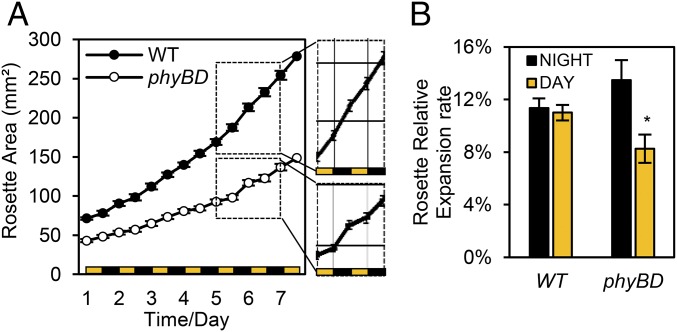
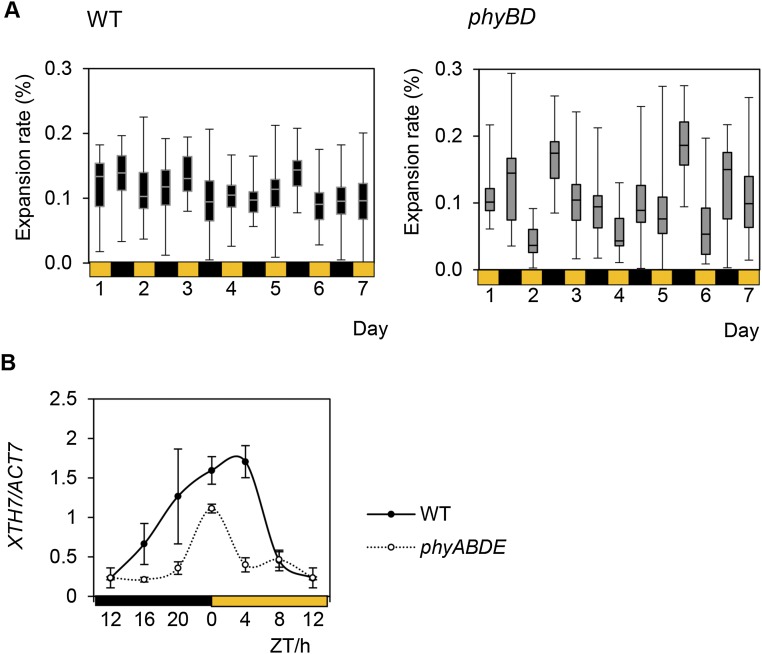
We have shown that even though phytochrome depletion reduces CO2 uptake, phyBD, phyABD, and phyABDE plants accumulate more daytime sucrose (Fig. 1 C and E). Therefore, we reasoned that phytochrome-deficient mutants may be less efficient at using their sugar to grow during the day. Conversely, the nearly complete nocturnal depletion of the abundant starch and sucrose pools suggests that phytochrome mutants may grow more at night (Fig. 1D). To test these hypotheses, we quantified end-of-day (EOD) and end-of-night (EON) rosette leaf blade expansion through seven consecutive diurnal cycles in WT and phyBD plants. During this time period, WT rosettes grew steadily, with comparable rates of leaf expansion during the day and night (Fig. 2). Matching our previously published data (6), phyBD plants grew at a slower rate than WT plants (Fig. 2A); however, day and night rosette expansion rates were more variable in the phyBD plants, with a tendency toward faster growth at night (Fig. 2B and Fig. S3A). These data indicate that loss of phyB and phyD severely impairs overall growth rate and disrupts the diurnal pattern of rosette expansion. The latter finding suggests that the altered daily sucrose and starch profiles in phytochrome mutants may result, at least in part, from diurnal shifts in the demand for growth.
Fig. 2.
phyBD has altered diurnal rosette expansion and retarded growth. (A) Quantification of WT and phyBD rosette leaf area during week 3–4 postgermination. (Insets) Diurnal differences in phyBD compared with WT. Measurements were taken at the end of each day and night. (B) Mean relative day and night expansion rates plotted for the experimental period. Values are presented as mean ± SEM. Asterisks indicate a significant difference between values of day and night growth rate in phyBD. *P ≤ 0.05, Student’s t test.
Fig. S3.
Growth assay of WT and phytochrome mutants. (A) Relative day and night rosette leaf expansion pattern of whole rosette in Ler WT and phyBD. Rosette area was quantified at dawn or dusk (in a 12-L:12-D cycle). The expansion rate for day vs. night was calculated by setting the starting area at dawn to 100, subtracting the area at dusk, and expressing the value as a percentage of the starting point. The box-and-whisker plot shows the minimum, first quartile, median, third quartile, and maximum of a set of data. (B) Diurnal expression profile of XTH7, determined by qRT-PCR, in 5-wk-old WT and phyABDE plants. Values are presented as mean ± SEM.
Phytochromes Are Major Regulators of Plant Biomass.
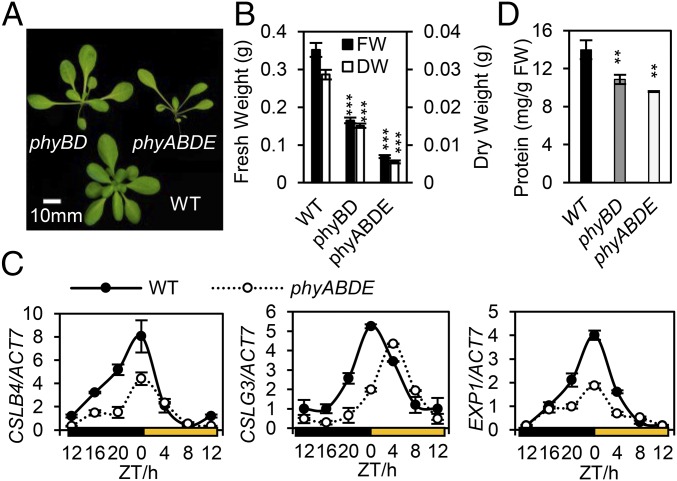
The severe growth defects seen in the phytochrome mutants led us to investigate whether they resulted from reductions in fresh weight (FW) or dry weight (DW) (6, 35). Loss of phytochrome resulted in sizeable reductions in both fresh and dry weight, which was extreme in the phyABDE mutant, which achieved only 20% of WT biomass (Fig. 3 A and B). Cell wall material constitutes the largest component of plant biomass, and indeed, in phyABDE plants we found significantly lower levels of key regulatory genes, including CELLULOSE SYNTHASE-LIKE genes CSLB4 and CSLG3, EXPANSIN 1 (EXP1), and XYLOGLUCAN ENDOTRANSGLUCOSYLASE/HYDROLASE 7 (XTH7). These genes control cell wall synthesis and reorganization and exhibit diurnal regulation, with a dawn peak of expression that is substantially suppressed in phyABDE (Fig. 3C and Fig. S3B). ChIP analysis has shown that PIF4 can bind to the EXP1 promoter, suggesting the possibility that these genes may be direct PIF targets (36).
Fig. 3.
Phytochrome deficiency strongly impacts plant biomass. (A) Image depicting the severe biomass phenotypes of 6-wk-old phyBD and phyABDE compared with Ler WT. (B) Fresh weight (FW) and dry weight (DW) of 6-wk-old WT and phytochrome mutants. (C) Diurnal expression profiles of cell wall-associated genes CSLB4, CSLG3, EXP1, and XTH7, determined by qRT-PCR, in 5-wk-old WT and phyABDE plants. (D) Total protein quantification in 2-wk-old phyBD, phyABDE, and WT plants. Values are presented as mean ± SEM. Asterisks indicate a significant difference between values of the phytochrome mutants and WT. **P ≤ 0.01, ***P ≤ 0.001, Student’s t test.
Like cell walls, protein is a major constituent of plant biomass, and so we wished to establish whether phytochrome mutants also regulate overall protein content. We observed a sequential reduction of total protein levels (per gram FW) in 2-wk old phyBD and phyABDE plants compared with WT plants (Fig. 3D). These data imply that the phytochrome mutant biomass deficit may arise, at least in part, from lower cell wall and protein production. These findings recast phytochromes as important environmental regulators of biomass in the developing plant. This appears to be accomplished by controlling carbon uptake and the major energy-fueled processes of protein synthesis and cell wall production.
Phytochrome Mutants Have an Altered Metabolic Profile.
The altered carbon status of phytochrome mutants prompted us to conduct GC-MS analyses to gain a broader view of how phytochromes impact primary metabolism. Using the GC-MS method adapted from the Fernie laboratory (37), we identified and quantified approximately 40 primary metabolites at EOD and EON in 5-wk-old WT, phyBD, phyABDE, and quintuple-mutant phyABCDE (lacking all five phytochromes) plants (Dataset S1).
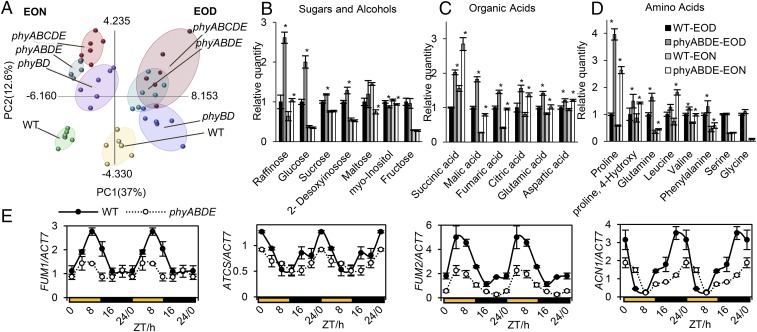
The principal component analysis (PCA) plot in Fig. 4A shows clear separations between samples based on genotype difference (PC2) and sampling time (PC1). This indicates that metabolic profiles differ between the phytochrome mutants and WT, and that there are distinctions between EOD and EON samples. There is significant overlap between the phyABDE and phyABCDE clusters, suggesting that these severe phytochrome loss-of-function genotypes have comparable metabolic states. This was expected, considering that these genotypes are phenotypically similar (19). Reassuringly, the phyBD sample clusters fall in between WT and these higher-order phytochrome mutants.
Fig. 4.
Metabolome analysis of WT and phytochrome mutants sampled at dawn (EON) and dusk (EOD). (A) Distribution of samples clustered using PCA. Sample replicates from each genotype were grouped in ellipses. (B–D) Quantification of sugars and alcohols (B), organic acids (C), and amino acids (D) in phyABDE and WT plants. Asterisks indicate a significant difference between values of the phyABDE and WT at EOD and EON. *P ≤ 0.05, Student’s t test. (E) Diurnal expression profiles (determined by qRT-PCR) of metabolic enzyme genes involved in TCA and related pathways (FUM1, FUM2, ATCS, ACN1) for WT and phyABDE plants, using double plotting for visualization purposes. Values are presented as mean ± SEM.
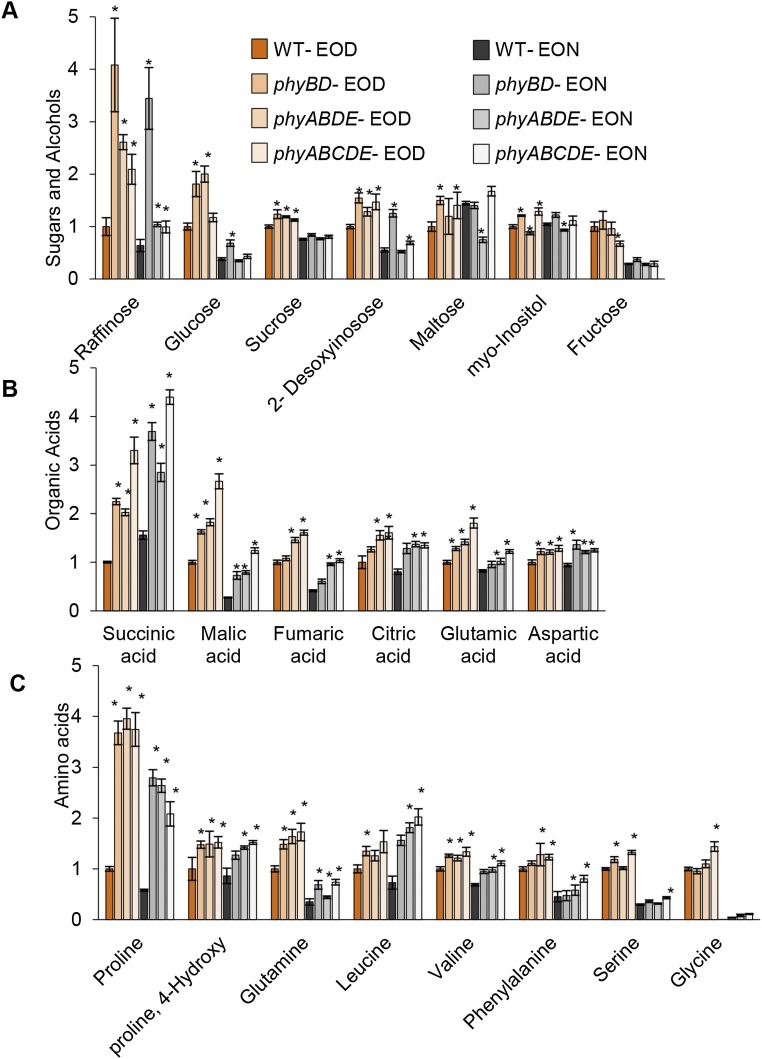
Consistent with our sugar quantification (Fig. 1 C, E, and F), compared with WT plants, the phyBD, phyABDE, and phyABCDE plants all had significantly elevated levels of metabolizible sugars, including glucose and sucrose, particularly at EOD (Fig. 4B and Fig. S4A). Interestingly, phytochrome depletion enhanced levels of the tricarboxylic acid (TCA) cycle organic acids (succinate, malate, fumarate, citrate, glutamate, and aspartate) and of specific amino acids (proline, 4-hydroxy-proline, glutamine, leucine, valine, phenylalanine, serine, and glycine) at both EOD and EON (Fig. 4 C and D and Fig. S4 B and C). For most of these metabolites, the loss of phyB and phyD appears to have the greatest impact. This type of metabolic profile in which TCA cycle intermediates, amino acids, and sugars overaccumulate may be an inevitable consequence of the retarded growth phenotype. Because phytochrome loss does not give rise to obvious differences in cellular respiration rate (Fig. 1B), a reduction in the demand for protein synthesis and/or cellulose production (Fig. 3 C and D and Fig. S3B) could lead to an accrual of intermediates and products of the metabolic supply pathways.
Fig. S4.
Metabolome analysis of WT, phyBD, phyABDE, and phyABCDE plants sampled at dawn (EON) and dusk (EOD). Quantification of sugars and alcohols (A), organic acids (B), and amino acids (C) is shown. Values are presented as mean ± SEM. Asterisks indicate a significant difference between values of the phytochrome mutants and WT at EOD and EON. *P ≤ 0.05, Student’s t test.
Given that phytochromes are important regulators of transcription, we tested the alternative hypothesis that elevated metabolite levels may result from underlying changes in gene expression. We found that despite its elevated levels of TCA intermediates, the phyABDE mutant exhibited lower-amplitude expression of TCA enzymes FUMARASE 1 (FUM1) and CITRATE SYNTHASE 4 (ATCS, or CSY4) (Fig. 4E). Furthermore, the glyoxylate enzyme ACETATE NON-USING 1 (ACN1) and cytosolic FUMARASE 2 (FUM2), which provide potential alternative sources of TCA metabolites, are also expressed at lower levels in phyABDE plants (Fig. 4E). This suggests that the observed changes in TCA metabolites did not simply arise from increased transcriptional activation of the pathway.
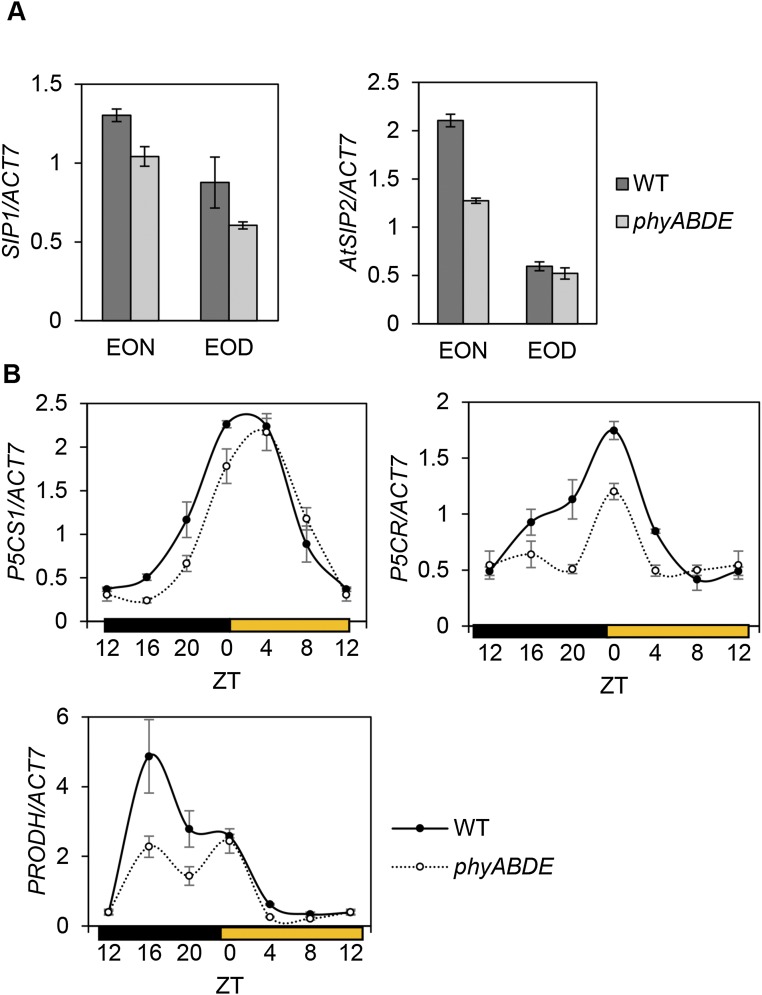
We also noted that phytochrome loss led to proportionally higher levels of proline and raffinose (Fig. 4 B and D and Fig. S4 A and C), which appear to be regulated primarily by phyB and/or phyD. This is particularly intriguing because these metabolites have been linked with stress responses (38–40). We again found that, as for the TCA cycle, the expression of several genes involved in proline (P5CS1 and P5CR) and raffinose (SIP1 and SIP2) biosynthesis were down-regulated in phyABDE plants (Fig. S5). On the other hand, the proline catabolic gene PRODH was also suppressed, whereas RAFFINOSE SYNTHASE 6/DARK INDUCED 10 (DIN10) expression was elevated in phyABDE plants, which may help boost the levels of proline and raffinose, respectively (Fig. 5D and Fig. S5B).
Fig. S5.
Expression of raffinose and proline regulatory gens in 5-wk-old WT, phyBD, and phyABDE plants. (A) Transcript levels of raffinose biosynthesis genes SIP1 and AtSIP2 (DIN10/RS6 shown in Fig. 5D) were determined by qRT-PCR at EOD and EON. (B) Diurnal expression profile of proline metabolic pathway genes P5CS1, P5CR, and PRODH. Values are presented as mean ± SEM.
Fig. 5.
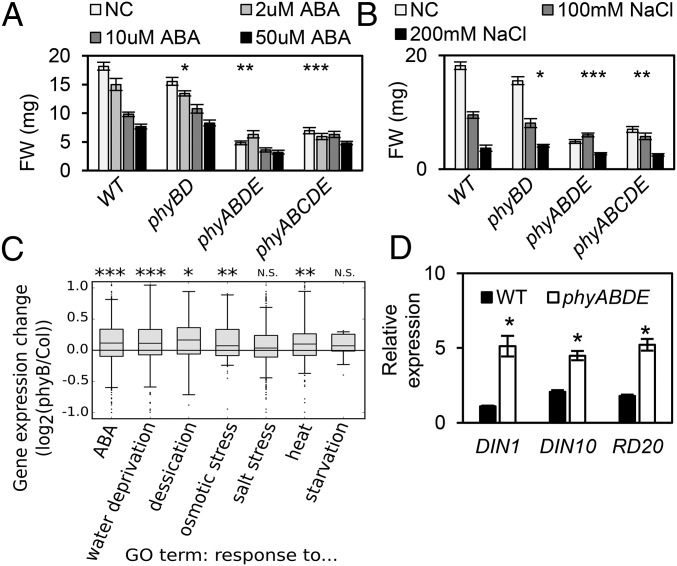
Abiotic stress tests and transcript analysis of stress response genes. (A and B) Quantification of ABA and salt stress on biomass of WT, phyBD, phyABDE, and phyABCDE plants. Here 11-d-old seedlings were transferred to medium with specific concentrations of salt/ABA for 10 d before FW data were collected. Asterisks indicate significant differences in the response to the maximal dose treatment for each genotype compared with the control (data log-transformed for analysis). *P ≤ 0.05, **P ≤ 0.01, ***P ≤ 0.001, two-way ANOVA. (C) Stress response gene expression changes between phyB-9 and WT (Col0) using published array data (33), averaged across the diurnal cycle (4-h time point resolution) grouped by Gene Ontology (GO) term. The box-and-whisker plot denotes the 5th, 25th, 50th, 75th, and 95th percentiles of the data, with points denoting outliers. The Wilcoxon rank-sum test was used to assess the statistical significance of differences from the null distribution. *P < 0.01, **P < 10−5, ***P < 10−10. (D) qRT-PCR of stress genes induced in 5-wk-old phyABDE plants compared with WT at peak time (ZT0 for DIN1 and DIN10; ZT4 for RD20) relative to ACT7 level. Values are presented as mean ± SEM. Asterisks indicate a significant difference between values of stress-treated plants and controls of each genotype. *P ≤ 0.05, Student’s t test.
Collectively, our data show that phytochrome loss alters CO2 uptake (Fig. 1) and the plant metabolic profile, increasing the abundance of organic acids, amino acids, sugars, and stress indicators such as proline and raffinose. These changes appear to result not from an elevated expression of metabolic pathway genes, but rather from a reduced need for carbon- and nitrogen-fueled growth. This finding highlights a hitherto unknown role for phytochrome in controlling the supply and demand of resources for growth.
Stress Response Is Altered and Stress-Marker Genes Are Induced in Phytochrome Mutants.
Numerous studies have shown that increased proline and raffinose levels can be induced in abiotic stress conditions, such as abscisic acid (ABA) and salinity (38–42). This is thought to enhance plant tolerance to stress, at least partly through osmotic adjustment and by providing an energy supply for resumption of growth once stress is removed. Because phytochrome mutants have enhanced levels of proline and raffinose, we reasoned that phytochrome-deficient plants may be more primed for possible future stress scenarios.
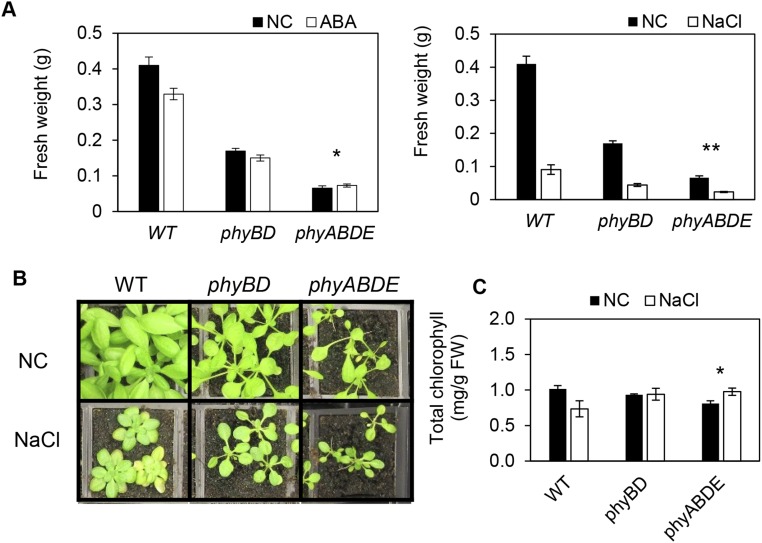
The application of ABA or salt stress is known to restrict growth, enabling the plant to deploy resources to withstand stress (43, 44). This property raises the possibility that the retarded growth phenotype and associated metabolic changes in phytochrome mutants may provide some degree of protection from stress. This scenario predicts that the phytochrome mutant reduced-biomass phenotype will be accompanied by an altered sensitivity to stress treatment. Our data concur with this prediction (Fig. 5 A and B and Fig. S6). Although we found dose-dependent growth inhibition by ABA and NaCl in WT seedlings, this was sequentially reduced in the phyBD, phyABDE, and phyABCDE seedlings (Fig. 5 A and B). Similar results were obtained for adult plants exposed to ABA and NaCl (Fig. S6A). In line with a previous study, we found that NaCl application depletes chlorophyll levels, but this response was also perturbed in phyABDE plants (Fig. S6 B and C) (45).
Fig. S6.
Abiotic stress responses in adult plants. (A) Quantification of ABA and NaCl stress repression of biomass in adult plants. Here 4-wk-old plants were watered once with 100 μM ABA or 350 mM NaCl, after which normal watering resumed. Plant tissue was harvested 2 wk later. (B) WT and phytochrome mutant plants at 2 wk after NaCl application. (C) Chlorophyll levels in plants exposed to the NaCl stress test (as in A and B). Values are presented as mean ± SEM. Asterisks indicate significant differences in the response to ABA/salt treatment for each genotype compared with the control, as assessed by two-way ANOVA (FW data log-transformed for analysis). *P ≤ 0.05, **P ≤ 0.01.
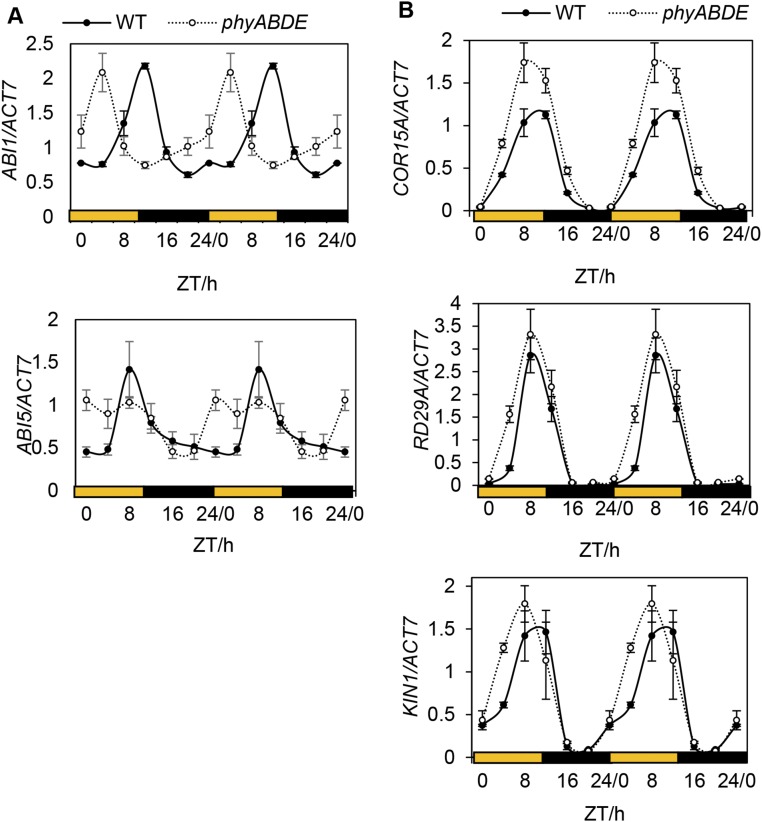
Interestingly, an analysis of previously published array data (33) indicates that phyB-9 seedlings exhibit a mild but global up-regulation of stress response genes compared with Col-0 WT plants (Fig. 5C). This difference may be expected to be more severe in higher-order phytochrome mutants. In adult plants, we observed a change in waveform in ABA signaling genes ABI1 and ABI5 that resulted in their elevated daytime expression in phyABDE relative to WT plants (Fig. S7A). For the stress genes DARK INDUCIBLE 1 (DIN1), DIN10, and RESPONSIVE TO DESICCATION 20 (RD20), we detected an increase in peak expression in phyABDE plants, with DINs peaking at Zeitgeber time (ZT) 0 and RD20 at ZT4 in both genotypes. In comparison, transcript levels of COLD-REGULATED 15A (COR15A), RD29A, and KIN1 (At5g15960), genes that peak at dusk, showed more subtle up-regulation in phyABDE compared with WT plants, but this was sustained through the rising phase (Fig. S7B).
Fig. S7.
qRT-PCR analysis of stress-related genes in phyABDE and WT plants. (A) ABA signaling pathway genes (ABI1 and ABI5) in 5-wk-old WT and phyABDE mutant plants through a diurnal time course. (B) Diurnal gene expression of stress marker genes peaking later in the day (COR15A, RD29A, and KIN1) in WT and phyABDE plants. Data are double plotted for visualization purposes. Values are presented as mean ± SEM.
In summary, our data demonstrate that the already growth-retarded phytochrome mutants are less sensitive to growth-restricting stresses, have elevated proline and raffinose levels, and exhibit a mainly mild but extensive up-regulation of stress genes in control (i.e., stress-free) conditions. These combined traits may conspire to improve plant resilience when phytochromes are inactivated. The experimental conditions in our experiment, which was run at 18 °C, were comparable to those of an earlier study (at 16 °C) that showed that phytochrome deactivation prepares plants to withstand freezing temperatures by up-regulating the C-repeat binding factor regulon and stress genes (46). Our data are compatible with that finding, and suggest that phytochromes have a dual role in coordinating stress physiology and growth.
Discussion
Because of the expediency of the Arabidopsis seedling hypocotyl system, we now have detailed knowledge of how phytochromes mediate the transition to photoautotrophic growth (47, 48). However, previous reports have shown that phytochromes also exert a strong influence on growth as the plant matures (6). This study moves beyond the prevailing view of light signal transduction to demonstrate that phytochromes control carbon supply, resource utility, and, most likely, metabolic flux.
In nature, plants commonly experience conditions, such as shading from nearby plants, that inactivate the phytochrome light receptors. We have shown that phytochrome depletion can have a profound impact on plant growth and biomass (Fig. 3 A and B). Cellulose and protein are major constituents of plant biomass; indeed, 30–50% of typical plant biomass consists of cellulose (49). We have shown that the expression of genes that control cell wall synthesis and reorganization is compromised and total protein levels are reduced in phytochrome mutants (Fig. 3 C and D and Fig. S3A). These findings point to a novel role for phytochrome in regulating these major components of plant biomass.
Our data show that despite having moderately reduced chlorophyll and photosynthetic CO2 uptake, phyBD and phyABDE plants accumulate higher daytime sucrose and starch carbon reserves than WT plants and mobilize these resources faster at night (Fig. 1). In keeping with this result, although phytochrome mutants generally have compromised growth, they have a tendency to grow more during the night than in the daytime (Fig. 2). These results highlight a hitherto unknown function of phytochrome in coupling carbon resource availability to diurnal growth.
By probing the metabolome of the phytochrome multimutant series using GC-MS, we have shown that phytochrome loss disrupts core metabolism. Phytochrome depletion leads to the accumulation of several sugar derivatives during the daytime, whereas TCA components and amino acids are constitutively elevated (Fig. 4 and Fig. S4). Our results broadly concur with a study in rice showing a comparable profile in young leaves of phyABC mutants (50). We have demonstrated that the metabolite excess phenotype does not simply arise from enhanced transcriptional activation of biosynthesis genes, but instead, phytochrome loss curtails the expression of several metabolic genes, which may signify feedback regulation.
We found that the phytochrome-deficient metabolite profile had substantial degrees of overlap with the profiles observed in ABA-treated and NaCl-treated plants (41, 42) (Fig. 4 and Fig. S4). In particular, phytochrome depletion leads to markedly enhanced levels of proline and raffinose, two key indicators of stress (40). Interestingly, the application of ABA or NaCl is known to restrict growth to allow a redeployment of resources for stress relief. Our present findings show that the growth-compromised phytochrome mutants are less sensitive to ABA and salt inhibition of growth, and have elevated levels of stress genes in the absence of applied stress (Fig. 5 and Figs. S6 and S7). This illustrates that phytochrome status impacts stress physiology, in agreement with an earlier report showing that phytochrome depletion enhances freezing tolerance (46). The ability of phytochrome mutants to withstand stress appears to be influenced by such factors as temperature, given that phytochrome-dependent cold acclimation gene expression requires cooler ambient temperatures. Likewise, inactivation of phytochrome by low red:far-red light has been shown to elevate levels of soluble sugars and glycine at 16 °C, but not at 22 °C (51).
In summary, the present study supports a more holistic view of phytochromes as important regulators of carbon supply, biomass production, and metabolic status. We provide evidence that phytochromes play an important role in partitioning carbon metabolism to growth, revealing a broader role for phytochromes in controlling the switch between stress physiology and growth than previously envisioned. This strategy could be valuable in vegetation-dense, far-red light-rich conditions that are common in nature. The inactivation of phytochrome by far-red light could redirect resources to cope with a more stress-inducing environment, where competition of light is intensified and resources can become limiting.
Materials and Methods
Information on plant materials and growth conditions, along with detailed quantification procedures for biomass, chlorophyll, gas exchange rate, starch and sucrose, rosette expansion rate, and total protein concentration, can be found in SI Materials and Methods. Quantitative RT-PCR (qRT-PCR), GC-MS, and principal component analysis are also described in SI Materials and Methods. The primers used in this study are listed in Table S1.
Table S1.
Primers used for qPCR
| Gene | Locus | Primer | Sequence (5′-3′) |
| ACT7 | AT5G09810 | ACT7-F | CAGTGTCTGGATCGGAGGAT |
| ACT7-R | TGAACAATCGATGGACCTGA | ||
| CSLB4 | AT2G32540 | CSLB4-F | ACGATTTAGGAGACGATGGA |
| CSLB4-R | ACCATCTCCTTAGAATTCCCA | ||
| CSLG3 | AT4G23990 | CSLG3-F | TAATACCTTGCTACGAGTGTCTG |
| CSLG3-R | CTGGATCGTTGGAATACATATCAC | ||
| EXP1 | AT1G69530 | EXP1-F | CAACGCATCGCTCAATACAG |
| EXP1-R | AAACCTTATTCCTCCTCTTCTCAC | ||
| XTH7 | AT4G37800 | XTH7-F | GATTTCCACGAATATGCCATCTC |
| XTH7-R | CCTCATTGTTCTTGTAAACCCTG | ||
| FUM1 | AT2G47510 | FUM1-F | GTCACTTAACACAATCGCCAC |
| FUM1-R | TAGTACAAGTTCACCAAGACCAC | ||
| ATCS(CSY4) | AT2G44350 | CSY4-F | TGAGTGCCAGAAAGTATTACCT |
| CSY4-R | TACCTTTCCAGTTAAGAGAAGCC | ||
| FUM2 | AT5G50950 | FUM2-F | AGAAATGTGCTGCCAAGGT |
| FUM2-R | CTTTCCTTCTGCTACTTCTTGTG | ||
| ACN1 | AT3G16910 | ACN1-F | GGTTGGTGTTTCCCTTGGT |
| ACN1-R | GAATACACTTCCTTCGCCGT | ||
| P5CS1 | AT2G39800 | P5CS1-F | CTATTAGCACCCGAAGAGCC |
| P5CS1-R | CAGTTCCAACGCCAGTAGAG | ||
| P5CR | AT5G14800 | P5CR-F | CAATGTCTTCTCCACTAGCGA |
| P5CR-R | ACAGCCTTCTTAACAACTTGAG | ||
| PRODH | AT3G30775 | PRODH-F | CTGCCAAATCTTTACCAACATCTC |
| PRODH-R | AGATCGCTCACTCGTTTCAG | ||
| ABI1 | AT4G26080 | ABI1-F | AAACTGCACTTCCATTATCCGT |
| ABI1-R | ACTGAATCACTTTCCCTCCTG | ||
| ABI5 | AT2G36270 | ABI5-F | CAGAACAATGCTCAGAACGG |
| ABI5-R | CACCAAGAAATCCTCAAGTGTC | ||
| DIN1 | AT4G35770 | DIN1-F | GAGGACACCAGACGAATTCAG |
| DIN1-R | GTTCTTAACCATTCCTGATCCGA | ||
| DIN10 | AT5G20250 | DIN10-F | ATGGATCGATTCTTCGTGCTC |
| DIN10-R | TATCTTTAGCAAGCTGACACCA | ||
| COR15A | AT2G42540 | COR15A-F | AAAGAGGCATTAGCAGATGG |
| COR15A-R | TTCTTTACCCAATGTATCTGCG | ||
| RD29A | AT5G52310 | RD29A-F | ATCCCACCAAAGAAGAAACTG |
| RD29A-R | TCAGGAGACTCATCAGTCAC | ||
| KIN1 | AT5G15960 | KIN1-F | ACCAACAAGAATGCCTTCCA |
| KIN1-R | CCGCATCCGATACACTCTTT |
SI Materials and Methods
Plant Material, Growth Conditions, and Treatments.
Landsberg erecta (Ler) and Ler background phyBD (52), phyABD (52), phyABDE (53), and phyABCDE (19) were used in this study. For all experiments, seeds were surface-sterilized with 8% (vol/vol) bleach and 1% Tween, washed four times with distilled water, and then sown on 1/2 MS-1.2% (wt/vol) agar medium and stratified in darkness for 3 d at 4 °C. Plates were moved to growth cabinets under a 8-h light (L):16-h dark (D) photoperiod at 18 °C for germination and early seedling development. Subsequently, 2-wk-old seedlings were transferred to soil and maintained at 18 °C with a 12-L:12-D photoperiod using a light level of 100 μmol·m−2·s−1.
Fresh and Dry Biomass Quantification.
Leaf rosettes were harvested from 6-wk-old plants and weighed immediately (before dehydration) using a precision balance. The plant materials were then dried at 80 °C for 4 d to obtain dry biomass.
Measurement of Chlorophyll Content.
Plants were harvested in liquid nitrogen (LN) and ground into fine powder. Approximately 20 mg of sample powder was weighed, mixed with 1 mL of cool 80% (vol/vol) acetone, and kept in the dark at 4 °C overnight. After centrifuging, supernatant was used to measure OD at 645 nm and 663 nm with a spectrometer. Chlorophyll content was calculated using the following equation: Chlorophyll (mg/g) = (8.02 × OD663 + 20.20 × OD645) × V/FW, where V is the volume of the extract (in milliliters) and FW is the fresh weight of the sample powder (in milligrams) (54).
Gas Exchange Measurement.
These measurements were obtained using a customized chamber connected to the EGM-4 environmental gas analyzer (PP Systems) with two butyl tubes for closed-loop measurements. Each individual measurement was obtained by placing a pot of plants inside the chamber for ∼60 s, during which the EGM-4 analyzer recorded CO2 concentration every 4.6 s. CO2 exchange was measured in parts per million. Flux was calculated per unit area (in square meters), and results are expressed relative to WT in light.
Quantification of Starch and Sugars.
Plant rosettes and roots were harvested into LN and finely ground, and 20 mg of powder was weighed. Soluble sugars were extracted in ethanol and measured using an enzymatic assay; starch was determined using the pellet from ethanol extraction. The procedure has been described in detail previously (55).
Rosette Expansion Assay.
Plants were grown in soil trays, and images were taken from the top using a digital camera within 30 min after dawn (9:00 AM) or before dusk (9:00 PM). Photos were processed in Adobe Photoshop to achieve optimal contrast between plant tissue and soil background. The rosette area per plant was measured using ImageJ. The percent expansion rate for day and night was calculated by setting the starting area at 100 (e.g., 9:00 AM) and subtracting the area at the end point (e.g., at 9:00 PM), and expressed as a percentage of the value of the starting point.
Gene Expression Analysis.
For qRT-PCR experiments, plants were harvested into LN and ground into fine powder. RNA was extracted using the RNeasy Plant Mini Kit (Qiagen) with on-column DNase digestion. cDNA synthesis was performed using the SuperScript VILO cDNA Synthesis Kit (Invitrogen) as described by the manufacturer. The qRT-PCR was set up as a 10-μL reaction using SYBR Green (Roche) in a 384-well plate, performed with a Lightcycler 480 system (Roche). Results were analyzed using the LightCycler 480 software. The primers used in this study are listed in Table S1.
Protein Determination.
Plant tissue was harvested and ground into fine powder in LN, and protein was extracted using homogenization buffer [0.0625M Tris⋅HCl pH 6.8, 1% (wt/vol) SDS, 10% (vol/vol) glycerol, and 0.01% (vol/vol) 2-mercaptoethanol]. Samples were incubated at 65 °C for 10 min before centrifuging at the highest speed for 10 min. Supernatant was collected into a new tube, and protein was quantified using Pierce BCA kit according to the manufacturer’s instructions.
GC-MS Metabolomics Assay.
WT and phytochrome mutants were grown to 5 wk in conditions described above. Between three and five rosettes were pooled together as one sample; six sample replicates were analyzed using GC-MS for each genotype at dawn or dusk. The same amount of ribitol was added just before the extraction as an internal standard for relative quantification. A series of alkanes (C7–C30) were added into each sample before measurement to obtain a retention index. Tissue extraction, derivatization, and sample measurement equipment settings were adapted from Lisec et al. (37). AMDIS (Automated Mass Spectral Deconvolution and Identification System) and NIST (National Institute of Standards and Technology) software, along with GMD (GOLM metabolome database) mass spectrum reference libraries, were used for peak detection and metabolite identification. The R package “Metab” (56) was used for peak quantification and further normalization analysis. Detailed results are presented in Dataset S1.
PCA.
PCA was performed using the Multibase Excel add-in (NumericalDynamics).
Supplementary Material
Acknowledgments
We thank Dr. Kerry Franklin (University of Bristol) for generously providing the phyABCDE mutant seed, and the laboratory of Professor Mark Stitt (Max Planck Institute) for kindly providing the starch and sucrose quantification protocol. The GC-MS study was completed at the University of Glasgow with assistance from Environmental Geochemistry Technician Henry Jackson and the laboratory of Professor John Christie. D.Y. is supported by a University of Edinburgh Darwin Trust Scholarship. D.D.S. is supported by Biotechnology and Biological Sciences Research Council (BBSRC)-National Science Foundation Grant BB/M025551/1 (awarded to K.J.H.). J.K. is funded by 14 ERA-CAPS PHYTOCAL Grant BB/N005147/1 (awarded to K.J.H.). This project was also supported by the BBSRC-funded ROBuST Grant BB/F005237/1 (to K.J.H.).
Footnotes
The authors declare no conflict of interest.
This article is a PNAS Direct Submission.
See Commentary on page 7301.
This article contains supporting information online at www.pnas.org/lookup/suppl/doi:10.1073/pnas.1601309113/-/DCSupplemental.
References
- 1.Briggs WR, Olney MA. Photoreceptors in plant photomorphogenesis to date: Five phytochromes, two cryptochromes, one phototropin, and one superchrome. Plant Physiol. 2001;125(1):85–88. doi: 10.1104/pp.125.1.85. [DOI] [PMC free article] [PubMed] [Google Scholar]
- 2.Franklin KA, Quail PH. Phytochrome functions in Arabidopsis development. J Exp Bot. 2010;61(1):11–24. doi: 10.1093/jxb/erp304. [DOI] [PMC free article] [PubMed] [Google Scholar]
- 3.de Montaigu A, Tóth R, Coupland G. Plant development goes like clockwork. Trends Genet. 2010;26(7):296–306. doi: 10.1016/j.tig.2010.04.003. [DOI] [PubMed] [Google Scholar]
- 4.Wang H, Wang H. Phytochrome signaling: Time to tighten up the loose ends. Mol Plant. 2015;8(4):540–551. doi: 10.1016/j.molp.2014.11.021. [DOI] [PubMed] [Google Scholar]
- 5.Lee KP, et al. Spatially and genetically distinct control of seed germination by phytochromes A and B. Genes Dev. 2012;26(17):1984–1996. doi: 10.1101/gad.194266.112. [DOI] [PMC free article] [PubMed] [Google Scholar]
- 6.Halliday KJ, Salter MG, Thingnaes E, Whitelam GC. Phytochrome control of flowering is temperature sensitive and correlates with expression of the floral integrator FT. Plant J. 2003;33(5):875–885. doi: 10.1046/j.1365-313x.2003.01674.x. [DOI] [PubMed] [Google Scholar]
- 7.Rockwell NC, Su Y-S, Lagarias JC. Phytochrome structure and signaling mechanisms. Annu Rev Plant Biol. 2006;57:837–858. doi: 10.1146/annurev.arplant.56.032604.144208. [DOI] [PMC free article] [PubMed] [Google Scholar]
- 8.Chen M, Chory J. Phytochrome signaling mechanisms and the control of plant development. Trends Cell Biol. 2011;21(11):664–671. doi: 10.1016/j.tcb.2011.07.002. [DOI] [PMC free article] [PubMed] [Google Scholar]
- 9.de Lucas M, Prat S. PIFs get BRright: PHYTOCHROME INTERACTING FACTORs as integrators of light and hormonal signals. New Phytol. 2014;202(4):1126–1141. doi: 10.1111/nph.12725. [DOI] [PubMed] [Google Scholar]
- 10.Toledo-Ortiz G, Huq E, Quail PH. The Arabidopsis basic/helix-loop-helix transcription factor family. Plant Cell. 2003;15(8):1749–1770. doi: 10.1105/tpc.013839. [DOI] [PMC free article] [PubMed] [Google Scholar]
- 11.Leivar P, Quail PH. PIFs: Pivotal components in a cellular signaling hub. Trends Plant Sci. 2011;16(1):19–28. doi: 10.1016/j.tplants.2010.08.003. [DOI] [PMC free article] [PubMed] [Google Scholar]
- 12.Leivar P, et al. Dynamic antagonism between phytochromes and PIF family basic helix-loop-helix factors induces selective reciprocal responses to light and shade in a rapidly responsive transcriptional network in Arabidopsis. Plant Cell. 2012;24(4):1398–1419. doi: 10.1105/tpc.112.095711. [DOI] [PMC free article] [PubMed] [Google Scholar]
- 13.Johansson H, et al. Arabidopsis cell expansion is controlled by a photothermal switch. Nat Commun. 2014;5:4848. doi: 10.1038/ncomms5848. [DOI] [PMC free article] [PubMed] [Google Scholar]
- 14.Park E, et al. Phytochrome B inhibits binding of phytochrome-interacting factors to their target promoters. Plant J. 2012;72(4):537–546. doi: 10.1111/j.1365-313X.2012.05114.x. [DOI] [PMC free article] [PubMed] [Google Scholar]
- 15.Rausenberger J, et al. An integrative model for phytochrome B-mediated photomorphogenesis: From protein dynamics to physiology. PLoS One. 2010;5(5):e10721. doi: 10.1371/journal.pone.0010721. [DOI] [PMC free article] [PubMed] [Google Scholar]
- 16.Rausenberger J, et al. Photoconversion and nuclear trafficking cycles determine phytochrome A’s response profile to far-red light. Cell. 2011;146(5):813–825. doi: 10.1016/j.cell.2011.07.023. [DOI] [PubMed] [Google Scholar]
- 17.Seaton DD, et al. Linked circadian outputs control elongation growth and flowering in response to photoperiod and temperature. Mol Syst Biol. 2015;11(1):776. doi: 10.15252/msb.20145766. [DOI] [PMC free article] [PubMed] [Google Scholar]
- 18.Strasser B, Sánchez-Lamas M, Yanovsky MJ, Casal JJ, Cerdán PD. Arabidopsis thaliana life without phytochromes. Proc Natl Acad Sci USA. 2010;107(10):4776–4781. doi: 10.1073/pnas.0910446107. [DOI] [PMC free article] [PubMed] [Google Scholar]
- 19.Hu W, et al. Unanticipated regulatory roles for Arabidopsis phytochromes revealed by null mutant analysis. Proc Natl Acad Sci USA. 2013;110(4):1542–1547. doi: 10.1073/pnas.1221738110. [DOI] [PMC free article] [PubMed] [Google Scholar]
- 20.Stitt M, Lunn J, Usadel B. Arabidopsis and primary photosynthetic metabolism: More than the icing on the cake. Plant J. 2010;61(6):1067–1091. doi: 10.1111/j.1365-313X.2010.04142.x. [DOI] [PubMed] [Google Scholar]
- 21.Smith AM, Stitt M. Coordination of carbon supply and plant growth. Plant Cell Environ. 2007;30(9):1126–1149. doi: 10.1111/j.1365-3040.2007.01708.x. [DOI] [PubMed] [Google Scholar]
- 22.Stitt M, Zeeman SC. Starch turnover: Pathways, regulation and role in growth. Curr Opin Plant Biol. 2012;15(3):282–292. doi: 10.1016/j.pbi.2012.03.016. [DOI] [PubMed] [Google Scholar]
- 23.Wind J, Smeekens S, Hanson J. Sucrose: Metabolite and signaling molecule. Phytochemistry. 2010;71(14-15):1610–1614. doi: 10.1016/j.phytochem.2010.07.007. [DOI] [PubMed] [Google Scholar]
- 24.Rahmani F, et al. Sucrose control of translation mediated by an upstream open reading frame-encoded peptide. Plant Physiol. 2009;150(3):1356–1367. doi: 10.1104/pp.109.136036. [DOI] [PMC free article] [PubMed] [Google Scholar]
- 25.Short TW. Overexpression of Arabidopsis phytochrome B inhibits phytochrome A function in the presence of sucrose. Plant Physiol. 1999;119(4):1497–1506. doi: 10.1104/pp.119.4.1497. [DOI] [PMC free article] [PubMed] [Google Scholar]
- 26.Dijkwel PP, Huijser C, Weisbeek PJ, Chua NH, Smeekens SC. Sucrose control of phytochrome A signaling in Arabidopsis. Plant Cell. 1997;9(4):583–595. doi: 10.1105/tpc.9.4.583. [DOI] [PMC free article] [PubMed] [Google Scholar]
- 27.Debrieux D, Trevisan M, Fankhauser C. Conditional involvement of constitutive photomorphogenic1 in the degradation of phytochrome A. Plant Physiol. 2013;161(4):2136–2145. doi: 10.1104/pp.112.213280. [DOI] [PMC free article] [PubMed] [Google Scholar]
- 28.Stewart JL, Maloof JN, Nemhauser JL. PIF genes mediate the effect of sucrose on seedling growth dynamics. PLoS One. 2011;6(5):e19894. doi: 10.1371/journal.pone.0019894. [DOI] [PMC free article] [PubMed] [Google Scholar]
- 29.Sairanen I, et al. Soluble carbohydrates regulate auxin biosynthesis via PIF proteins in Arabidopsis. Plant Cell. 2012;24(12):4907–4916. doi: 10.1105/tpc.112.104794. [DOI] [PMC free article] [PubMed] [Google Scholar]
- 30.Lilley JLS, Gee CW, Sairanen I, Ljung K, Nemhauser JL. An endogenous carbon-sensing pathway triggers increased auxin flux and hypocotyl elongation. Plant Physiol. 2012;160(4):2261–2270. doi: 10.1104/pp.112.205575. [DOI] [PMC free article] [PubMed] [Google Scholar]
- 31.Mazzella MA, Cerdán PD, Staneloni RJ, Casal JJ. Hierarchical coupling of phytochromes and cryptochromes reconciles stability and light modulation of Arabidopsis development. Development. 2001;128(12):2291–2299. doi: 10.1242/dev.128.12.2291. [DOI] [PubMed] [Google Scholar]
- 32.Ghassemian M, et al. Integrative analysis of transcript and metabolite profiling data sets to evaluate the regulation of biochemical pathways during photomorphogenesis. Arch Biochem Biophys. 2006;448(1-2):45–59. doi: 10.1016/j.abb.2005.11.020. [DOI] [PubMed] [Google Scholar]
- 33.Michael TP, et al. A morning-specific phytohormone gene expression program underlying rhythmic plant growth. PLoS Biol. 2008;6(9):e225. doi: 10.1371/journal.pbio.0060225. [DOI] [PMC free article] [PubMed] [Google Scholar]
- 34.Kircher S, Schopfer P. Photosynthetic sucrose acts as cotyledon-derived long-distance signal to control root growth during early seedling development in Arabidopsis. Proc Natl Acad Sci USA. 2012;109(28):11217–11221. doi: 10.1073/pnas.1203746109. [DOI] [PMC free article] [PubMed] [Google Scholar]
- 35.Halliday KJ, Whitelam GC. Changes in photoperiod or temperature alter the functional relationships between phytochromes and reveal roles for phyD and phyE. Plant Physiol. 2003;131(4):1913–1920. doi: 10.1104/pp.102.018135. [DOI] [PMC free article] [PubMed] [Google Scholar]
- 36.Bai M-Y, et al. Brassinosteroid, gibberellin and phytochrome impinge on a common transcription module in Arabidopsis. Nat Cell Biol. 2012;14(8):810–817. doi: 10.1038/ncb2546. [DOI] [PMC free article] [PubMed] [Google Scholar]
- 37.Lisec J, Schauer N, Kopka J, Willmitzer L, Fernie AR. Gas chromatography mass spectrometry-based metabolite profiling in plants. Nat Protoc. 2006;1(1):387–396. doi: 10.1038/nprot.2006.59. [DOI] [PubMed] [Google Scholar]
- 38.Hare PD, Cress WA, van Staden J. Proline synthesis and degradation: A model system for elucidating stress-related signal transduction. J Exp Bot. 1999;50(333):413–434. [Google Scholar]
- 39.Bhaskara GB, Yang T-H, Verslues PE. Dynamic proline metabolism: Importance and regulation in water-limited environments. Front Plant Sci. 2015;6(June):484. doi: 10.3389/fpls.2015.00484. [DOI] [PMC free article] [PubMed] [Google Scholar]
- 40.Krasensky J, Jonak C. Drought, salt, and temperature stress-induced metabolic rearrangements and regulatory networks. J Exp Bot. 2012;63(4):1593–1608. doi: 10.1093/jxb/err460. [DOI] [PMC free article] [PubMed] [Google Scholar]
- 41.Urano K, et al. Characterization of the ABA-regulated global responses to dehydration in Arabidopsis by metabolomics. Plant J. 2009;57(6):1065–1078. doi: 10.1111/j.1365-313X.2008.03748.x. [DOI] [PubMed] [Google Scholar]
- 42.Kempa S, Krasensky J, Dal Santo S, Kopka J, Jonak C. A central role of abscisic acid in stress-regulated carbohydrate metabolism. PLoS One. 2008;3(12):e3935. doi: 10.1371/journal.pone.0003935. [DOI] [PMC free article] [PubMed] [Google Scholar]
- 43.Colebrook EH, Thomas SG, Phillips AL, Hedden P. The role of gibberellin signalling in plant responses to abiotic stress. J Exp Biol. 2014;217(Pt 1):67–75. doi: 10.1242/jeb.089938. [DOI] [PubMed] [Google Scholar]
- 44.Skirycz A, Inzé D. More from less: Plant growth under limited water. Curr Opin Biotechnol. 2010;21(2):197–203. doi: 10.1016/j.copbio.2010.03.002. [DOI] [PubMed] [Google Scholar]
- 45.Jiang C, Belfield EJ, Cao Y, Smith JA, Harberd NP. An Arabidopsis soil-salinity-tolerance mutation confers ethylene-mediated enhancement of sodium/potassium homeostasis. Plant Cell. 2013;25(9):3535–3552. doi: 10.1105/tpc.113.115659. [DOI] [PMC free article] [PubMed] [Google Scholar]
- 46.Franklin KA, Whitelam GC. Light-quality regulation of freezing tolerance in Arabidopsis thaliana. Nat Genet. 2007;39(11):1410–1413. doi: 10.1038/ng.2007.3. [DOI] [PubMed] [Google Scholar]
- 47.Quail PH. Phytochrome photosensory signalling networks. Nat Rev Mol Cell Biol. 2002;3(2):85–93. doi: 10.1038/nrm728. [DOI] [PubMed] [Google Scholar]
- 48.Li J, Li G, Wang H, Wang Deng X. Phytochrome signaling mechanisms. Arabidopsis Book. 2011;9:e0148. doi: 10.1199/tab.0148. [DOI] [PMC free article] [PubMed] [Google Scholar]
- 49.Davison BH, Parks J, Davis MF, Donohoe BS. Plant cell walls: Basics of structure, chemistry, accessibility and the influence on conversion. In: Wyman CE, editor. Aqueous Pretreatment of Plant Biomass for Biological and Chemical Conversion to Fuels and Chemicals. Wiley; Chichester, UK: 2013. pp. 23–38. [Google Scholar]
- 50.Jumtee K, et al. Comprehensive metabolite profiling of phyA phyB phyC triple mutants to reveal their associated metabolic phenotype in rice leaves. J Biosci Bioeng. 2009;108(2):151–159. doi: 10.1016/j.jbiosc.2009.03.010. [DOI] [PubMed] [Google Scholar]
- 51.Patel D, et al. Temperature-dependent shade avoidance involves the receptor-like kinase ERECTA. Plant J. 2013;73(6):980–992. doi: 10.1111/tpj.12088. [DOI] [PubMed] [Google Scholar]
- 52.Devlin PF, et al. Phytochrome D acts in the shade-avoidance syndrome in Arabidopsis by controlling elongation growth and flowering time. Plant Physiol. 1999;119(3):909–915. doi: 10.1104/pp.119.3.909. [DOI] [PMC free article] [PubMed] [Google Scholar]
- 53.Franklin KA, et al. Phytochromes B, D, and E act redundantly to control multiple physiological responses in Arabidopsis. Plant Physiol. 2003;131(3):1340–1346. doi: 10.1104/pp.102.015487. [DOI] [PMC free article] [PubMed] [Google Scholar]
- 54.Ni Z, Kim E, Chen ZJ. Chlorophyll and starch assays. Protoc Exch. 2009 doi: 10.1038/nprot.2009.12. [DOI] [Google Scholar]
- 55.Hendriks JHM, Kolbe A, Gibon Y, Stitt M, Geigenberger P. ADP-glucose pyrophosphorylase is activated by posttranslational redox-modification in response to light and to sugars in leaves of Arabidopsis and other plant species. Plant Physiol. 2003;133(2):838–849. doi: 10.1104/pp.103.024513. [DOI] [PMC free article] [PubMed] [Google Scholar]
- 56.Aggio R, Villas-Bôas SG, Ruggiero K. Metab: An R package for high-throughput analysis of metabolomics data generated by GC-MS. Bioinformatics. 2011;27(16):2316–2318. doi: 10.1093/bioinformatics/btr379. [DOI] [PubMed] [Google Scholar]
Associated Data
This section collects any data citations, data availability statements, or supplementary materials included in this article.


