Abstract
Observational research promises to complement experimental research by providing large, diverse populations that would be infeasible for an experiment. Observational research can test its own clinical hypotheses, and observational studies also can contribute to the design of experiments and inform the generalizability of experimental research. Understanding the diversity of populations and the variance in care is one component. In this study, the Observational Health Data Sciences and Informatics (OHDSI) collaboration created an international data network with 11 data sources from four countries, including electronic health records and administrative claims data on 250 million patients. All data were mapped to common data standards, patient privacy was maintained by using a distributed model, and results were aggregated centrally. Treatment pathways were elucidated for type 2 diabetes mellitus, hypertension, and depression. The pathways revealed that the world is moving toward more consistent therapy over time across diseases and across locations, but significant heterogeneity remains among sources, pointing to challenges in generalizing clinical trial results. Diabetes favored a single first-line medication, metformin, to a much greater extent than hypertension or depression. About 10% of diabetes and depression patients and almost 25% of hypertension patients followed a treatment pathway that was unique within the cohort. Aside from factors such as sample size and underlying population (academic medical center versus general population), electronic health records data and administrative claims data revealed similar results. Large-scale international observational research is feasible.
Keywords: observational research, data network, treatment pathways
A learning health system (1) must systematically evaluate the effects of medical interventions to enable evidence-based medical decision-making. Randomized clinical trials serve as the cornerstone for causal evidence about medical products (2, 3), but evidence from these trials may be limited by an insufficient number of persons exposed, insufficient length of exposure, and inadequate coverage of the target population, factors that limit external generalizability. Observational studies can contribute to the larger goal of causal inference at three stages: (i) the design of experiments, such as determining what are the current therapies that should be compared with a new therapy; (ii) the direct testing of clinical hypotheses on observational data (4–8) using methods to correct for nonrandom treatment assignment as part of the effect estimation process; and (iii) better understanding of population characteristics to improve the extrapolation of both observational and experimental results to new groups.
Without sufficiently broad databases available in the first stage, randomized trials are designed without explicit knowledge of actual disease status and treatment practice. Literature reviews are restricted to the population choices of previous investigations, and pilot studies usually are limited in scope. By exploiting the ClinicalTrials.gov national trial registry (9) and electronic health records, researchers already have demonstrated the discrepancy between targeted populations and populations available for study (10), raising the concern that designs may not be optimal. Designs cannot be based simply on current treatment recommendations. Local stakeholders (patient, family, physician, and consultant) and global stakeholders (industry, regulators, academics, and the public) interact in complex ways (social media, literature, lay press, guidelines, advertising, formularies, package inserts, and direct interaction) to generate choices based on a variety of inputs (indication, feasibility, preference, and cost) (11–16). Because of this complexity, actual practice can be characterized only empirically, answering questions such as what treatment choices are being made in clinical practice, how many patients experience which combination of therapies, and how patterns may change over time or across different locations and practice types. Just as sample size calculations have become standard in trial design, so large-scale characterizations of current treatment practices may become standard in the future.
To carry out this systematic characterization on a very large scale, observational research will have several requirements: a multinational collaboration, common data standards, access to clinical data, compliance with regulatory and privacy laws in multiple nations, and appropriate methods and tools to implement the characterization. Observational Health Data Sciences and Informatics (OHDSI, pronounced “Odyssey”) (17) is an international collaboration of more than 120 researchers from 12 countries that contributes expertise at all levels, from infrastructure to clinical research, ensuring that the developed infrastructure meets clinical research needs. OHDSI’s Common Data Model (18), originally developed as part of the Observational Medical Outcomes Partnership (19), is a deep information model that specifies how to encode and store clinical data at a fine-grained level, ensuring that the same query can be applied consistently to databases around the world. OHDSI has chosen data integration standards that dovetail with those of the United States government and the international community, and it also supplies tools and mapping tables for converting data from other standards.
At last count, 52 databases, with a total of 682 million patient records, had been created using the Common Data Model (17); this number may include duplicate records for databases with overlapping populations. This study used 11 of those databases with more than 250 million records. Privacy is maintained by having data nodes retain protected health information within their firewalls. Queries are distributed and run locally, and only aggregate results are returned centrally. OHDSI develops new methods to analyze observational data, such as algorithms to minimize confounding (20) and methods to calibrate significance tests (21). They are implemented as an open-source set of tools that can be used by observational researchers around the world.
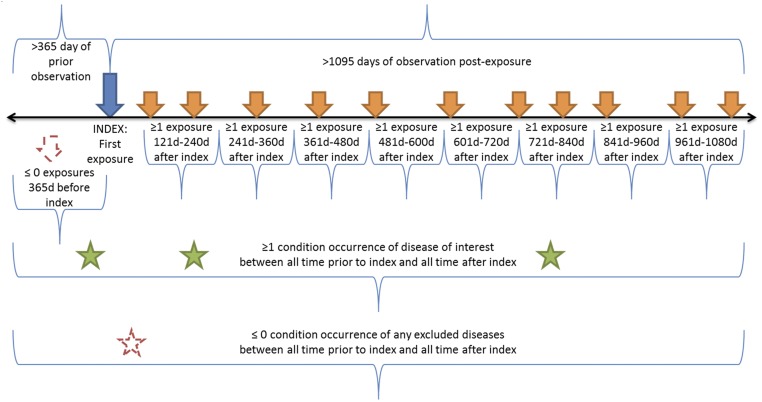
We used OHDSI’s large, diverse population to characterize treatment pathways—defined here as the ordered sequence of medications that a patient is prescribed—to provide unprecedented (and, in fact, heretofore unavailable) insight into clinical practice. We addressed three common diseases (Table 1): type 2 diabetes mellitus, hypertension, and depression. Given patients newly diagnosed with the disease and treated for at least 3 y, the query returned the sequences of medications that patients were placed on during those 3 y (Fig. 1). The sequences included changes in medication and additions of medication. Our aim was to reveal patterns and variation in treatment among data sources and diseases.
Table 1.
Disease definitions
| Disease | Medication classes | Diagnosis | Exclusions |
| Hypertension | Antihypertensives, diuretics, peripheral vasodilators, beta blocking agents, calcium channel blockers, agents acting on the renin-angiotensin system* | Hyperpiesis† | Pregnancy observations† |
| Diabetes mellitus, type 2 (Diabetes) | Drugs used in diabetes*, diabetic therapy‡ | Diabetes mellitus† | Pregnancy observations†, type 1 diabetes mellitus§ |
| Depression | Antidepressants*, antidepressants‡ | Depressive disorder† | Pregnancy observations†, bipolar I disorder†, schizophrenia† |
Terms are defined in the Anatomical Therapeutic Chemical (ATC) Classification System (23).
Terms are defined in the Systematized Nomenclature of Medicine (SNOMED) (37).
Terms defined in First Databank (FDB) (42).
Terms are defined in the Medical Dictionary for Regulatory Activities (MedDRA) (40).
Fig. 1.
Treatment pathway event flow. The index date for each case was the time of first exposure to one of the medications deemed relevant to that disease according to the medication classes defined in Table 1. The patient had to have been observed for at least 1 y before the index date. The patient had to have at least one diagnosis code from Table 1 within the 1-y preindex to 3-y postindex period, and the patient could have no codes from the exclusions in Table 1. In addition, the patient had to have an exposure to one of the relevant medications for that disease in each 120-d period after the index date. For data sources that allowed less-frequent updates (180 d for a prescription and five refills), the windows were adjusted.
Results
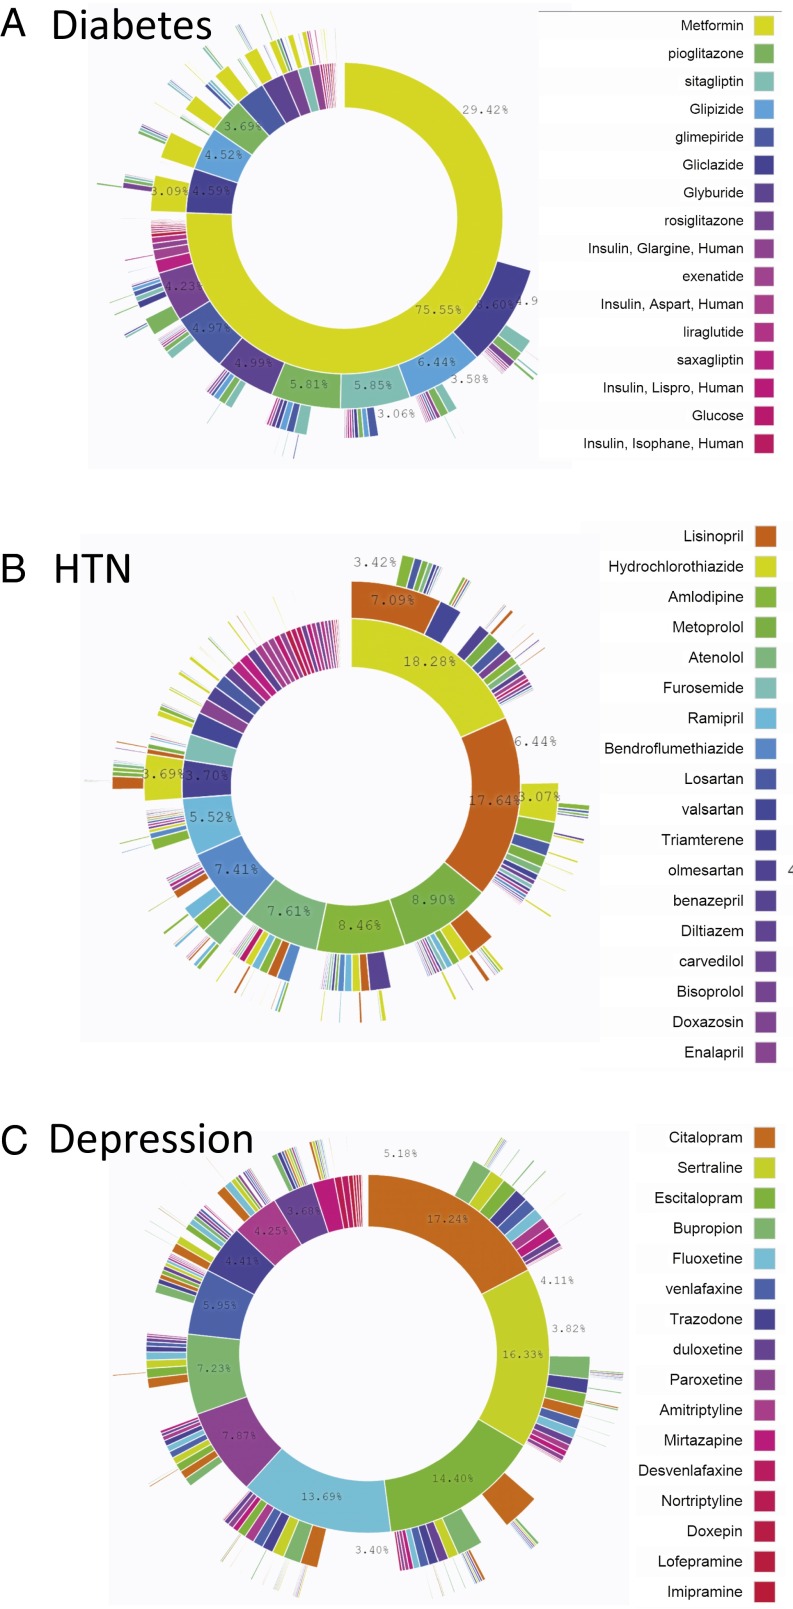
Fig. 2 illustrates the treatment pathways for the three diseases across all data sources. For diabetes, metformin was the most commonly prescribed medication; it was prescribed 75% of the time as the first medication and remained the only medication 29% of the time, thus confirming general adoption of the first-line recommendation of the American Association of Clinical Endocrinologists diabetes treatment algorithm (22). Hypertension shows the slight predominance of hydrochlorothiazide as a starting medication but the more significant predominance of lisinopril as a sole therapy, with hydrochlorothiazide being a sole therapy only rarely (hydrochlorothiazide is frequently paired with another active ingredient in combination medications). Depression shows a more even spread of medications. Of note, 10% of diabetes patients, 24% of hypertension patients, and 11% of depression patients followed a treatment pathway that was shared with no one else in any of the data sources. That is, for almost one quarter of hypertension patients, the response to the question, “In an underlying population of 250 million, based on my 3-y treatment pathway, what patients are like me?” would be “No one.”
Fig. 2.
Treatment pathways for all data sources. For each disease, diabetes (A), hypertension (B), and depression (C), and across all data sources, the inner circle shows the first relevant medication that the patient took, the second circle shows the second medication, and so forth. Only four levels are shown, but up to 20 medications were recorded. For example, 76% of diabetes patients started with metformin, and 29% took only metformin.
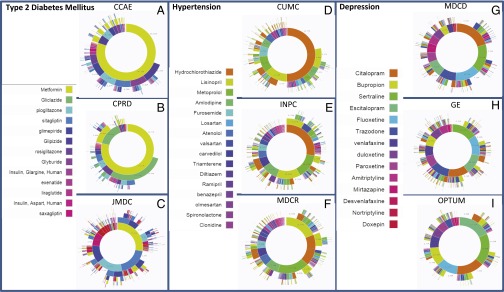
Fig. 3 shows the treatment pathways for selected data sources to illustrate their heterogeneity (see Supporting Information and Figs. S1–S3 for all data sources). The use of metformin in diabetes is not quite ubiquitous, as shown by comparing the Japan Medical Data Center (JMDC) (Fig. 3C) with United States Commercial Claims and Encounters (CCAE) (Fig. 3A). Second-line diabetes therapy is far more variable. For example, gliclazide use is reported only in the United Kingdom Clinical Practice Research Datalink (CPRD) (Fig. 3B), in which it is the predominant second-line therapy. Hypertension shows a wide array of starting medications that are not consistent among the sources. Hydrochlorothiazide is used to varying degrees (Fig. 3 D–F), but lisinopril is relatively consistent in its use and placement as the top solo medication. Depression shows a generally more even distribution of medication use, but the most common medication varies by sources even within the United States (Fig. 3 G–I).
Fig. 3.
For each disease, diabetes (A–C), hypertension (D–F), and depression (G–I), the inner circle shows the first relevant medication that the patient took, the second circle shows the second medication, and so forth. Three data sources are shown for each disease; the data source abbreviations are defined in Table 2.
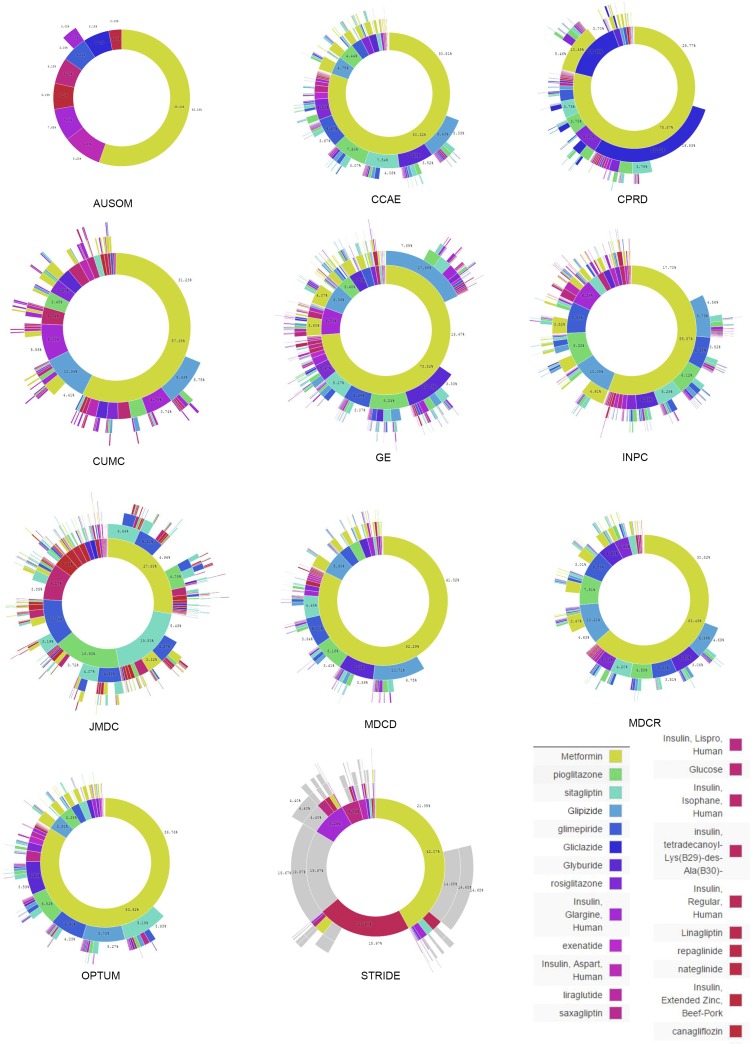
Fig. S1.
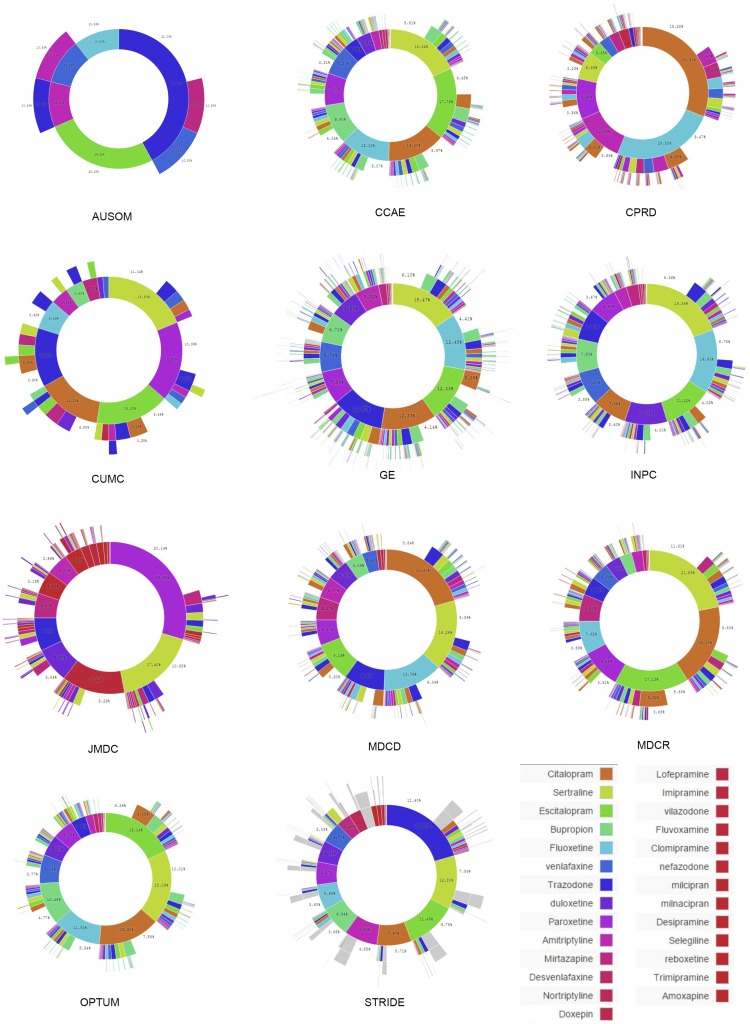
Treatment pathways for type 2 diabetes mellitus. The inner circle for each source shows the first relevant medication that the patient took, the second circle shows the second medication, and so forth. The data source abbreviations are defined in Table 2.
Fig. S3.
Treatment pathways for depression. The inner circle for each source shows the first relevant medication that the patient took, the second circle shows the second medication, and so forth. The data source abbreviations are defined in main paper Table 2.
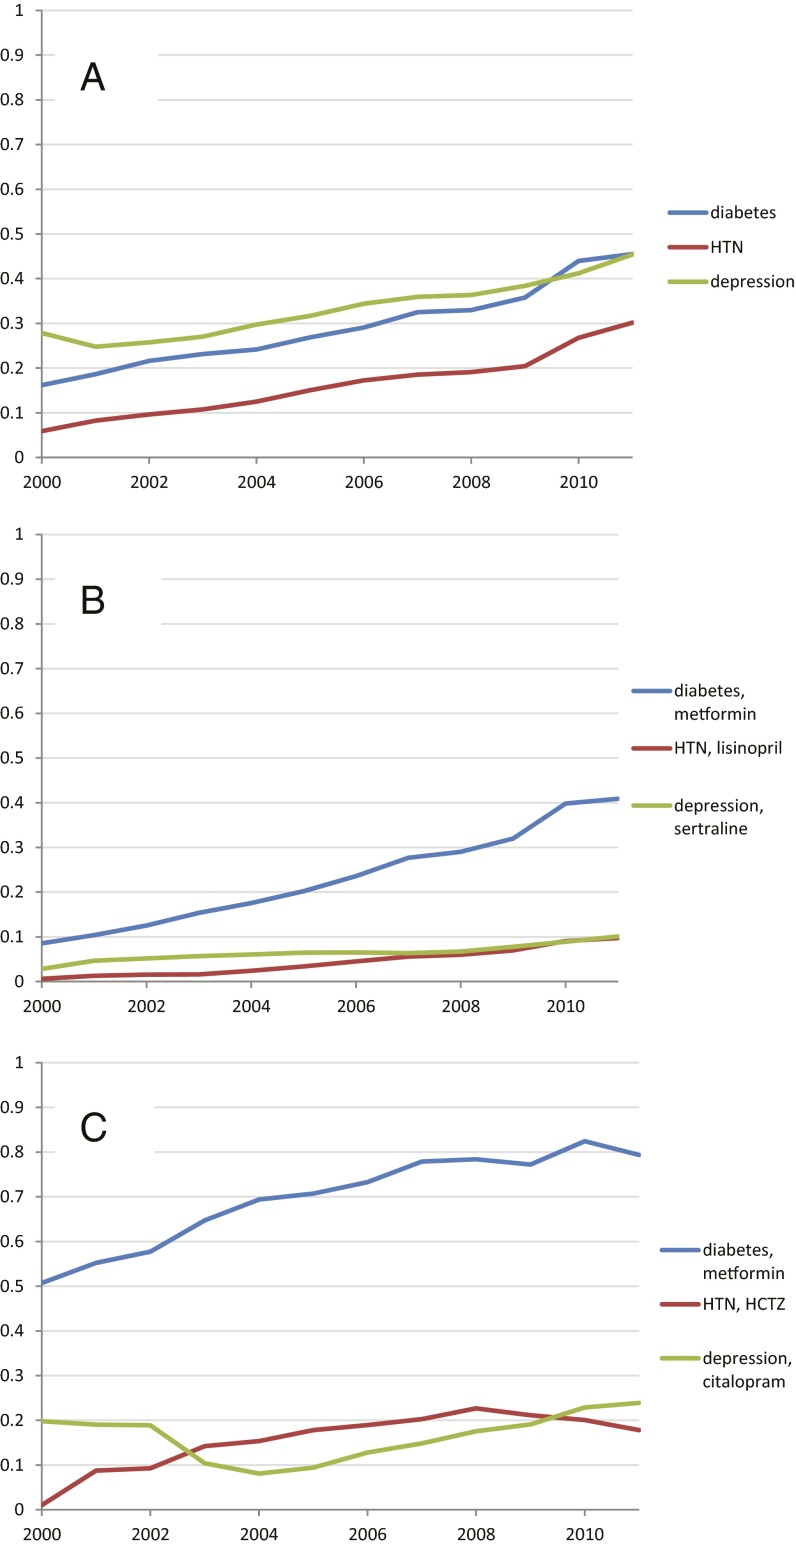
Fig. 4 shows several metrics of medication use for the three diseases. Fig. 4A shows a trend of increasing use of monotherapy (defined here as the use of a single medication in the entire 3-y window) from 2000 to 2012 for all three diseases, equally high for diabetes and depression. Fig. 4B illustrates that for hypertension and depression, unlike diabetes, the monotherapy trend is not driven by a single medication. Fig. 4C shows the degree to which a single medication dominates as a starting medication for the disease, with less convergence for hypertension and depression than for diabetes.
Fig. 4.
Medication-use metrics across all sources. Graphs show proportion by year for across all data sources for (A) cases with only one medication in the sequence (monotherapy); (B) cases in which the sequence contains only the most common monotherapy medication for that disease (medication listed with disease); and (C) cases in which a sequence begins with the most common starting medication for that disease (medication listed with disease).
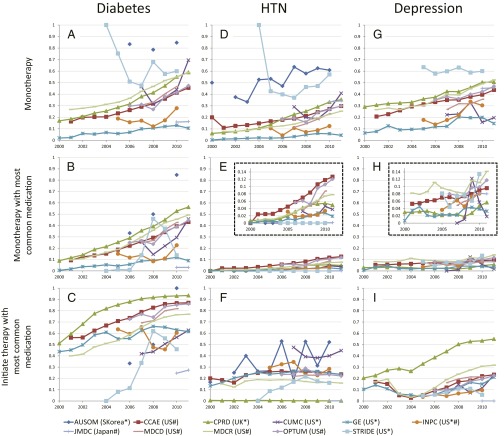
The same metrics, split out by data source, are shown in Fig. 5. The figure confirms the overall trends but also illustrates heterogeneity by source. Fig. 5A shows that diabetes monotherapy ranges from 10% in General Electric Centricity (GE) to 80% in Ajou University School of Medicine (AUSOM). In the adoption of metformin as a first (Fig. 5C) and single (Fig. 5B) medication over the studied time period, several data sources, such as Stanford Translational Research Integrated Database Environment (STRIDE) and Columbia University Medical Center (CUMC), lag the group. Although this difference could be a data-collection issue, it may simply reflect the difference in the severity of illness of patients represented by these two academic medical centers compared with broader populations or even differences in skill levels of prescribers at different sites. For hypertension and depression there was no one dominant medication (Fig. 5 E and H). Fig. 5F shows the effects of differing formularies (i.e., list of allowable drugs): the United Kingdom (CPRD) and Japan (JMDC) show no use of hydrochlorothiazide, Sound Korea (AUSOM) shows significant use, and the United States sources are generally between these extremes.
Fig. 5.
Medication-use metrics by data source. For three diseases, diabetes (A–C), hypertension (D–F), and depression (G–I), the graphs show the proportion of cases with only one medication in the sequence (monotherapy: A, D, and G), the proportion of cases in which the sequence contains only the most common monotherapy medication for that disease (B: metformin for diabetes; E: lisinopril for hypertension; and H: sertraline for depression), and the proportion of cases in which a sequence begins with the most common starting medication for that disease (C: metformin for diabetes; F: hydrochlorothiazide for hypertension; and I: citalopram for depression). The vertical axes in the graphs in E and H are expanded in the Insets. The horizontal axis shows the year. Abbreviations in the data source legend are defined in Table 2; the country of origin is given in parentheses. Asterisks mark electronic health record data, and hashtags mark claims data.
Fig. 5 is also significant for what it fails to show: It fails to show a consistent bias between use of electronic health record data and use of claims data, other than that explained by sample size and differences in population (e.g., academic medical center, as noted above). For example, even though health records report medication orders and claims data report medication prescription fills, the two types of sources corroborate each other. On the graphs, sources are not generally grouped by type. For example, in many cases, United States claims (CCAE) and United Kingdom health records (CPRD) track each other well (Fig. 5 A–D, G, and H). Other factors apparently have a larger effect on variance. The one consistent difference is the reduced noise associated with the larger sample sizes (Table 2) generally available in claims databases.
Table 2.
Data source descriptions
| Abbreviation | Name | Description | Population, millions |
| AUSOM | Ajou University School of Medicine | Electronic health record data from a Korean tertiary teaching hospital with 1,096 patient beds and 23 operating rooms that adopted a computerized provider order entry system in 1994 and a comprehensive electronic health record system in March 2010 | 2 |
| CCAE | MarketScan Commercial Claims and Encounters | An administrative health claims database for active employees, early retirees, COBRA continues, and their dependents ensured by employer‐sponsored plans (individuals in plans or product lines with fee‐for‐service plans and fully capitated or partially capitated plans) | 119 |
| CPRD | UK Clinical Practice Research Datalink | Anonymized longitudinal electronic health records from primary care practices in the United Kingdom. Patient management system with many aspects of patient care covered, including diagnoses, prescriptions, signs and symptoms, procedures, laboratories, lifestyle factors, clinical and administrative/social data | 11 |
| CUMC | Columbia University Medical Center | Electronic health record data from the Columbia University Medical Center and NewYork-Presbyterian Hospital clinical transaction-based data repository | 4 |
| GE | General Electric Centricity | Derived from data pooled from providers who use GE Centricity Office (an ambulatory electronic health record) into a data warehouse in a Health Insurance Portability and Accountability Act–compliant manner | 33 |
| INPC | Regenstrief Institute, Indiana Network for Patient Care | Population-based, longitudinal, and structured coded and text data captured from hospitals, physician practices, public health departments, laboratories, radiology centers, pharmacies, pharmacy benefit managers, and payers in the Indiana Network | 15 |
| JMDC | Japan Medical Data Center | An administrative health claims database for patients with private insurance plans in Japan | 3 |
| MDCD | MarketScan Medicaid Multi-State | An administrative health claims database for the pooled healthcare experience of Medicaid enrollees from multiple states | 17 |
| MDCR | MarketScan Medicare Supplemental and Coordination of Benefits | An administrative health claims database for Medicare‐eligible active and retired employees and their Medicare-eligible dependents from employer‐sponsored supplemental plans (predominantly fee‐for-service plans). Only plans in which both the Medicare‐paid amounts and the employer‐paid amounts were available and evident on the claims were selected for this database. | 9 |
| OPTUM | Optum ClinFormatics | An administrative health claims database for members of United Healthcare, who enrolled in commercial plans (including ASO), Medicaid (before July 201) and Legacy Medicare Choice (before January 2006) with both medical and prescription drug coverage | 40 |
| STRIDE | Stanford Translational Research Integrated Database Environment | Electronic health record data derived from all patients treated as outpatients and inpatients at Stanford Hospital and Clinics from 1995 to 2013, including structured clinical data and unstructured clinical notes | 2 |
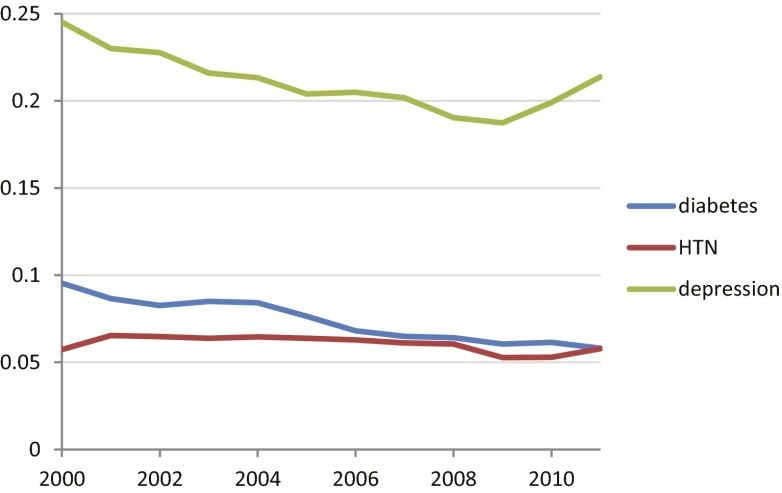
We used the World Health Organization’s Anatomical Therapeutic Chemical classification (23) to group medications into classes to see if diseases varied in the extent to which medications were changed or added within the same medication class (within-class medication change) or a different one (between-class medication change). The three diseases did not show a large change over the time period (Fig. 6). Depression shows a stronger tendency to stay within class than diabetes or hypertension, but it had fewer classes (6 classes; also see Supporting Information and Table S1) than diabetes (23 classes) or hypertension (29 classes).
Fig. 6.
Changes and additions to medication within structural medication class. Medication class was defined by the Anatomical Therapeutic Chemical classification hierarchy. For each disease, the graph shows the proportion of medication changes that were within class versus changes that were between classes. Over this period, the number of classes per disease was approximately constant: Diabetes had 16 or 17, hypertension (HTN) had 17–19, and depression had 13.
Table S1.
Medication classes
| Type 2 diabetes mellitus medication classes |
| Aldose reductase inhibitors |
| Alpha glucosidase inhibitors |
| Biguanides |
| Carbohydrates |
| Dipeptidyl peptidase 4 (DPP-4) inhibitors |
| Dopamine agonists |
| Drugs for treatment of hypoglycemia |
| Glycogenolytic hormones |
| Insulins and analogs for inhalation |
| Insulins and analogs for injection, fast-acting |
| Insulins and analogs for injection, intermediate- or long-acting combined with fast-acting |
| Insulins and analogs for injection, intermediate-acting |
| Insulins and analogs for injection, long-acting |
| Other blood glucose lowering drugs, excl. insulins |
| Other irrigating solutions |
| Progesterone receptor modulators |
| Prolactin inhibitors |
| Solutions for parenteral nutrition |
| Sulfonamides (heterocyclic) |
| Sulfonylureas |
| Tests for diabetes |
| Thiazide derivatives |
| Thiazolidinediones |
| Hypertension medication classes |
| Angiotensin-converting enzyme inhibitors, plain |
| Agents for treatment of hemorrhoids and anal fissures for topical use |
| All other therapeutic products |
| Angiotensin ii antagonists, plain |
| Antiadrenergic agents, centrally acting |
| Antiadrenergic agents, ganglion-blocking |
| Antiadrenergic agents, peripherally acting |
| Antiglaucoma preparations and miotics |
| Antihypertensives and diuretics in combination |
| Antimigraine preparations |
| Arteriolar smooth muscle, agents acting on |
| Beta blocking agents |
| High-ceiling diuretics |
| Lipid modifying agents, plain |
| Low-ceiling diuretics, excl. Thiazides |
| Low-ceiling diuretics, thiazides |
| Nonselective calcium channel blockers |
| Other agents acting on the renin-angiotensin system |
| Other antihypertensives |
| Other dermatological preparations |
| Other diuretics |
| Other gynecologicals |
| Other systemic drugs for obstructive airway diseases |
| Peripheral vasodilators |
| Potassium-sparing agents |
| Selective calcium channel blockers with direct cardiac effects |
| Selective calcium channel blockers with mainly vascular effects |
| Topical products for joint and muscular pain |
| Urologicals |
| Depression medication classes |
| Monoamine oxidase A inhibitors |
| Monoamine oxidase B inhibitors |
| Monoamine oxidase inhibitors, nonselective |
| Nonselective monoamine reuptake inhibitors |
| Other antidepressants |
| Selective serotonin reuptake inhibitors |
Discussion
This descriptive analysis demonstrates that coordinated efforts across an international collaborative can overcome many of the logistic and methodological challenges associated with observational study designs. The profiles of treatment pathways are based on more than 250 million patient records, although some overlap is possible because of payers and health care providers reporting on the same patients. OHDSI successfully addressed patient privacy and diverse research regulatory constraints, adopted a consistent data model, and distributed queries across a broad population. Furthermore, although this study happened to be of treatment pathways for three diseases, all the involved data sources have adopted a common industry standard for longitudinally recorded visits, diagnoses, procedures, medications, and (where available) laboratory tests, and any combination of the data can be used to answer future questions across medicine. A query authored at one OHDSI site may be run at all sites without further modification.
Despite the wide variety of data sources, significant consistency is shown in Fig. 5, with largely similar rates and similar upswing. The world is moving toward more consistent therapy over time across diseases and across locations. Nevertheless, outliers are also seen, highlighting the danger of drawing broad inferences from single-site or even single-country observational studies. This study corroborates previous work by the OHDSI researchers, which illustrated the danger of naively combining data from disparate sources (24). The differences in treatment pathways over time, between countries, between practice types, and across sites—such as the apparent lag in the adoption of metformin for treatment of diabetes mellitus in some sites—points to potential challenges for generalizing randomized trial results. For example, differences in treatment practices between studied and nonstudied groups could threaten the ability to generalize the efficacy of even nonmedication interventions such as education to nonstudied groups.
Comparing diseases, we see consistent differences, perhaps related to the availability, appropriateness, or acceptance of concrete recommendations. Diabetes shows greater adoption of a single medication, especially in recent years. Depression, which has far less concrete guidelines, has a roughly similar rate of single-medication use, but no one medication stands out as predominant. Additions and changes of medications are more likely to be within the same medication class for depression than for the other diseases. These differences among diseases are not solely the result of formal recommendations, however. Metformin, which was approved in the United States relatively recently (1995), already dominated the market as a first-line therapy in 2000 (Fig. 4C).
The proportion of patients with a sequence of medication use that is unique across all data sources—almost one quarter the patients with hypertension—is striking. It may point to a failure of the field to converge on an effective treatment. The variation in first medications (Fig. 3 D–F) corroborates this fact. When precision medicine becomes a reality, with fine-grained, reliable knowledge of patient characteristics, it may be possible to assign a unique sequence tailored to a patient. For the time being, however, much of this variation probably reflects ineffective differences in practice and a trial-and-error approach to diseases that are difficult to treat.
These results have general and specific implications for randomized clinical trials. The heterogeneity implies that randomized trials may not be broadly generalizable if not designed properly. Multicenter trials should not be a convenient sample of academic medical centers but a purposeful selection of environments that represent the diversity of practice in health care. During analysis, trial results cannot simply be aggregated but may need to be stratified by practice characteristics. More specifically, trials in diabetes, hypertension, and depression can use our uncovered pathways and their prevalences for future trial design. For example, hypotheses and control groups for trials in these diseases should consider actual rather than assumed practice. For example, if a medication of interest is always given in sequence after another one, then a randomized trial of the causal effect of new-onset use of that medication will not be relevant to current practice.
There has been related work on empirical treatment pathways. One project generated algorithms for mining time dependencies, although it was applied only to a cohort of 113 stroke patients (25), and is most appropriate to extract the maximum information from a small dataset in terms of the computation required and the detail returned per case. Using previous experience to guide future recommendations is a related area. Previous experience, especially experience explicitly rated by physicians, can be used to generate recommendations (26). Detailed pathways can be extracted from hospital event logs (27), although they generally have been extracted from a single environment. Large-scale data have been used to study specific medications in specific diseases, such as rosiglitazone in diabetes using the Clinical Practice Research Datalink database (28).
In the future, our OHDSI framework may be able to facilitate randomized trials at three stages: design, execution, and generalization. At the design stage, in addition to the characterization illustrated in this study and discussed above, observational databases may improve both the estimation of the number of subjects available and the gross estimation of the effect sizes and variances to calculate the number of subjects needed. For execution, observational databases may facilitate subject recruitment and data collection in pragmatic trials (29), and—more ambitiously—they may complement randomized trials by providing direct evidence for causation. A key problem is avoiding or controlling confounding, using methods that model statistical and information theoretic relationships within a set of variables such as structural equations and graphical models (30), methods that place candidate associations in a context to judge the plausibility of causation such as the Hill Criteria (31), methods that correct effect size estimations such as the use of propensity scores (32), designs that reduce confounding such as self-controlled case series (33), and others (34). If confounding can be addressed, then observational trials can increase sample size, add diversity, and handle more complex interventions such as sequences of treatments. In addition to the characterization illustrated in this study to assess the risk of generalization failure, observational databases may be able to improve generalization (35, 36). By mimicking the randomized clinical trial in the study population as well as other target populations, the observational version may reveal trends in effect sizes that are applicable to the randomized trial. We believe that the leap from observational research’s associations to causality is similar to the leap from randomized trial’s causes to individual treatment because both are subject to assumptions and confounders. Fuller (37) separates the generalization procedure into two parts: (i) going from the study population in which the trial was carried out to the local population to which the individual belongs, and (ii) going from the local population to the individual. The former may be aided by observational databases, and the latter is an example of precision medicine.
The full count of 682 million records (17) that have been converted to OHDSI’s data model has implications for a worldwide database. Although that number includes duplicate patients, OHDSI’s successful conversion of a number of records equal to almost 1/10th of the world’s population as a voluntary effort implies that converting the entire world population to a single, highly detailed data model is technically feasible. It also shows the success of an open, voluntary approach. OHDSI will distribute an open request for applications for queries against its databases for researchers at any level, from high school student to Nobel Laureate, selecting queries based on feasibility and potential impact.
The study and the OHDSI framework have limitations. In this study, the strict definition of 1 y off treatment followed by 3 y on continuous treatment reduces sample size and could cause biases such as loss of patients with severe disease who die within 3 y. More generally, data derived from electronic health records and from claims databases are naturally noisy with missing values, and observational data are subject to confounding, both measured and unmeasured. The OHDSI network is voluntary, so participation may vary from study to study.
In summary, the OHDSI project exploited 250 million patient records and assessed treatment pathways for three different chronic diseases over time, across national boundaries, and across distinct data sources. The study proved feasible, with largely consistent results but also with significant heterogeneity. Variability in treatment pathways was found, and diseases differed in patterns of drug use such as the favoring of a single medication. Large-scale international observational studies can use a consistent data model, cover a broad population, and address patient privacy.
Materials and Methods
Each site’s Common Data Model (23) was populated with patient characteristics, health care visits, diseases, medications, procedures, and, optionally, other types of data such as laboratory tests. Data elements were translated to standard terminologies such as Systematized Nomenclature of Medicine (diseases, procedures) (38), RxNorm (medications) (39), and Logical Observation Identifiers Names and Codes (laboratory tests) (40). The data sources depended on the site. Some sites used administrative claims, usually obtained from clinical data distributors, and other sites used local electronic health record data. Medication information came from insurance claims, pharmacy fulfillments, prescriptions, or clinical narrative documentation.
We developed a query against the OHDSI Common Data Model as follows (also see Supporting Information, including de-identified Datasets S1–S4). Patients were included if they had at least one exposure to an antihyperglycemic, antihypertensive, or antidepressant medication and at least one diagnosis code for the corresponding disease—type 2 diabetes mellitus, hypertension, or depression—at any time in their record and had no excluded diagnoses. The index date was considered to be the first exposure to the medication. The patient had to have at least 1 y of history in the database before the index date to increase the likelihood that this was a first treatment of the disease by any medication. The patient had to have at least 3 y of continuous treatment after the index date with some medication targeted to the disease. Three years was chosen to ensure sufficient time to characterize a pathway, although this requirement lost patients who died within the 3-y period. Continuous treatment was required to ensure that patients were not treated elsewhere during the period. Although these strict definitions reduced the number who qualified—327,110 diabetes patients, 1,182,792 hypertension patients, and 264,841 depression patients had 3 y of uninterrupted therapy—it produced a more consistent cohort across data sources. Fig. 1 shows the flow of events necessary for a patient to qualify for the study. A patient’s sequence could come from any time in a database as long as it satisfied the 4-y time window (1 y before and 3 y after the index date). In tabulations and graphs, we use a sequence’s index date to determine its year. The diagnosis code was defined in Systematized Nomenclature of Medicine (38) and in the Medical Dictionary for Regulatory Activities (41) and was mapped to other terminologies including the International Classification of Diseases, Ninth Revision, Clinical Modification (42). The medications were defined according to their ingredients using the RxNorm terminology (39) and were grouped according to classification hierarchies such as Anatomical Therapeutic Chemical classification (23) and First Data Bank’s terminology (43). The chosen medication classes and diagnoses are listed in Table 1. For the purpose of measuring intraclass medication changes, classes were defined at the second level of the Anatomical Therapeutic Chemical classification hierarchy (23).
The sequence of medications taken by each patient was extracted from the databases, ordering them by first exposure to the medication. Note that only the first exposure was recorded for patients who switched from a medication and then back to it. The sequence does not distinguish between switching medications and adding medications. Combination medications with multiple active ingredients were treated as if the multiple ingredients were prescribed independently but simultaneously to avoid inducing measured diversity. Sequences were limited to 20 medications. We then counted the number of individuals within the database who had each observed sequence. We created tabular and graphical summaries of the sequence results, stratifying by disease, database, and index year. We ran the analyses on 11 databases, summarized in Table 2. The full source code for the analysis is freely available (44); it is implemented in Structured Query Language coupled with R (45) for aggregated data generation.
Sunburst plots were generated from medication sequences (using software written in Hypertext Markup Language 5 and JavaScript using Data-Driven Documents, available at OHDSI.org). To compare consistency of medication use across diseases, we defined three metrics: (i) the proportion of cases with only one medication in the sequence (monotherapy); (ii) the proportion of cases in which the sequence contains only the most common monotherapy medication for that disease; and (iii) the proportion of cases in which a sequence begins with the most common starting medication for that disease. These metrics were chosen so that we could compare diseases in a generic way, with no specific knowledge of the diseases other than tallying the most common medications. Higher proportions generally imply greater agreement on treatment.
Each site confirmed Institutional Review Board approval for the study or confirmed that their analysis did not require approval because it was exempt or was deemed nonhuman subjects research (e.g., because the database had previously been de-identified).
SI Materials and Methods
Medication sequences were generated from 11 OHDSI Common Data Model data sources as described in Materials and Methods and illustrated in Fig. 1 in the main text. The full source code for the conversion is available at www.ohdsi.org/web/wiki/doku.php?id=research:treatment_pathways_in_chronic_disease.
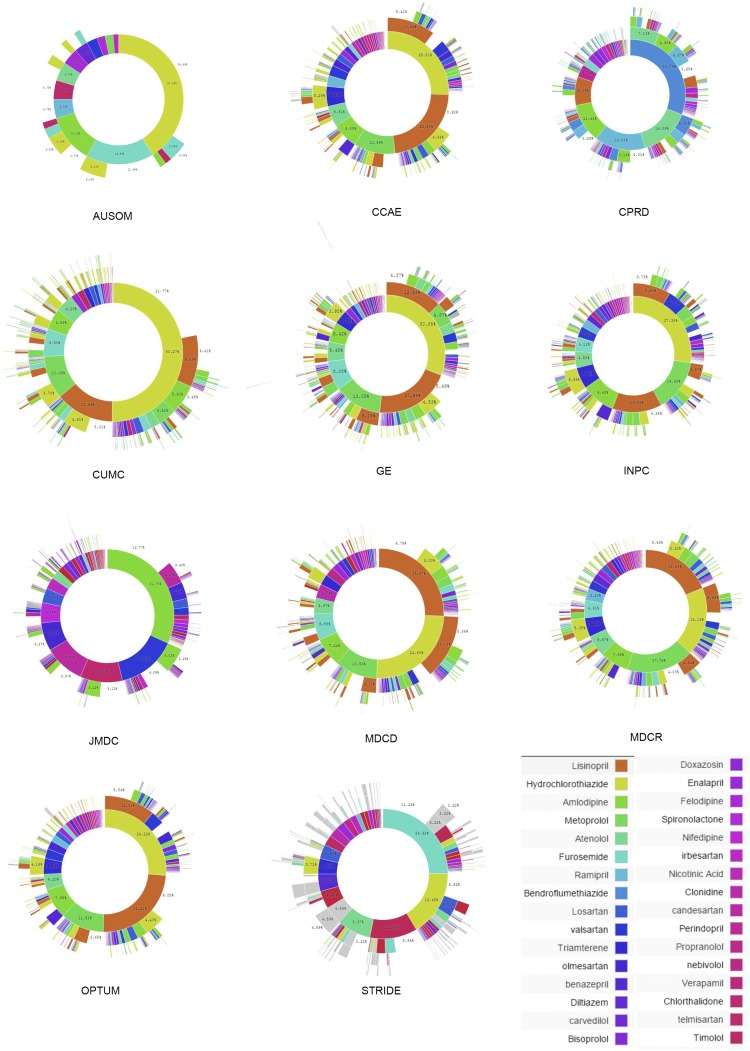
Sunburst plots (Figs. 2 and 3 in the main text) were calculated as the proportion of cases that had a given sequence of medications: one medication, two medications, three medications, and four medications. Longer sequences were truncated to four medications and were included with other four-medication sequences. When binning across sources, the simple sum was used, and therefore sources with greater sample size had greater weight. The sunburst plots themselves were generated using software written in Hypertext Markup Language 5 and JavaScript using Data-Driven Documents (available at OHDSI.org).
The proportion of cases with one medication in the sequence (referred to as “monotherapy” in Figs. 4A and 5 in the main text) was calculated as the sum of the number of cases with sequences with exactly one medication divided by the total number of cases, binning by year and then by data source and year. When binning by year for this metric and the others, the simple sum across all sources was used, and therefore sources with greater sample size had greater weight. For the proportion of cases in which the sequence contains only the most common monotherapy medication for that disease (Figs. 4B and 5 in the main text), we selected the one medication for each disease that had the highest proportion of monotherapy across all sources and across all years, and then we calculated the proportion of cases with sequences that had only that medication, binning by year and then by source and year. For the proportion of cases in which a sequence begins with the most common starting medication for that disease (Figs. 4C and 5 in the main text), we selected the one medication for each disease that was most the frequent first medication in a sequence across all sources and across all years, and then we calculated the proportion of cases with sequences that started with that medication, binning by year and then by source and year.
We used the World Health Organization’s Anatomical Therapeutic Chemical (ATC) classification (www.whocc.no/atc/structure_and_principles/) to group medications into classes. For type 2 diabetes mellitus and for depression, we used a single-level ancestor in the ATC hierarchy; for hypertension we used two levels, resulting in the classes shown in Table S1. The number of transitions within a sequence is one less than the number of medications in the sequence. The number of within-class transitions is the number of sequential pairs that both belong in the same medication class. The proportion of medication changes within class was then the simple sum of within-class transitions for all cases divided by the simple sum of transitions for all cases.
For calculating the proportion of cases with a sequence that was shared with no one else, the sequence had to be unique across all sources and all years, not just within source or within year.
Fig. 5 in the main text shows only a sample of three sources for each disease. Fig. S1 shows all sources for type 2 diabetes mellitus, Fig. S2 shows all sources for hypertension, and Fig. S3 shows all sources for depression.
Fig. S2.
Treatment pathways for hypertension. The inner circle for each source shows the first relevant medication that the patient took, the second circle shows the second medication, and so forth. The data source abbreviations are defined in main paper Table 2.
The sequences derived from the data sources are available in this Supporting Information as four files: rxpath5cell_dictionary.xlsx (Dataset S1), rxpath5cell_diabetes2.xlsx (Dataset S2), rxpath5cell_hypertension.xlsx (Dataset S3), and rxpath5cell_depression.xlsx (Dataset S4). Because of licensing requirements for the data sources, cell counts have been limited to a minimum of five. Sequences with fewer than five cases were truncated until the common initial section of several sequences surpassed a total count of five, and the truncated portion was marked “Other” (code −1). As a result, the count of unique sequences cannot be calculated from this dataset, but the rest of the metrics and visualizations should be approximately the same. The file rxpath5cell_dictionary.xlsx defines the medication codes and source codes used in the other files. The files rxpath5cell_diabetes2.xlsx, rxpath5cell_hypertension.xlsx, and rxpath5cell_depression.xlsx each contain the sequences for the corresponding diseases. They include the code of the source, the year (where 9999 combines all years), the number of cases in that source and year bin that had a given sequence, and then the codes of the 20 first medications in that sequence. A sequences ends when 0 is reached. For example, a sequence of 1597756, 0, 0, … implies that glimepiride was the sole medication, and a sequence of 1529331, −1, 0, 0, … indicates a collection of uncommonly used sequences that started with acarbose.
Supplementary Material
Acknowledgments
This work was funded in part by Grants R01 LM006910 and R01 LM011369 from the National Library of Medicine, Grant R01 GM101430 from the National Institute of General Medical Sciences, Grant NSF IIS 1251151 from the National Science Foundation, and by the Smart Family Foundation. Infrastructure to carry out the project was funded in part by Janssen Research and Development, AstraZeneca, and Takeda Pharmaceuticals International. Use of the CPRD data set was approved by the CPRD Independent Scientific Advisory Committee as protocol 15_019R.
Footnotes
The authors declare no conflict of interest.
This paper results from the Arthur M. Sackler Colloquium of the National Academy of Sciences, “Drawing Causal Inference from Big Data,” held March 26–27, 2015, at the National Academies of Sciences in Washington, DC. The complete program and video recordings of most presentations are available on the NAS website at www.nasonline.org/Big-data.
This article is a PNAS Direct Submission.
This article contains supporting information online at www.pnas.org/lookup/suppl/doi:10.1073/pnas.1510502113/-/DCSupplemental.
References
- 1.Etheredge LM. Rapid learning: A breakthrough agenda. Health Aff (Millwood) 2014;33(7):1155–1162. doi: 10.1377/hlthaff.2014.0043. [DOI] [PubMed] [Google Scholar]
- 2.Atkins D, et al. GRADE Working Group Grading quality of evidence and strength of recommendations. BMJ. 2004;328(7454):1490–1494. doi: 10.1136/bmj.328.7454.1490. [DOI] [PMC free article] [PubMed] [Google Scholar]
- 3.Guyatt G, et al. Grading strength of recommendations and quality of evidence in clinical guidelines: Report from an american college of chest physicians task force. Chest. 2006;129(1):174–181. doi: 10.1378/chest.129.1.174. [DOI] [PubMed] [Google Scholar]
- 4.Concato J, Shah N, Horwitz RI. Randomized, controlled trials, observational studies, and the hierarchy of research designs. N Engl J Med. 2000;342(25):1887–1892. doi: 10.1056/NEJM200006223422507. [DOI] [PMC free article] [PubMed] [Google Scholar]
- 5.Benson K, Hartz AJ. A comparison of observational studies and randomized, controlled trials. N Engl J Med. 2000;342(25):1878–1886. doi: 10.1056/NEJM200006223422506. [DOI] [PubMed] [Google Scholar]
- 6.Berger ML, Mamdani M, Atkins D, Johnson ML. Good research practices for comparative effectiveness research: Defining, reporting and interpreting nonrandomized studies of treatment effects using secondary data sources: The ISPOR Good Research Practices for Retrospective Database Analysis Task Force Report--Part I. Value Health. 2009;12(8):1044–1052. doi: 10.1111/j.1524-4733.2009.00600.x. [DOI] [PubMed] [Google Scholar]
- 7.Ryan PB, et al. Empirical assessment of methods for risk identification in healthcare data: Results from the experiments of the Observational Medical Outcomes Partnership. Stat Med. 2012;31(30):4401–4415. doi: 10.1002/sim.5620. [DOI] [PubMed] [Google Scholar]
- 8.Madigan D, et al. A systematic statistical approach to evaluating evidence from observational studies. Annu Rev Stat Appl. 2014;1:11–39. [Google Scholar]
- 9.McCray AT. Better access to information about clinical trials. Ann Intern Med. 2000;133(8):609–614. doi: 10.7326/0003-4819-133-8-200010170-00013. [DOI] [PubMed] [Google Scholar]
- 10.Weng C, et al. A distribution-based method for assessing the differences between clinical trial target populations and patient populations in electronic health records. Appl Clin Inform. 2014;5(2):463–479. doi: 10.4338/ACI-2013-12-RA-0105. [DOI] [PMC free article] [PubMed] [Google Scholar]
- 11.Wynaden D, et al. Administering intramuscular injections: How does research translate into practice over time in the mental health setting? Nurse Educ Today. 2015;35(4):620–624. doi: 10.1016/j.nedt.2014.12.008. [DOI] [PubMed] [Google Scholar]
- 12.Kendrick T, Stuart B, Newell C, Geraghty AW, Moore M. Did NICE guidelines and the Quality Outcomes Framework change GP antidepressant prescribing in England? Observational study with time trend analyses 2003-2013. J Affect Disord. 2015;186:171–177. doi: 10.1016/j.jad.2015.06.052. [DOI] [PubMed] [Google Scholar]
- 13.Daubresse M, et al. Effect of Direct-to-Consumer Advertising on Asthma Medication Sales and Healthcare Use. Am J Respir Crit Care Med. 2015;192(1):40–46. doi: 10.1164/rccm.201409-1585OC. [DOI] [PMC free article] [PubMed] [Google Scholar]
- 14.Bradford WD, Kleit AN. Impact of FDA Actions, DTCA, and Public Information on the Market for Pain Medication. Health Econ. 2015;24(7):859–875. doi: 10.1002/hec.3067. [DOI] [PubMed] [Google Scholar]
- 15.McKinlay JB, Trachtenberg F, Marceau LD, Katz JN, Fischer MA. Effects of patient medication requests on physician prescribing behavior: Results of a factorial experiment. Med Care. 2014;52(4):294–299. doi: 10.1097/MLR.0000000000000096. [DOI] [PMC free article] [PubMed] [Google Scholar]
- 16.Niven DJ, Rubenfeld GD, Kramer AA, Stelfox HT. Effect of published scientific evidence on glycemic control in adult intensive care units. JAMA Intern Med. 2015;175(5):801–809. doi: 10.1001/jamainternmed.2015.0157. [DOI] [PubMed] [Google Scholar]
- 17.Hripcsak G, et al. Observational Health Data Sciences and Informatics (OHDSI): Opportunities for observational researchers. Stud Health Technol Inform. 2015;216:574–578. [PMC free article] [PubMed] [Google Scholar]
- 18. Observational Health Data Sciences and Informatics (OHDSI) OMOP Common Data Model V5.0. Available at www.ohdsi.org/web/wiki/doku.php?id=documentation:cdm:single-page. Accessed June 1, 2015.
- 19.Overhage JM, Ryan PB, Reich CG, Hartzema AG, Stang PE. Validation of a common data model for active safety surveillance research. J Am Med Inform Assoc. 2012;19(1):54–60. doi: 10.1136/amiajnl-2011-000376. [DOI] [PMC free article] [PubMed] [Google Scholar]
- 20.Simpson SE, et al. Multiple self-controlled case series for large-scale longitudinal observational databases. Biometrics. 2013;69(4):893–902. doi: 10.1111/biom.12078. [DOI] [PubMed] [Google Scholar]
- 21.Schuemie MJ, Ryan PB, DuMouchel W, Suchard MA, Madigan D. Interpreting observational studies: Why empirical calibration is needed to correct p-values. Stat Med. 2014;33(2):209–218. doi: 10.1002/sim.5925. [DOI] [PMC free article] [PubMed] [Google Scholar]
- 22. American Association of Clinical Endocrinologists AACE/ACE Comprehensive Diabetes Management Algorithm 2015 and AACE/ACE Diabetes Clinical Practice Guidelines. Available at https://www.aace.com/publications/algorithm. Accessed June 4, 2015.
- 23. WHO Collaborating Centre for Drug Statistics Methodology ATC: Structure and principles. Available at www.whocc.no/atc/structure_and_principles/. Accessed May 31, 2015.
- 24.Madigan D, et al. Evaluating the impact of database heterogeneity on observational study results. Am J Epidemiol. 2013;178(4):645–651. doi: 10.1093/aje/kwt010. [DOI] [PMC free article] [PubMed] [Google Scholar]
- 25.Lin F, Chou S, Pan S, Chen Y. Mining time dependency patterns in clinical pathways. Int J Med Inform. 2001;62(1):11–25. doi: 10.1016/s1386-5056(01)00126-5. [DOI] [PubMed] [Google Scholar]
- 26.Huang Z, Lu X, Duan H. Using recommendation to support adaptive clinical pathways. J Med Syst. 2012;36(3):1849–1860. doi: 10.1007/s10916-010-9644-3. [DOI] [PubMed] [Google Scholar]
- 27.Huang Z, Lu X, Duan H, Fan W. Summarizing clinical pathways from event logs. J Biomed Inform. 2013;46(1):111–127. doi: 10.1016/j.jbi.2012.10.001. [DOI] [PubMed] [Google Scholar]
- 28.Morgan CL, Puelles J, Poole CD, Currie CJ. The effect of withdrawal of rosiglitazone on treatment pathways, diabetes control and patient outcomes: A retrospective cohort study. J Diabetes Complications. 2014;28(3):360–364. doi: 10.1016/j.jdiacomp.2014.01.007. [DOI] [PubMed] [Google Scholar]
- 29.Hernandez AF, Fleurence RL, Rothman RL. The ADAPTABLE trial and PCORnet: Shining light on a new research paradigm. Ann Intern Med. 2015;163(8):635–636. doi: 10.7326/M15-1460. [DOI] [PubMed] [Google Scholar]
- 30.Pearl J. Causal inference in statistics: An overview. Stat Surv. 2009;3:96–146. [Google Scholar]
- 31.Hill AB. The environment and disease: Association or causation? Proc R Soc Med. 1965;58:295–300. doi: 10.1177/003591576505800503. [DOI] [PMC free article] [PubMed] [Google Scholar]
- 32.Rosenbaum PR, Rubin DB. The central role of the propensity score in observational studies for causal effects. Biometrika. 1983;70(1):41–55. [Google Scholar]
- 33.Whitaker HJ, Farrington CP, Spiessens B, Musonda P. Tutorial in biostatistics: The self-controlled case series method. Stat Med. 2006;25(10):1768–1797. doi: 10.1002/sim.2302. [DOI] [PubMed] [Google Scholar]
- 34.Kleinberg S, Hripcsak G. A review of causal inference for biomedical informatics. J Biomed Inform. 2011;44(6):1102–1112. doi: 10.1016/j.jbi.2011.07.001. [DOI] [PMC free article] [PubMed] [Google Scholar]
- 35.Victora CG, Habicht JP, Bryce J. Evidence-based public health: Moving beyond randomized trials. Am J Public Health. 2004;94(3):400–405. doi: 10.2105/ajph.94.3.400. [DOI] [PMC free article] [PubMed] [Google Scholar]
- 36.Hartman E, Grieve R, Ramsahai R, Sekhon JS. From sample average treatment effect to population average treatment effect on the treated: Combining experimental with observational studies to estimate population treatment effects. J R Stat Soc Ser A Stat Soc. 2015;178(3):757–778. [Google Scholar]
- 37.Fuller J, Flores LJ. The Risk GP Model: The standard model of prediction in medicine. Stud Hist Philos Biol Biomed Sciences. 2015;54:49–61. doi: 10.1016/j.shpsc.2015.06.006. [DOI] [PubMed] [Google Scholar]
- 38.Cornet R, de Keizer N. Forty years of SNOMED: A literature review. BMC Med Inform Decis Mak. 2008;8(Suppl 1):S2. doi: 10.1186/1472-6947-8-S1-S2. [DOI] [PMC free article] [PubMed] [Google Scholar]
- 39.Nelson SJ, Zeng K, Kilbourne J, Powell T, Moore R. Normalized names for clinical drugs: RxNorm at 6 years. J Am Med Inform Assoc. 2011;18(4):441–448. doi: 10.1136/amiajnl-2011-000116. [DOI] [PMC free article] [PubMed] [Google Scholar]
- 40.McDonald CJ, et al. LOINC, a universal standard for identifying laboratory observations: A 5-year update. Clin Chem. 2003;49(4):624–633. doi: 10.1373/49.4.624. [DOI] [PubMed] [Google Scholar]
- 41. MedDRA MSSO Vision: About MedDRA. Available at www.meddra.org/about-meddra/vision. Accessed May 31, 2015.
- 42. International Classification of Diseases, Ninth Revision, Clinical Modification (ICD-9-CM). Available at www.cdc.gov/nchs/icd/icd9cm.htm. Accessed May 28, 2015.
- 43. First Databank, Inc. Multilex. Available at www.fdbhealth.com/multilex-drug-terminology/. Accessed May 31, 2015.
- 44. Observational Health Data Sciences and Informatics (OHDSI). Treatment Pathways in Chronic Disease. Available at www.ohdsi.org/web/wiki/doku.php?id=research:treatment_pathways_in_chronic_disease. Accessed June 1, 2015)
- 45.Venables WN, Smith DM. R Development Core Team 2009. An Introduction to R (Network Theory Limited, Bristol, UK)
Associated Data
This section collects any data citations, data availability statements, or supplementary materials included in this article.


